
Key Insights
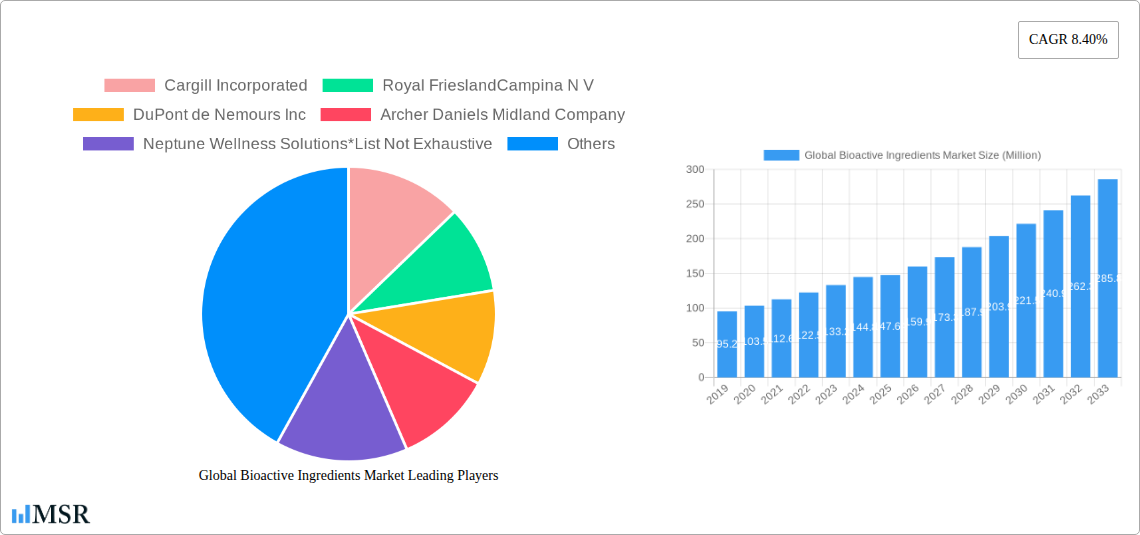
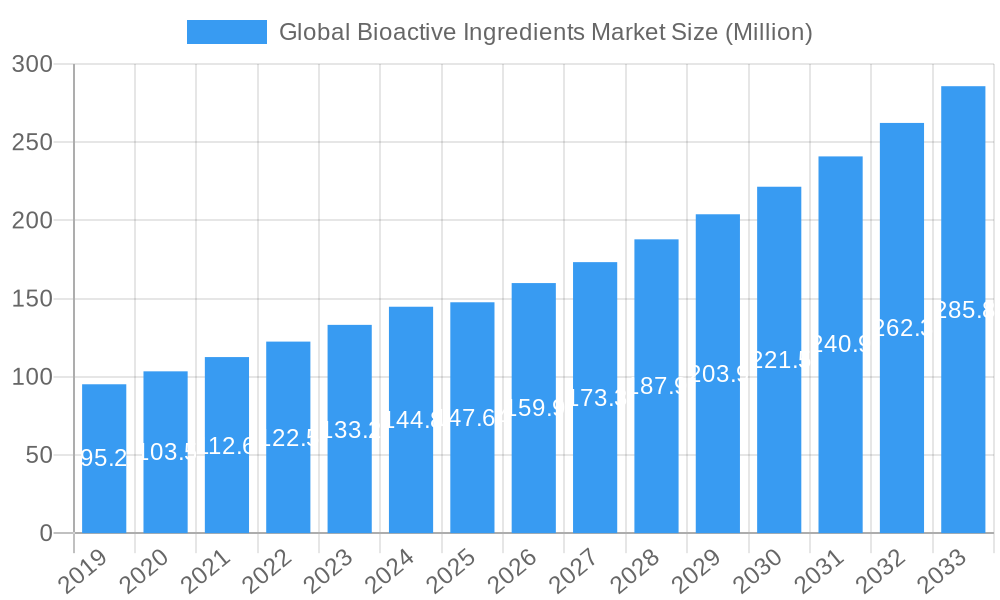
The global bioactive ingredients market is poised for robust expansion, projected to reach a substantial market size of $147.64 million by 2025, with a compelling Compound Annual Growth Rate (CAGR) of 8.40% anticipated throughout the forecast period of 2025-2033. This significant growth is propelled by an increasing consumer consciousness regarding health and wellness, leading to a heightened demand for functional foods, beverages, and dietary supplements enriched with these potent compounds. The growing prevalence of chronic diseases worldwide, coupled with an aging global population, further fuels the adoption of bioactive ingredients as preventive and therapeutic solutions. Key market drivers include advancements in extraction and processing technologies, enabling the isolation of high-purity bioactive compounds, and the expanding applications across diverse industries such as animal nutrition and personal care, driven by their proven efficacy and natural origins.
Global Bioactive Ingredients Market Market Size (In Million)
The market's dynamism is further shaped by evolving consumer preferences towards natural and sustainable products, creating significant opportunities for plant-derived bioactive ingredients like plant extracts and carotenoids. While the market benefits from strong demand, certain restraints, such as stringent regulatory frameworks in specific regions and the high cost of research and development for novel bioactive compounds, may present challenges. However, strategic investments in R&D, innovative product formulations, and the exploration of emerging markets are expected to mitigate these restraints. The competitive landscape is characterized by the presence of major global players, actively engaged in mergers, acquisitions, and strategic partnerships to expand their product portfolios and geographical reach, indicating a highly dynamic and competitive environment focused on innovation and market penetration.
Global Bioactive Ingredients Market Company Market Share
Gain unparalleled insights into the rapidly expanding Global Bioactive Ingredients Market, a pivotal sector driving innovation in food, pharmaceuticals, and personal care. This comprehensive report, covering the study period of 2019–2033 with a base and estimated year of 2025 and a forecast period of 2025–2033, analyzes market dynamics, key segments, emerging opportunities, and leading players shaping the future of health and nutrition. Discover how bioactive ingredients are revolutionizing product formulations and consumer well-being.
Global Bioactive Ingredients Market Market Concentration & Dynamics
The Global Bioactive Ingredients Market exhibits a moderate to high level of concentration, with a few key players holding significant market share. This concentration is balanced by a dynamic innovation ecosystem, driven by continuous research and development in areas like precision fermentation and sustainable sourcing. Regulatory frameworks, while increasingly stringent, are also evolving to accommodate novel ingredients and applications. Substitute products, particularly in the food and beverage and dietary supplement sectors, present a constant challenge, necessitating ongoing product differentiation and efficacy demonstration. End-user trends, such as the rising demand for plant-based alternatives and personalized nutrition, are profoundly influencing market strategies. Mergers and acquisitions (M&A) are a significant driver of market consolidation and expansion, with a projected increase in M&A deal counts as companies seek to strengthen their portfolios and gain a competitive edge. For instance, the market share of major players is estimated to be substantial, with the top 5 companies accounting for over 40% of the global market in 2025. Recent M&A activities are expected to further consolidate key segments.
Global Bioactive Ingredients Market Industry Insights & Trends
The Global Bioactive Ingredients Market is projected to reach an estimated market size of $35,000 Million by 2025, driven by a robust Compound Annual Growth Rate (CAGR) of 8.2% during the forecast period of 2025–2033. This impressive growth is fueled by several interconnected factors. The escalating global awareness regarding health and wellness, coupled with an aging population, is a primary market growth driver. Consumers are increasingly seeking functional foods, dietary supplements, and personalized nutrition solutions to prevent chronic diseases and enhance overall well-being. Technological disruptions, such as advancements in extraction, purification, and delivery systems for bioactive compounds, are opening up new application possibilities and improving product efficacy. For example, the development of microencapsulation techniques has significantly enhanced the stability and bioavailability of sensitive bioactives like omega-3 fatty acids and probiotics. Evolving consumer behaviors, including a preference for natural, sustainable, and ethically sourced ingredients, are compelling manufacturers to invest in green technologies and transparent supply chains. The demand for plant-based proteins and peptides, driven by dietary shifts and environmental concerns, is another significant trend. Furthermore, the pharmaceutical industry's growing interest in bioactive compounds for drug development and therapeutic applications contributes to market expansion. The increasing integration of bioactive ingredients into everyday products, from fortified foods to advanced skincare, underscores their pervasive influence.
Key Markets & Segments Leading Global Bioactive Ingredients Market
The Global Bioactive Ingredients Market is dominated by North America and Europe, driven by high consumer spending on health and wellness products, advanced research and development infrastructure, and stringent quality control standards. Within these regions, countries like the United States and Germany lead in terms of market size and innovation.
From an Ingredient Type perspective, Probiotics and Prebiotics are experiencing exceptional growth, fueled by the expanding gut health market and increasing consumer understanding of the microbiome's impact on overall health.
- Drivers for Probiotics and Prebiotics:
- Rising consumer awareness of digestive health benefits.
- Growing demand for functional foods and beverages.
- Extensive research linking gut health to immunity and mental well-being.
Omega-3 Fatty Acids continue to be a cornerstone of the bioactive ingredients market, particularly due to their cardiovascular and cognitive health benefits, with a growing demand for algae-derived alternatives to fish oil.
- Drivers for Omega-3 Fatty Acids:
- Established health benefits for heart and brain health.
- Increasing adoption in infant nutrition and dietary supplements.
- Sustainability concerns driving innovation in plant and algae-based sources.
Vitamins, especially Vitamin D, Vitamin C, and B vitamins, remain essential, driven by their broad health applications and inclusion in fortified foods and supplements. Plant Extracts, particularly those with antioxidant and anti-inflammatory properties, are also gaining significant traction.
In terms of Application, the Food and Beverages segment holds the largest market share, as manufacturers increasingly incorporate bioactive ingredients to enhance the nutritional profile and functional benefits of their products.
- Drivers for Food and Beverages:
- Consumer preference for convenient health solutions.
- Product innovation in functional foods and drinks.
- Government initiatives promoting healthy eating.
The Dietary Supplements segment is also a major contributor, driven by the proactive health management approach of consumers and the wide availability of specialized bioactive formulations. The Animal Nutrition sector is a growing segment, with bioactive ingredients being utilized to improve animal health, growth, and feed efficiency.
Global Bioactive Ingredients Market Product Developments
Product development in the Global Bioactive Ingredients Market is characterized by a strong emphasis on innovation, efficacy, and sustainability. Companies are actively investing in research to isolate, purify, and formulate novel bioactive compounds with enhanced bioavailability and targeted delivery mechanisms. Recent advancements include the development of novel extraction techniques for plant-based bioactives, the engineering of probiotics for specific health outcomes, and the creation of peptide-based ingredients with potent anti-aging and muscle-building properties. The market is also witnessing a surge in algae-derived ingredients, offering sustainable alternatives to traditional sources. These developments are crucial for expanding applications across the food, beverage, pharmaceutical, and personal care industries, creating a competitive edge for manufacturers and addressing evolving consumer demands for healthier, more effective products.
Challenges in the Global Bioactive Ingredients Market Market
Despite its robust growth, the Global Bioactive Ingredients Market faces several challenges. Regulatory hurdles can be significant, with differing standards across regions impacting market entry and product approval. Supply chain complexities for sourcing raw materials, particularly natural and organic ingredients, can lead to price volatility and availability issues. Intense competition from both established players and emerging innovators necessitates continuous investment in R&D and marketing. Furthermore, consumer perception and education regarding the efficacy and safety of certain bioactives remain critical factors. The cost of production for specialized bioactive ingredients can also be a barrier to wider adoption in price-sensitive markets.
Forces Driving Global Bioactive Ingredients Market Growth
The Global Bioactive Ingredients Market is propelled by several powerful forces. The overarching trend of increasing global health consciousness and preventative healthcare is a primary driver. Technological advancements in biotechnology, fermentation, and extraction processes are enabling the development of more potent and diverse bioactive compounds. The growing demand for natural and clean-label ingredients aligns perfectly with the nature of many bioactive ingredients. Economic growth in developing regions, coupled with rising disposable incomes, is expanding the consumer base for health-focused products. Supportive government policies and initiatives promoting healthy lifestyles further bolster market expansion.
Challenges in the Global Bioactive Ingredients Market Market
The long-term growth of the Global Bioactive Ingredients Market is underpinned by sustained innovation and strategic market expansion. The increasing scientific validation of health benefits associated with specific bioactives will continue to drive demand. Partnerships and collaborations between ingredient manufacturers, food and beverage companies, and pharmaceutical firms are crucial for developing and commercializing new applications. Expanding into emerging markets with growing health awareness and improving distribution networks will unlock significant growth potential. The development of cost-effective and sustainable production methods will also be key to maintaining market momentum and ensuring broader accessibility.
Emerging Opportunities in Global Bioactive Ingredients Market
Emerging opportunities in the Global Bioactive Ingredients Market are abundant and diverse. The rapidly growing personalized nutrition market presents a significant avenue for tailored bioactive ingredient formulations. Advancements in synthetic biology and precision fermentation are opening doors for novel, sustainable, and highly specific bioactives. The burgeoning demand for natural ingredients in the personal care and beauty sector, particularly for anti-aging and skin health benefits, offers substantial growth potential. Furthermore, the application of bioactives in functional foods and beverages targeting specific health conditions, such as cognitive decline and immune support, is a key emerging trend. The exploration of bioactives derived from underutilized natural sources also presents exciting possibilities.
Leading Players in the Global Bioactive Ingredients Market Sector
- Cargill Incorporated
- Royal FrieslandCampina N V
- DuPont de Nemours Inc
- Archer Daniels Midland Company
- Neptune Wellness Solutions
- Chr Hansen Holding A/S
- BASF SE
- Kerry Group
- Advanced Enzyme Technologies
- Koninklijke DSM NV
- Ingredion Incorporated
Key Milestones in Global Bioactive Ingredients Market Industry
- January 2023: FrieslandCampina partnered with a specialist biotechnology company, Triplebar Bio Inc., to produce and scale up the production of cell-based proteins using precision fermentation. This strategic move highlights the industry's commitment to sustainable protein innovation.
- August 2022: Archer Daniels Midland (ADM) Company and Benson Hill, Inc. announced a long-term strategic partnership to scale innovative soy ingredients. This collaboration focuses on commercializing proprietary ingredients derived from Benson Hill's ultra-high protein (UHP) soybeans, addressing the growing demand for plant-based proteins.
- April 2022: Royal DSM launched a sustainably focused campaign encouraging algae-derived omega-3 ingredients. Expanding its life's™ portfolio, this initiative aims to provide a high-quality, potent omega-3 alternative to fish oil with zero impact on marine life, underscoring a commitment to environmental responsibility.
Strategic Outlook for Global Bioactive Ingredients Market Market
The strategic outlook for the Global Bioactive Ingredients Market is exceptionally positive, driven by a confluence of factors favoring sustained growth and innovation. The increasing consumer demand for health-promoting products, coupled with a deeper understanding of the role of specific nutrients in disease prevention and well-being, will continue to fuel market expansion. Key growth accelerators include the relentless pursuit of novel bioactive compounds, the optimization of existing ingredients for enhanced efficacy and bioavailability, and the strategic integration of these ingredients into a wider range of consumer products. Partnerships and collaborations will remain critical for sharing expertise, accelerating product development, and gaining market access. Furthermore, a focus on sustainable sourcing and production methods will not only meet regulatory demands but also resonate with increasingly environmentally conscious consumers, creating long-term competitive advantages and market leadership opportunities.
Global Bioactive Ingredients Market Segmentation
-
1. Ingredient Type
- 1.1. Probiotics and Prebiotics
- 1.2. Omega-3 Fatty Acids
-
1.3. Vitamins
- 1.3.1. Vitamin A
- 1.3.2. Vitamin B
- 1.3.3. Vitamin C
- 1.3.4. Others
- 1.4. Carotenoids
- 1.5. Plant Extracts
- 1.6. Minerals
- 1.7. Amino Acids, Proteins, and Peptides
-
2. Application
- 2.1. Food and Beverages
- 2.2. Dietary Supplements
- 2.3. Animal Nutrition
- 2.4. Personal and Beauty Care
- 2.5. Pharmaceutical
Global Bioactive Ingredients Market Segmentation By Geography
-
1. North America
- 1.1. United States
- 1.2. Canada
- 1.3. Mexico
- 1.4. Rest of North America
-
2. Europe
- 2.1. Spain
- 2.2. United Kingdom
- 2.3. Germany
- 2.4. France
- 2.5. Italy
- 2.6. Rest of Europe
-
3. Asia Pacific
- 3.1. China
- 3.2. Japan
- 3.3. India
- 3.4. Australia
- 3.5. Rest of Asia Pacific
-
4. South America
- 4.1. Brazil
- 4.2. Argentina
- 4.3. Rest of South America
- 5. Middle East
-
6. South Africa
- 6.1. Saudi Arabia
- 6.2. Rest of Middle East
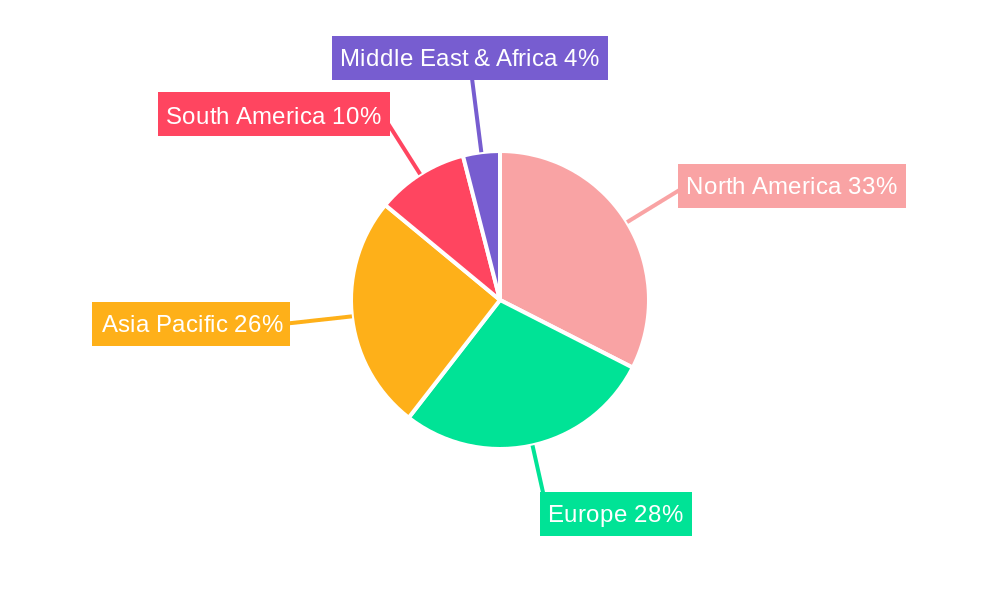
Global Bioactive Ingredients Market Regional Market Share
Geographic Coverage of Global Bioactive Ingredients Market
Global Bioactive Ingredients Market REPORT HIGHLIGHTS
| Aspects | Details |
|---|---|
| Study Period | 2020-2034 |
| Base Year | 2025 |
| Estimated Year | 2026 |
| Forecast Period | 2026-2034 |
| Historical Period | 2020-2025 |
| Growth Rate | CAGR of 8.40% from 2020-2034 |
| Segmentation |
|
Table of Contents
- 1. Introduction
- 1.1. Research Scope
- 1.2. Market Segmentation
- 1.3. Research Methodology
- 1.4. Definitions and Assumptions
- 2. Executive Summary
- 2.1. Introduction
- 3. Market Dynamics
- 3.1. Introduction
- 3.2. Market Drivers
- 3.2.1. Increasing Demand For Convenience & Processed Food
- 3.3. Market Restrains
- 3.3.1. Increased Consumer Awareness On Side-Effects Of Chemical Additives
- 3.4. Market Trends
- 3.4.1. Rising Healthcare Expenditure
- 4. Market Factor Analysis
- 4.1. Porters Five Forces
- 4.2. Supply/Value Chain
- 4.3. PESTEL analysis
- 4.4. Market Entropy
- 4.5. Patent/Trademark Analysis
- 5. Global Bioactive Ingredients Market Analysis, Insights and Forecast, 2020-2032
- 5.1. Market Analysis, Insights and Forecast - by Ingredient Type
- 5.1.1. Probiotics and Prebiotics
- 5.1.2. Omega-3 Fatty Acids
- 5.1.3. Vitamins
- 5.1.3.1. Vitamin A
- 5.1.3.2. Vitamin B
- 5.1.3.3. Vitamin C
- 5.1.3.4. Others
- 5.1.4. Carotenoids
- 5.1.5. Plant Extracts
- 5.1.6. Minerals
- 5.1.7. Amino Acids, Proteins, and Peptides
- 5.2. Market Analysis, Insights and Forecast - by Application
- 5.2.1. Food and Beverages
- 5.2.2. Dietary Supplements
- 5.2.3. Animal Nutrition
- 5.2.4. Personal and Beauty Care
- 5.2.5. Pharmaceutical
- 5.3. Market Analysis, Insights and Forecast - by Region
- 5.3.1. North America
- 5.3.2. Europe
- 5.3.3. Asia Pacific
- 5.3.4. South America
- 5.3.5. Middle East
- 5.3.6. South Africa
- 5.1. Market Analysis, Insights and Forecast - by Ingredient Type
- 6. North America Global Bioactive Ingredients Market Analysis, Insights and Forecast, 2020-2032
- 6.1. Market Analysis, Insights and Forecast - by Ingredient Type
- 6.1.1. Probiotics and Prebiotics
- 6.1.2. Omega-3 Fatty Acids
- 6.1.3. Vitamins
- 6.1.3.1. Vitamin A
- 6.1.3.2. Vitamin B
- 6.1.3.3. Vitamin C
- 6.1.3.4. Others
- 6.1.4. Carotenoids
- 6.1.5. Plant Extracts
- 6.1.6. Minerals
- 6.1.7. Amino Acids, Proteins, and Peptides
- 6.2. Market Analysis, Insights and Forecast - by Application
- 6.2.1. Food and Beverages
- 6.2.2. Dietary Supplements
- 6.2.3. Animal Nutrition
- 6.2.4. Personal and Beauty Care
- 6.2.5. Pharmaceutical
- 6.1. Market Analysis, Insights and Forecast - by Ingredient Type
- 7. Europe Global Bioactive Ingredients Market Analysis, Insights and Forecast, 2020-2032
- 7.1. Market Analysis, Insights and Forecast - by Ingredient Type
- 7.1.1. Probiotics and Prebiotics
- 7.1.2. Omega-3 Fatty Acids
- 7.1.3. Vitamins
- 7.1.3.1. Vitamin A
- 7.1.3.2. Vitamin B
- 7.1.3.3. Vitamin C
- 7.1.3.4. Others
- 7.1.4. Carotenoids
- 7.1.5. Plant Extracts
- 7.1.6. Minerals
- 7.1.7. Amino Acids, Proteins, and Peptides
- 7.2. Market Analysis, Insights and Forecast - by Application
- 7.2.1. Food and Beverages
- 7.2.2. Dietary Supplements
- 7.2.3. Animal Nutrition
- 7.2.4. Personal and Beauty Care
- 7.2.5. Pharmaceutical
- 7.1. Market Analysis, Insights and Forecast - by Ingredient Type
- 8. Asia Pacific Global Bioactive Ingredients Market Analysis, Insights and Forecast, 2020-2032
- 8.1. Market Analysis, Insights and Forecast - by Ingredient Type
- 8.1.1. Probiotics and Prebiotics
- 8.1.2. Omega-3 Fatty Acids
- 8.1.3. Vitamins
- 8.1.3.1. Vitamin A
- 8.1.3.2. Vitamin B
- 8.1.3.3. Vitamin C
- 8.1.3.4. Others
- 8.1.4. Carotenoids
- 8.1.5. Plant Extracts
- 8.1.6. Minerals
- 8.1.7. Amino Acids, Proteins, and Peptides
- 8.2. Market Analysis, Insights and Forecast - by Application
- 8.2.1. Food and Beverages
- 8.2.2. Dietary Supplements
- 8.2.3. Animal Nutrition
- 8.2.4. Personal and Beauty Care
- 8.2.5. Pharmaceutical
- 8.1. Market Analysis, Insights and Forecast - by Ingredient Type
- 9. South America Global Bioactive Ingredients Market Analysis, Insights and Forecast, 2020-2032
- 9.1. Market Analysis, Insights and Forecast - by Ingredient Type
- 9.1.1. Probiotics and Prebiotics
- 9.1.2. Omega-3 Fatty Acids
- 9.1.3. Vitamins
- 9.1.3.1. Vitamin A
- 9.1.3.2. Vitamin B
- 9.1.3.3. Vitamin C
- 9.1.3.4. Others
- 9.1.4. Carotenoids
- 9.1.5. Plant Extracts
- 9.1.6. Minerals
- 9.1.7. Amino Acids, Proteins, and Peptides
- 9.2. Market Analysis, Insights and Forecast - by Application
- 9.2.1. Food and Beverages
- 9.2.2. Dietary Supplements
- 9.2.3. Animal Nutrition
- 9.2.4. Personal and Beauty Care
- 9.2.5. Pharmaceutical
- 9.1. Market Analysis, Insights and Forecast - by Ingredient Type
- 10. Middle East Global Bioactive Ingredients Market Analysis, Insights and Forecast, 2020-2032
- 10.1. Market Analysis, Insights and Forecast - by Ingredient Type
- 10.1.1. Probiotics and Prebiotics
- 10.1.2. Omega-3 Fatty Acids
- 10.1.3. Vitamins
- 10.1.3.1. Vitamin A
- 10.1.3.2. Vitamin B
- 10.1.3.3. Vitamin C
- 10.1.3.4. Others
- 10.1.4. Carotenoids
- 10.1.5. Plant Extracts
- 10.1.6. Minerals
- 10.1.7. Amino Acids, Proteins, and Peptides
- 10.2. Market Analysis, Insights and Forecast - by Application
- 10.2.1. Food and Beverages
- 10.2.2. Dietary Supplements
- 10.2.3. Animal Nutrition
- 10.2.4. Personal and Beauty Care
- 10.2.5. Pharmaceutical
- 10.1. Market Analysis, Insights and Forecast - by Ingredient Type
- 11. South Africa Global Bioactive Ingredients Market Analysis, Insights and Forecast, 2020-2032
- 11.1. Market Analysis, Insights and Forecast - by Ingredient Type
- 11.1.1. Probiotics and Prebiotics
- 11.1.2. Omega-3 Fatty Acids
- 11.1.3. Vitamins
- 11.1.3.1. Vitamin A
- 11.1.3.2. Vitamin B
- 11.1.3.3. Vitamin C
- 11.1.3.4. Others
- 11.1.4. Carotenoids
- 11.1.5. Plant Extracts
- 11.1.6. Minerals
- 11.1.7. Amino Acids, Proteins, and Peptides
- 11.2. Market Analysis, Insights and Forecast - by Application
- 11.2.1. Food and Beverages
- 11.2.2. Dietary Supplements
- 11.2.3. Animal Nutrition
- 11.2.4. Personal and Beauty Care
- 11.2.5. Pharmaceutical
- 11.1. Market Analysis, Insights and Forecast - by Ingredient Type
- 12. North America Global Bioactive Ingredients Market Analysis, Insights and Forecast, 2020-2032
- 12.1. Market Analysis, Insights and Forecast - By Country/Sub-region
- 12.1.1 United States
- 12.1.2 Canada
- 12.1.3 Mexico
- 12.1.4 Rest of North America
- 13. Europe Global Bioactive Ingredients Market Analysis, Insights and Forecast, 2020-2032
- 13.1. Market Analysis, Insights and Forecast - By Country/Sub-region
- 13.1.1 Spain
- 13.1.2 United Kingdom
- 13.1.3 Germany
- 13.1.4 France
- 13.1.5 Italy
- 13.1.6 Rest of Europe
- 14. Asia Pacific Global Bioactive Ingredients Market Analysis, Insights and Forecast, 2020-2032
- 14.1. Market Analysis, Insights and Forecast - By Country/Sub-region
- 14.1.1 China
- 14.1.2 Japan
- 14.1.3 India
- 14.1.4 Australia
- 14.1.5 Rest of Asia Pacific
- 15. South America Global Bioactive Ingredients Market Analysis, Insights and Forecast, 2020-2032
- 15.1. Market Analysis, Insights and Forecast - By Country/Sub-region
- 15.1.1 Brazil
- 15.1.2 Argentina
- 15.1.3 Rest of South America
- 16. Middle East Global Bioactive Ingredients Market Analysis, Insights and Forecast, 2020-2032
- 16.1. Market Analysis, Insights and Forecast - By Country/Sub-region
- 16.1.1 Middle East
- 16.1.2 Africa
- 17. South Africa Global Bioactive Ingredients Market Analysis, Insights and Forecast, 2020-2032
- 17.1. Market Analysis, Insights and Forecast - By Country/Sub-region
- 17.1.1 Saudi Arabia
- 17.1.2 Rest of Middle East
- 18. Competitive Analysis
- 18.1. Market Share Analysis 2025
- 18.2. Company Profiles
- 18.2.1 Cargill Incorporated
- 18.2.1.1. Overview
- 18.2.1.2. Products
- 18.2.1.3. SWOT Analysis
- 18.2.1.4. Recent Developments
- 18.2.1.5. Financials (Based on Availability)
- 18.2.2 Royal FrieslandCampina N V
- 18.2.2.1. Overview
- 18.2.2.2. Products
- 18.2.2.3. SWOT Analysis
- 18.2.2.4. Recent Developments
- 18.2.2.5. Financials (Based on Availability)
- 18.2.3 DuPont de Nemours Inc
- 18.2.3.1. Overview
- 18.2.3.2. Products
- 18.2.3.3. SWOT Analysis
- 18.2.3.4. Recent Developments
- 18.2.3.5. Financials (Based on Availability)
- 18.2.4 Archer Daniels Midland Company
- 18.2.4.1. Overview
- 18.2.4.2. Products
- 18.2.4.3. SWOT Analysis
- 18.2.4.4. Recent Developments
- 18.2.4.5. Financials (Based on Availability)
- 18.2.5 Neptune Wellness Solutions*List Not Exhaustive
- 18.2.5.1. Overview
- 18.2.5.2. Products
- 18.2.5.3. SWOT Analysis
- 18.2.5.4. Recent Developments
- 18.2.5.5. Financials (Based on Availability)
- 18.2.6 Chr Hansen Holding A/S
- 18.2.6.1. Overview
- 18.2.6.2. Products
- 18.2.6.3. SWOT Analysis
- 18.2.6.4. Recent Developments
- 18.2.6.5. Financials (Based on Availability)
- 18.2.7 BASF SE
- 18.2.7.1. Overview
- 18.2.7.2. Products
- 18.2.7.3. SWOT Analysis
- 18.2.7.4. Recent Developments
- 18.2.7.5. Financials (Based on Availability)
- 18.2.8 Kerry Group
- 18.2.8.1. Overview
- 18.2.8.2. Products
- 18.2.8.3. SWOT Analysis
- 18.2.8.4. Recent Developments
- 18.2.8.5. Financials (Based on Availability)
- 18.2.9 Advanced Enzyme Technologies
- 18.2.9.1. Overview
- 18.2.9.2. Products
- 18.2.9.3. SWOT Analysis
- 18.2.9.4. Recent Developments
- 18.2.9.5. Financials (Based on Availability)
- 18.2.10 Koninklijke DSM NV
- 18.2.10.1. Overview
- 18.2.10.2. Products
- 18.2.10.3. SWOT Analysis
- 18.2.10.4. Recent Developments
- 18.2.10.5. Financials (Based on Availability)
- 18.2.11 Ingredion Incorporated
- 18.2.11.1. Overview
- 18.2.11.2. Products
- 18.2.11.3. SWOT Analysis
- 18.2.11.4. Recent Developments
- 18.2.11.5. Financials (Based on Availability)
- 18.2.1 Cargill Incorporated
List of Figures
- Figure 1: Global Global Bioactive Ingredients Market Revenue Breakdown (Million, %) by Region 2025 & 2033
- Figure 2: Global Global Bioactive Ingredients Market Volume Breakdown (K Tons, %) by Region 2025 & 2033
- Figure 3: North America Global Bioactive Ingredients Market Revenue (Million), by Country 2025 & 2033
- Figure 4: North America Global Bioactive Ingredients Market Volume (K Tons), by Country 2025 & 2033
- Figure 5: North America Global Bioactive Ingredients Market Revenue Share (%), by Country 2025 & 2033
- Figure 6: North America Global Bioactive Ingredients Market Volume Share (%), by Country 2025 & 2033
- Figure 7: Europe Global Bioactive Ingredients Market Revenue (Million), by Country 2025 & 2033
- Figure 8: Europe Global Bioactive Ingredients Market Volume (K Tons), by Country 2025 & 2033
- Figure 9: Europe Global Bioactive Ingredients Market Revenue Share (%), by Country 2025 & 2033
- Figure 10: Europe Global Bioactive Ingredients Market Volume Share (%), by Country 2025 & 2033
- Figure 11: Asia Pacific Global Bioactive Ingredients Market Revenue (Million), by Country 2025 & 2033
- Figure 12: Asia Pacific Global Bioactive Ingredients Market Volume (K Tons), by Country 2025 & 2033
- Figure 13: Asia Pacific Global Bioactive Ingredients Market Revenue Share (%), by Country 2025 & 2033
- Figure 14: Asia Pacific Global Bioactive Ingredients Market Volume Share (%), by Country 2025 & 2033
- Figure 15: South America Global Bioactive Ingredients Market Revenue (Million), by Country 2025 & 2033
- Figure 16: South America Global Bioactive Ingredients Market Volume (K Tons), by Country 2025 & 2033
- Figure 17: South America Global Bioactive Ingredients Market Revenue Share (%), by Country 2025 & 2033
- Figure 18: South America Global Bioactive Ingredients Market Volume Share (%), by Country 2025 & 2033
- Figure 19: Middle East Global Bioactive Ingredients Market Revenue (Million), by Country 2025 & 2033
- Figure 20: Middle East Global Bioactive Ingredients Market Volume (K Tons), by Country 2025 & 2033
- Figure 21: Middle East Global Bioactive Ingredients Market Revenue Share (%), by Country 2025 & 2033
- Figure 22: Middle East Global Bioactive Ingredients Market Volume Share (%), by Country 2025 & 2033
- Figure 23: South Africa Global Bioactive Ingredients Market Revenue (Million), by Country 2025 & 2033
- Figure 24: South Africa Global Bioactive Ingredients Market Volume (K Tons), by Country 2025 & 2033
- Figure 25: South Africa Global Bioactive Ingredients Market Revenue Share (%), by Country 2025 & 2033
- Figure 26: South Africa Global Bioactive Ingredients Market Volume Share (%), by Country 2025 & 2033
- Figure 27: North America Global Bioactive Ingredients Market Revenue (Million), by Ingredient Type 2025 & 2033
- Figure 28: North America Global Bioactive Ingredients Market Volume (K Tons), by Ingredient Type 2025 & 2033
- Figure 29: North America Global Bioactive Ingredients Market Revenue Share (%), by Ingredient Type 2025 & 2033
- Figure 30: North America Global Bioactive Ingredients Market Volume Share (%), by Ingredient Type 2025 & 2033
- Figure 31: North America Global Bioactive Ingredients Market Revenue (Million), by Application 2025 & 2033
- Figure 32: North America Global Bioactive Ingredients Market Volume (K Tons), by Application 2025 & 2033
- Figure 33: North America Global Bioactive Ingredients Market Revenue Share (%), by Application 2025 & 2033
- Figure 34: North America Global Bioactive Ingredients Market Volume Share (%), by Application 2025 & 2033
- Figure 35: North America Global Bioactive Ingredients Market Revenue (Million), by Country 2025 & 2033
- Figure 36: North America Global Bioactive Ingredients Market Volume (K Tons), by Country 2025 & 2033
- Figure 37: North America Global Bioactive Ingredients Market Revenue Share (%), by Country 2025 & 2033
- Figure 38: North America Global Bioactive Ingredients Market Volume Share (%), by Country 2025 & 2033
- Figure 39: Europe Global Bioactive Ingredients Market Revenue (Million), by Ingredient Type 2025 & 2033
- Figure 40: Europe Global Bioactive Ingredients Market Volume (K Tons), by Ingredient Type 2025 & 2033
- Figure 41: Europe Global Bioactive Ingredients Market Revenue Share (%), by Ingredient Type 2025 & 2033
- Figure 42: Europe Global Bioactive Ingredients Market Volume Share (%), by Ingredient Type 2025 & 2033
- Figure 43: Europe Global Bioactive Ingredients Market Revenue (Million), by Application 2025 & 2033
- Figure 44: Europe Global Bioactive Ingredients Market Volume (K Tons), by Application 2025 & 2033
- Figure 45: Europe Global Bioactive Ingredients Market Revenue Share (%), by Application 2025 & 2033
- Figure 46: Europe Global Bioactive Ingredients Market Volume Share (%), by Application 2025 & 2033
- Figure 47: Europe Global Bioactive Ingredients Market Revenue (Million), by Country 2025 & 2033
- Figure 48: Europe Global Bioactive Ingredients Market Volume (K Tons), by Country 2025 & 2033
- Figure 49: Europe Global Bioactive Ingredients Market Revenue Share (%), by Country 2025 & 2033
- Figure 50: Europe Global Bioactive Ingredients Market Volume Share (%), by Country 2025 & 2033
- Figure 51: Asia Pacific Global Bioactive Ingredients Market Revenue (Million), by Ingredient Type 2025 & 2033
- Figure 52: Asia Pacific Global Bioactive Ingredients Market Volume (K Tons), by Ingredient Type 2025 & 2033
- Figure 53: Asia Pacific Global Bioactive Ingredients Market Revenue Share (%), by Ingredient Type 2025 & 2033
- Figure 54: Asia Pacific Global Bioactive Ingredients Market Volume Share (%), by Ingredient Type 2025 & 2033
- Figure 55: Asia Pacific Global Bioactive Ingredients Market Revenue (Million), by Application 2025 & 2033
- Figure 56: Asia Pacific Global Bioactive Ingredients Market Volume (K Tons), by Application 2025 & 2033
- Figure 57: Asia Pacific Global Bioactive Ingredients Market Revenue Share (%), by Application 2025 & 2033
- Figure 58: Asia Pacific Global Bioactive Ingredients Market Volume Share (%), by Application 2025 & 2033
- Figure 59: Asia Pacific Global Bioactive Ingredients Market Revenue (Million), by Country 2025 & 2033
- Figure 60: Asia Pacific Global Bioactive Ingredients Market Volume (K Tons), by Country 2025 & 2033
- Figure 61: Asia Pacific Global Bioactive Ingredients Market Revenue Share (%), by Country 2025 & 2033
- Figure 62: Asia Pacific Global Bioactive Ingredients Market Volume Share (%), by Country 2025 & 2033
- Figure 63: South America Global Bioactive Ingredients Market Revenue (Million), by Ingredient Type 2025 & 2033
- Figure 64: South America Global Bioactive Ingredients Market Volume (K Tons), by Ingredient Type 2025 & 2033
- Figure 65: South America Global Bioactive Ingredients Market Revenue Share (%), by Ingredient Type 2025 & 2033
- Figure 66: South America Global Bioactive Ingredients Market Volume Share (%), by Ingredient Type 2025 & 2033
- Figure 67: South America Global Bioactive Ingredients Market Revenue (Million), by Application 2025 & 2033
- Figure 68: South America Global Bioactive Ingredients Market Volume (K Tons), by Application 2025 & 2033
- Figure 69: South America Global Bioactive Ingredients Market Revenue Share (%), by Application 2025 & 2033
- Figure 70: South America Global Bioactive Ingredients Market Volume Share (%), by Application 2025 & 2033
- Figure 71: South America Global Bioactive Ingredients Market Revenue (Million), by Country 2025 & 2033
- Figure 72: South America Global Bioactive Ingredients Market Volume (K Tons), by Country 2025 & 2033
- Figure 73: South America Global Bioactive Ingredients Market Revenue Share (%), by Country 2025 & 2033
- Figure 74: South America Global Bioactive Ingredients Market Volume Share (%), by Country 2025 & 2033
- Figure 75: Middle East Global Bioactive Ingredients Market Revenue (Million), by Ingredient Type 2025 & 2033
- Figure 76: Middle East Global Bioactive Ingredients Market Volume (K Tons), by Ingredient Type 2025 & 2033
- Figure 77: Middle East Global Bioactive Ingredients Market Revenue Share (%), by Ingredient Type 2025 & 2033
- Figure 78: Middle East Global Bioactive Ingredients Market Volume Share (%), by Ingredient Type 2025 & 2033
- Figure 79: Middle East Global Bioactive Ingredients Market Revenue (Million), by Application 2025 & 2033
- Figure 80: Middle East Global Bioactive Ingredients Market Volume (K Tons), by Application 2025 & 2033
- Figure 81: Middle East Global Bioactive Ingredients Market Revenue Share (%), by Application 2025 & 2033
- Figure 82: Middle East Global Bioactive Ingredients Market Volume Share (%), by Application 2025 & 2033
- Figure 83: Middle East Global Bioactive Ingredients Market Revenue (Million), by Country 2025 & 2033
- Figure 84: Middle East Global Bioactive Ingredients Market Volume (K Tons), by Country 2025 & 2033
- Figure 85: Middle East Global Bioactive Ingredients Market Revenue Share (%), by Country 2025 & 2033
- Figure 86: Middle East Global Bioactive Ingredients Market Volume Share (%), by Country 2025 & 2033
- Figure 87: South Africa Global Bioactive Ingredients Market Revenue (Million), by Ingredient Type 2025 & 2033
- Figure 88: South Africa Global Bioactive Ingredients Market Volume (K Tons), by Ingredient Type 2025 & 2033
- Figure 89: South Africa Global Bioactive Ingredients Market Revenue Share (%), by Ingredient Type 2025 & 2033
- Figure 90: South Africa Global Bioactive Ingredients Market Volume Share (%), by Ingredient Type 2025 & 2033
- Figure 91: South Africa Global Bioactive Ingredients Market Revenue (Million), by Application 2025 & 2033
- Figure 92: South Africa Global Bioactive Ingredients Market Volume (K Tons), by Application 2025 & 2033
- Figure 93: South Africa Global Bioactive Ingredients Market Revenue Share (%), by Application 2025 & 2033
- Figure 94: South Africa Global Bioactive Ingredients Market Volume Share (%), by Application 2025 & 2033
- Figure 95: South Africa Global Bioactive Ingredients Market Revenue (Million), by Country 2025 & 2033
- Figure 96: South Africa Global Bioactive Ingredients Market Volume (K Tons), by Country 2025 & 2033
- Figure 97: South Africa Global Bioactive Ingredients Market Revenue Share (%), by Country 2025 & 2033
- Figure 98: South Africa Global Bioactive Ingredients Market Volume Share (%), by Country 2025 & 2033
List of Tables
- Table 1: Global Bioactive Ingredients Market Revenue Million Forecast, by Region 2020 & 2033
- Table 2: Global Bioactive Ingredients Market Volume K Tons Forecast, by Region 2020 & 2033
- Table 3: Global Bioactive Ingredients Market Revenue Million Forecast, by Ingredient Type 2020 & 2033
- Table 4: Global Bioactive Ingredients Market Volume K Tons Forecast, by Ingredient Type 2020 & 2033
- Table 5: Global Bioactive Ingredients Market Revenue Million Forecast, by Application 2020 & 2033
- Table 6: Global Bioactive Ingredients Market Volume K Tons Forecast, by Application 2020 & 2033
- Table 7: Global Bioactive Ingredients Market Revenue Million Forecast, by Region 2020 & 2033
- Table 8: Global Bioactive Ingredients Market Volume K Tons Forecast, by Region 2020 & 2033
- Table 9: Global Bioactive Ingredients Market Revenue Million Forecast, by Country 2020 & 2033
- Table 10: Global Bioactive Ingredients Market Volume K Tons Forecast, by Country 2020 & 2033
- Table 11: United States Global Bioactive Ingredients Market Revenue (Million) Forecast, by Application 2020 & 2033
- Table 12: United States Global Bioactive Ingredients Market Volume (K Tons) Forecast, by Application 2020 & 2033
- Table 13: Canada Global Bioactive Ingredients Market Revenue (Million) Forecast, by Application 2020 & 2033
- Table 14: Canada Global Bioactive Ingredients Market Volume (K Tons) Forecast, by Application 2020 & 2033
- Table 15: Mexico Global Bioactive Ingredients Market Revenue (Million) Forecast, by Application 2020 & 2033
- Table 16: Mexico Global Bioactive Ingredients Market Volume (K Tons) Forecast, by Application 2020 & 2033
- Table 17: Rest of North America Global Bioactive Ingredients Market Revenue (Million) Forecast, by Application 2020 & 2033
- Table 18: Rest of North America Global Bioactive Ingredients Market Volume (K Tons) Forecast, by Application 2020 & 2033
- Table 19: Global Bioactive Ingredients Market Revenue Million Forecast, by Country 2020 & 2033
- Table 20: Global Bioactive Ingredients Market Volume K Tons Forecast, by Country 2020 & 2033
- Table 21: Spain Global Bioactive Ingredients Market Revenue (Million) Forecast, by Application 2020 & 2033
- Table 22: Spain Global Bioactive Ingredients Market Volume (K Tons) Forecast, by Application 2020 & 2033
- Table 23: United Kingdom Global Bioactive Ingredients Market Revenue (Million) Forecast, by Application 2020 & 2033
- Table 24: United Kingdom Global Bioactive Ingredients Market Volume (K Tons) Forecast, by Application 2020 & 2033
- Table 25: Germany Global Bioactive Ingredients Market Revenue (Million) Forecast, by Application 2020 & 2033
- Table 26: Germany Global Bioactive Ingredients Market Volume (K Tons) Forecast, by Application 2020 & 2033
- Table 27: France Global Bioactive Ingredients Market Revenue (Million) Forecast, by Application 2020 & 2033
- Table 28: France Global Bioactive Ingredients Market Volume (K Tons) Forecast, by Application 2020 & 2033
- Table 29: Italy Global Bioactive Ingredients Market Revenue (Million) Forecast, by Application 2020 & 2033
- Table 30: Italy Global Bioactive Ingredients Market Volume (K Tons) Forecast, by Application 2020 & 2033
- Table 31: Rest of Europe Global Bioactive Ingredients Market Revenue (Million) Forecast, by Application 2020 & 2033
- Table 32: Rest of Europe Global Bioactive Ingredients Market Volume (K Tons) Forecast, by Application 2020 & 2033
- Table 33: Global Bioactive Ingredients Market Revenue Million Forecast, by Country 2020 & 2033
- Table 34: Global Bioactive Ingredients Market Volume K Tons Forecast, by Country 2020 & 2033
- Table 35: China Global Bioactive Ingredients Market Revenue (Million) Forecast, by Application 2020 & 2033
- Table 36: China Global Bioactive Ingredients Market Volume (K Tons) Forecast, by Application 2020 & 2033
- Table 37: Japan Global Bioactive Ingredients Market Revenue (Million) Forecast, by Application 2020 & 2033
- Table 38: Japan Global Bioactive Ingredients Market Volume (K Tons) Forecast, by Application 2020 & 2033
- Table 39: India Global Bioactive Ingredients Market Revenue (Million) Forecast, by Application 2020 & 2033
- Table 40: India Global Bioactive Ingredients Market Volume (K Tons) Forecast, by Application 2020 & 2033
- Table 41: Australia Global Bioactive Ingredients Market Revenue (Million) Forecast, by Application 2020 & 2033
- Table 42: Australia Global Bioactive Ingredients Market Volume (K Tons) Forecast, by Application 2020 & 2033
- Table 43: Rest of Asia Pacific Global Bioactive Ingredients Market Revenue (Million) Forecast, by Application 2020 & 2033
- Table 44: Rest of Asia Pacific Global Bioactive Ingredients Market Volume (K Tons) Forecast, by Application 2020 & 2033
- Table 45: Global Bioactive Ingredients Market Revenue Million Forecast, by Country 2020 & 2033
- Table 46: Global Bioactive Ingredients Market Volume K Tons Forecast, by Country 2020 & 2033
- Table 47: Brazil Global Bioactive Ingredients Market Revenue (Million) Forecast, by Application 2020 & 2033
- Table 48: Brazil Global Bioactive Ingredients Market Volume (K Tons) Forecast, by Application 2020 & 2033
- Table 49: Argentina Global Bioactive Ingredients Market Revenue (Million) Forecast, by Application 2020 & 2033
- Table 50: Argentina Global Bioactive Ingredients Market Volume (K Tons) Forecast, by Application 2020 & 2033
- Table 51: Rest of South America Global Bioactive Ingredients Market Revenue (Million) Forecast, by Application 2020 & 2033
- Table 52: Rest of South America Global Bioactive Ingredients Market Volume (K Tons) Forecast, by Application 2020 & 2033
- Table 53: Global Bioactive Ingredients Market Revenue Million Forecast, by Country 2020 & 2033
- Table 54: Global Bioactive Ingredients Market Volume K Tons Forecast, by Country 2020 & 2033
- Table 55: Middle East Global Bioactive Ingredients Market Revenue (Million) Forecast, by Application 2020 & 2033
- Table 56: Middle East Global Bioactive Ingredients Market Volume (K Tons) Forecast, by Application 2020 & 2033
- Table 57: Africa Global Bioactive Ingredients Market Revenue (Million) Forecast, by Application 2020 & 2033
- Table 58: Africa Global Bioactive Ingredients Market Volume (K Tons) Forecast, by Application 2020 & 2033
- Table 59: Global Bioactive Ingredients Market Revenue Million Forecast, by Country 2020 & 2033
- Table 60: Global Bioactive Ingredients Market Volume K Tons Forecast, by Country 2020 & 2033
- Table 61: Saudi Arabia Global Bioactive Ingredients Market Revenue (Million) Forecast, by Application 2020 & 2033
- Table 62: Saudi Arabia Global Bioactive Ingredients Market Volume (K Tons) Forecast, by Application 2020 & 2033
- Table 63: Rest of Middle East Global Bioactive Ingredients Market Revenue (Million) Forecast, by Application 2020 & 2033
- Table 64: Rest of Middle East Global Bioactive Ingredients Market Volume (K Tons) Forecast, by Application 2020 & 2033
- Table 65: Global Bioactive Ingredients Market Revenue Million Forecast, by Ingredient Type 2020 & 2033
- Table 66: Global Bioactive Ingredients Market Volume K Tons Forecast, by Ingredient Type 2020 & 2033
- Table 67: Global Bioactive Ingredients Market Revenue Million Forecast, by Application 2020 & 2033
- Table 68: Global Bioactive Ingredients Market Volume K Tons Forecast, by Application 2020 & 2033
- Table 69: Global Bioactive Ingredients Market Revenue Million Forecast, by Country 2020 & 2033
- Table 70: Global Bioactive Ingredients Market Volume K Tons Forecast, by Country 2020 & 2033
- Table 71: United States Global Bioactive Ingredients Market Revenue (Million) Forecast, by Application 2020 & 2033
- Table 72: United States Global Bioactive Ingredients Market Volume (K Tons) Forecast, by Application 2020 & 2033
- Table 73: Canada Global Bioactive Ingredients Market Revenue (Million) Forecast, by Application 2020 & 2033
- Table 74: Canada Global Bioactive Ingredients Market Volume (K Tons) Forecast, by Application 2020 & 2033
- Table 75: Mexico Global Bioactive Ingredients Market Revenue (Million) Forecast, by Application 2020 & 2033
- Table 76: Mexico Global Bioactive Ingredients Market Volume (K Tons) Forecast, by Application 2020 & 2033
- Table 77: Rest of North America Global Bioactive Ingredients Market Revenue (Million) Forecast, by Application 2020 & 2033
- Table 78: Rest of North America Global Bioactive Ingredients Market Volume (K Tons) Forecast, by Application 2020 & 2033
- Table 79: Global Bioactive Ingredients Market Revenue Million Forecast, by Ingredient Type 2020 & 2033
- Table 80: Global Bioactive Ingredients Market Volume K Tons Forecast, by Ingredient Type 2020 & 2033
- Table 81: Global Bioactive Ingredients Market Revenue Million Forecast, by Application 2020 & 2033
- Table 82: Global Bioactive Ingredients Market Volume K Tons Forecast, by Application 2020 & 2033
- Table 83: Global Bioactive Ingredients Market Revenue Million Forecast, by Country 2020 & 2033
- Table 84: Global Bioactive Ingredients Market Volume K Tons Forecast, by Country 2020 & 2033
- Table 85: Spain Global Bioactive Ingredients Market Revenue (Million) Forecast, by Application 2020 & 2033
- Table 86: Spain Global Bioactive Ingredients Market Volume (K Tons) Forecast, by Application 2020 & 2033
- Table 87: United Kingdom Global Bioactive Ingredients Market Revenue (Million) Forecast, by Application 2020 & 2033
- Table 88: United Kingdom Global Bioactive Ingredients Market Volume (K Tons) Forecast, by Application 2020 & 2033
- Table 89: Germany Global Bioactive Ingredients Market Revenue (Million) Forecast, by Application 2020 & 2033
- Table 90: Germany Global Bioactive Ingredients Market Volume (K Tons) Forecast, by Application 2020 & 2033
- Table 91: France Global Bioactive Ingredients Market Revenue (Million) Forecast, by Application 2020 & 2033
- Table 92: France Global Bioactive Ingredients Market Volume (K Tons) Forecast, by Application 2020 & 2033
- Table 93: Italy Global Bioactive Ingredients Market Revenue (Million) Forecast, by Application 2020 & 2033
- Table 94: Italy Global Bioactive Ingredients Market Volume (K Tons) Forecast, by Application 2020 & 2033
- Table 95: Rest of Europe Global Bioactive Ingredients Market Revenue (Million) Forecast, by Application 2020 & 2033
- Table 96: Rest of Europe Global Bioactive Ingredients Market Volume (K Tons) Forecast, by Application 2020 & 2033
- Table 97: Global Bioactive Ingredients Market Revenue Million Forecast, by Ingredient Type 2020 & 2033
- Table 98: Global Bioactive Ingredients Market Volume K Tons Forecast, by Ingredient Type 2020 & 2033
- Table 99: Global Bioactive Ingredients Market Revenue Million Forecast, by Application 2020 & 2033
- Table 100: Global Bioactive Ingredients Market Volume K Tons Forecast, by Application 2020 & 2033
- Table 101: Global Bioactive Ingredients Market Revenue Million Forecast, by Country 2020 & 2033
- Table 102: Global Bioactive Ingredients Market Volume K Tons Forecast, by Country 2020 & 2033
- Table 103: China Global Bioactive Ingredients Market Revenue (Million) Forecast, by Application 2020 & 2033
- Table 104: China Global Bioactive Ingredients Market Volume (K Tons) Forecast, by Application 2020 & 2033
- Table 105: Japan Global Bioactive Ingredients Market Revenue (Million) Forecast, by Application 2020 & 2033
- Table 106: Japan Global Bioactive Ingredients Market Volume (K Tons) Forecast, by Application 2020 & 2033
- Table 107: India Global Bioactive Ingredients Market Revenue (Million) Forecast, by Application 2020 & 2033
- Table 108: India Global Bioactive Ingredients Market Volume (K Tons) Forecast, by Application 2020 & 2033
- Table 109: Australia Global Bioactive Ingredients Market Revenue (Million) Forecast, by Application 2020 & 2033
- Table 110: Australia Global Bioactive Ingredients Market Volume (K Tons) Forecast, by Application 2020 & 2033
- Table 111: Rest of Asia Pacific Global Bioactive Ingredients Market Revenue (Million) Forecast, by Application 2020 & 2033
- Table 112: Rest of Asia Pacific Global Bioactive Ingredients Market Volume (K Tons) Forecast, by Application 2020 & 2033
- Table 113: Global Bioactive Ingredients Market Revenue Million Forecast, by Ingredient Type 2020 & 2033
- Table 114: Global Bioactive Ingredients Market Volume K Tons Forecast, by Ingredient Type 2020 & 2033
- Table 115: Global Bioactive Ingredients Market Revenue Million Forecast, by Application 2020 & 2033
- Table 116: Global Bioactive Ingredients Market Volume K Tons Forecast, by Application 2020 & 2033
- Table 117: Global Bioactive Ingredients Market Revenue Million Forecast, by Country 2020 & 2033
- Table 118: Global Bioactive Ingredients Market Volume K Tons Forecast, by Country 2020 & 2033
- Table 119: Brazil Global Bioactive Ingredients Market Revenue (Million) Forecast, by Application 2020 & 2033
- Table 120: Brazil Global Bioactive Ingredients Market Volume (K Tons) Forecast, by Application 2020 & 2033
- Table 121: Argentina Global Bioactive Ingredients Market Revenue (Million) Forecast, by Application 2020 & 2033
- Table 122: Argentina Global Bioactive Ingredients Market Volume (K Tons) Forecast, by Application 2020 & 2033
- Table 123: Rest of South America Global Bioactive Ingredients Market Revenue (Million) Forecast, by Application 2020 & 2033
- Table 124: Rest of South America Global Bioactive Ingredients Market Volume (K Tons) Forecast, by Application 2020 & 2033
- Table 125: Global Bioactive Ingredients Market Revenue Million Forecast, by Ingredient Type 2020 & 2033
- Table 126: Global Bioactive Ingredients Market Volume K Tons Forecast, by Ingredient Type 2020 & 2033
- Table 127: Global Bioactive Ingredients Market Revenue Million Forecast, by Application 2020 & 2033
- Table 128: Global Bioactive Ingredients Market Volume K Tons Forecast, by Application 2020 & 2033
- Table 129: Global Bioactive Ingredients Market Revenue Million Forecast, by Country 2020 & 2033
- Table 130: Global Bioactive Ingredients Market Volume K Tons Forecast, by Country 2020 & 2033
- Table 131: Global Bioactive Ingredients Market Revenue Million Forecast, by Ingredient Type 2020 & 2033
- Table 132: Global Bioactive Ingredients Market Volume K Tons Forecast, by Ingredient Type 2020 & 2033
- Table 133: Global Bioactive Ingredients Market Revenue Million Forecast, by Application 2020 & 2033
- Table 134: Global Bioactive Ingredients Market Volume K Tons Forecast, by Application 2020 & 2033
- Table 135: Global Bioactive Ingredients Market Revenue Million Forecast, by Country 2020 & 2033
- Table 136: Global Bioactive Ingredients Market Volume K Tons Forecast, by Country 2020 & 2033
- Table 137: Saudi Arabia Global Bioactive Ingredients Market Revenue (Million) Forecast, by Application 2020 & 2033
- Table 138: Saudi Arabia Global Bioactive Ingredients Market Volume (K Tons) Forecast, by Application 2020 & 2033
- Table 139: Rest of Middle East Global Bioactive Ingredients Market Revenue (Million) Forecast, by Application 2020 & 2033
- Table 140: Rest of Middle East Global Bioactive Ingredients Market Volume (K Tons) Forecast, by Application 2020 & 2033
Frequently Asked Questions
1. What is the projected Compound Annual Growth Rate (CAGR) of the Global Bioactive Ingredients Market?
The projected CAGR is approximately 8.40%.
2. Which companies are prominent players in the Global Bioactive Ingredients Market?
Key companies in the market include Cargill Incorporated, Royal FrieslandCampina N V, DuPont de Nemours Inc, Archer Daniels Midland Company, Neptune Wellness Solutions*List Not Exhaustive, Chr Hansen Holding A/S, BASF SE, Kerry Group, Advanced Enzyme Technologies, Koninklijke DSM NV, Ingredion Incorporated.
3. What are the main segments of the Global Bioactive Ingredients Market?
The market segments include Ingredient Type, Application.
4. Can you provide details about the market size?
The market size is estimated to be USD 147.64 Million as of 2022.
5. What are some drivers contributing to market growth?
Increasing Demand For Convenience & Processed Food.
6. What are the notable trends driving market growth?
Rising Healthcare Expenditure.
7. Are there any restraints impacting market growth?
Increased Consumer Awareness On Side-Effects Of Chemical Additives.
8. Can you provide examples of recent developments in the market?
January 2023: FrieslandCampina partnered with a specialist biotechnology company, Triplebar Bio Inc. The purpose of this partnership is to produce and scale up the production of cell-based proteins by using precision fermentation.
9. What pricing options are available for accessing the report?
Pricing options include single-user, multi-user, and enterprise licenses priced at USD 4750, USD 5250, and USD 8750 respectively.
10. Is the market size provided in terms of value or volume?
The market size is provided in terms of value, measured in Million and volume, measured in K Tons.
11. Are there any specific market keywords associated with the report?
Yes, the market keyword associated with the report is "Global Bioactive Ingredients Market," which aids in identifying and referencing the specific market segment covered.
12. How do I determine which pricing option suits my needs best?
The pricing options vary based on user requirements and access needs. Individual users may opt for single-user licenses, while businesses requiring broader access may choose multi-user or enterprise licenses for cost-effective access to the report.
13. Are there any additional resources or data provided in the Global Bioactive Ingredients Market report?
While the report offers comprehensive insights, it's advisable to review the specific contents or supplementary materials provided to ascertain if additional resources or data are available.
14. How can I stay updated on further developments or reports in the Global Bioactive Ingredients Market?
To stay informed about further developments, trends, and reports in the Global Bioactive Ingredients Market, consider subscribing to industry newsletters, following relevant companies and organizations, or regularly checking reputable industry news sources and publications.
Methodology
Step 1 - Identification of Relevant Samples Size from Population Database


Step 2 - Approaches for Defining Global Market Size (Value, Volume* & Price*)

Note*: In applicable scenarios
Step 3 - Data Sources
Primary Research
- Web Analytics
- Survey Reports
- Research Institute
- Latest Research Reports
- Opinion Leaders
Secondary Research
- Annual Reports
- White Paper
- Latest Press Release
- Industry Association
- Paid Database
- Investor Presentations

Step 4 - Data Triangulation
Involves using different sources of information in order to increase the validity of a study
These sources are likely to be stakeholders in a program - participants, other researchers, program staff, other community members, and so on.
Then we put all data in single framework & apply various statistical tools to find out the dynamic on the market.
During the analysis stage, feedback from the stakeholder groups would be compared to determine areas of agreement as well as areas of divergence
