

Key Insights
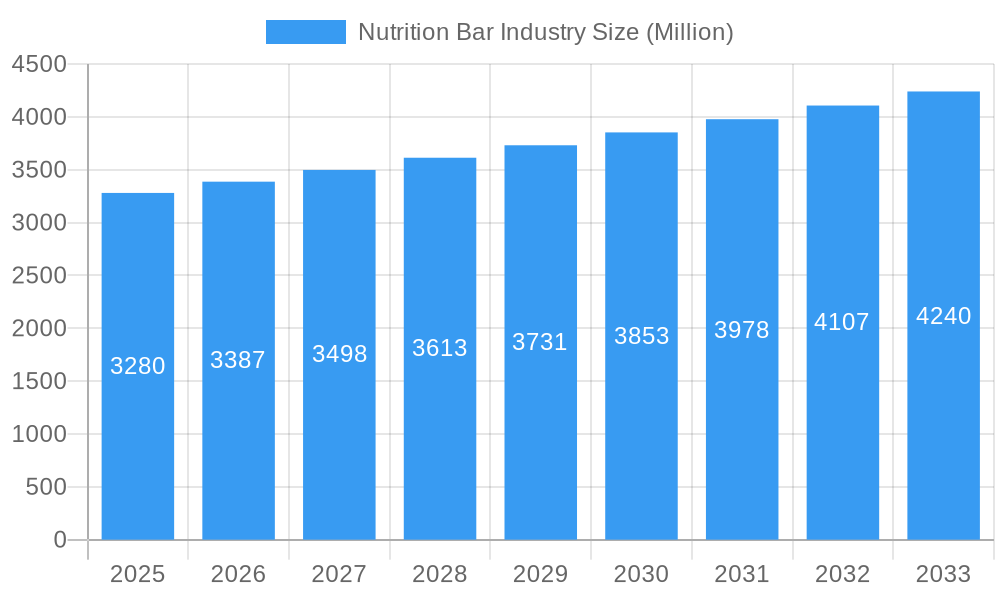
The global Nutrition Bar market is poised for robust expansion, projected to reach a substantial USD 3.28 billion. This growth is underpinned by a Compound Annual Growth Rate (CAGR) of 3.32%, indicating a steady and sustained upward trajectory throughout the forecast period of 2025-2033. The increasing consumer awareness regarding health and wellness, coupled with a growing demand for convenient and on-the-go nutritional solutions, serves as a primary driver for this market's expansion. Consumers are actively seeking products that offer balanced macronutrients, essential vitamins, and minerals, making nutrition bars an attractive option for individuals leading active lifestyles, athletes, and those looking to supplement their daily dietary intake. Furthermore, the evolution of product formulations, with an emphasis on natural ingredients, reduced sugar content, and diverse flavor profiles, is appealing to a broader consumer base and encouraging repeat purchases. The rising disposable incomes in emerging economies are also contributing to the market's growth by increasing consumer purchasing power for premium and health-conscious food products.
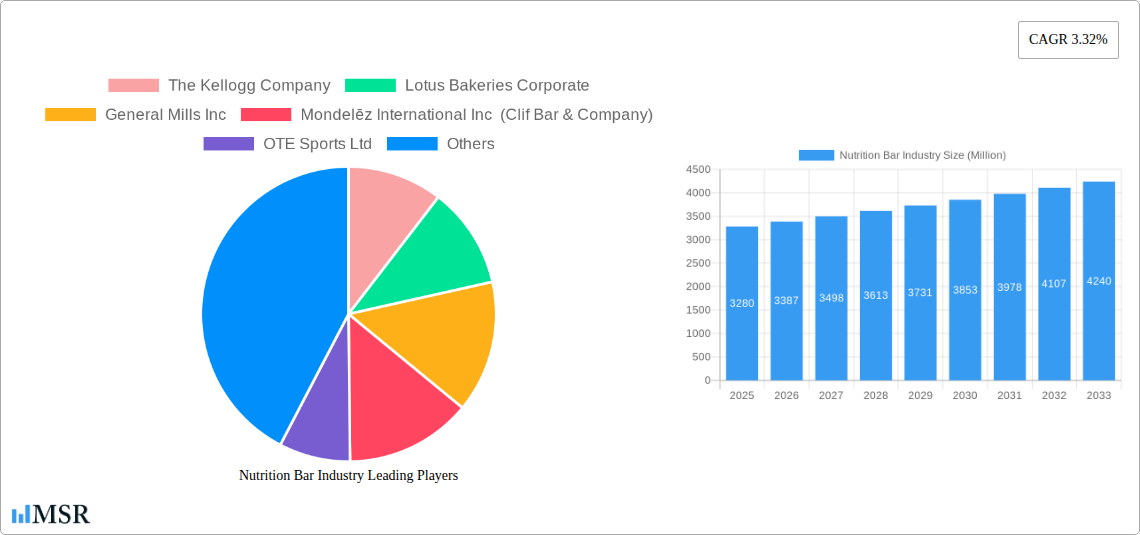
Nutrition Bar Industry Market Size (In Billion)
The market's dynamism is further shaped by its diverse segmentation and the strategic initiatives of key players. The "Organic" segment is experiencing particularly strong traction as consumers increasingly prioritize clean label products and sustainable sourcing. Distribution channels are also evolving, with online retail stores witnessing significant growth due to their convenience and wide product availability, complementing traditional channels like supermarkets and specialty stores. Key industry leaders such as General Mills Inc., Mondelēz International Inc. (Clif Bar & Company), and Mars Incorporated (Kind LLC) are continuously innovating their product portfolios to cater to evolving consumer preferences, focusing on product diversification and market penetration. Regions like North America and Europe currently dominate the market, driven by established health consciousness and advanced retail infrastructure. However, the Asia Pacific region presents substantial growth opportunities due to its rapidly expanding middle class and increasing adoption of Western dietary habits, alongside a growing emphasis on health and fitness. While the market is experiencing robust growth, potential restraints such as intense competition, price sensitivity in certain consumer segments, and evolving regulatory landscapes related to health claims and ingredient labeling, necessitate strategic adaptation from market participants.
Nutrition Bar Industry Company Market Share
Unlocking the Future: Nutrition Bar Industry Market Analysis Report (2019-2033)
This comprehensive nutrition bar market report provides an in-depth analysis of the global energy bar industry, protein bar market, and healthy snack bar trends. Dive deep into market dynamics, organic nutrition bars, convenience store snacks, and online retail nutrition bars. This report is essential for food manufacturers, snack companies, ingredient suppliers, distributors, and investors seeking to capitalize on the booming nutrition bar sector. With a study period spanning 2019-2033, a base year of 2025, and a forecast period of 2025-2033, gain actionable insights into market size, growth drivers, challenges, and emerging opportunities. Discover the strategies of leading players like The Kellogg Company, Mondelēz International (Clif Bar & Company), General Mills Inc., Mars Incorporated (Kind LLC), and Nestlé S.A.
Nutrition Bar Industry Market Concentration & Dynamics
The nutrition bar industry exhibits a moderate to high level of market concentration, with a few multinational corporations holding significant market share. However, the growing demand for specialized and niche products fosters a vibrant innovation ecosystem. Key players are actively investing in research and development to introduce novel formulations, catering to diverse dietary needs like plant-based nutrition bars and gluten-free energy bars. Regulatory frameworks, while ensuring consumer safety and product standards, also present an area for strategic navigation. The threat of substitute products, ranging from fresh fruits to other convenient snack options, is mitigated by the unique value proposition of nutrition bars in providing targeted macronutrient profiles and sustained energy release. End-user trends are increasingly driven by health consciousness, convenience, and the desire for functional benefits, fueling the growth of performance-oriented and organic nutrition bars. Merger and acquisition (M&A) activities are notable, exemplified by Mondelez International's acquisition of Clif Bar & Company for over USD 1 billion, highlighting strategic consolidation and market expansion efforts. M&A deal counts in this sector are projected to remain robust as companies seek to broaden their product portfolios and geographic reach.
Nutrition Bar Industry Industry Insights & Trends
The global nutrition bar market size is projected to reach an impressive USD 10.5 billion by 2025, with a projected Compound Annual Growth Rate (CAGR) of 6.8% during the forecast period of 2025-2033. This robust growth is primarily propelled by escalating health and wellness awareness among consumers worldwide. The demand for convenient, on-the-go healthy snack bars continues to surge, driven by increasingly busy lifestyles and a growing preference for functional foods that offer specific nutritional benefits, such as increased protein content or sustained energy release. Technological advancements in food processing and ingredient innovation are enabling manufacturers to develop more appealing and diverse product offerings. This includes the incorporation of novel ingredients like adaptogens, probiotics, and alternative protein sources, catering to evolving consumer palates and dietary preferences. Evolving consumer behaviors are marked by a discerning approach to ingredient sourcing, with a significant preference for organic nutrition bars, non-GMO certified products, and transparent labeling. Furthermore, the rise of e-commerce platforms has democratized access to a wider range of specialty nutrition bars, allowing smaller brands to reach a global audience and challenging traditional distribution models. The performance nutrition bar segment, in particular, is experiencing accelerated growth as fitness and athletic pursuits become more mainstream.
Key Markets & Segments Leading Nutrition Bar Industry
The Supermarkets/Hypermarkets distribution channel currently dominates the nutrition bar industry, accounting for approximately 45% of the global market share. This dominance is attributed to their extensive reach, high foot traffic, and the ability to offer a wide variety of brands and product types, from organic energy bars to conventional protein bars. Economic growth and the increasing penetration of modern retail infrastructure in emerging economies further bolster this segment's leadership.
- Supermarkets/Hypermarkets:
- Drivers: Wide product assortment, competitive pricing, strategic shelf placement, consumer shopping habits, promotional activities.
- Dominance Analysis: These outlets provide consumers with a one-stop shop for their grocery needs, making it convenient to purchase nutrition bars alongside other food items. The ability of supermarkets to negotiate bulk purchases also allows for more competitive pricing, attracting a broad consumer base.
The Online Retail Stores segment is experiencing the fastest growth, with an estimated CAGR of 9.5%. This surge is fueled by increasing internet penetration, the convenience of home delivery, and the ability for consumers to discover and purchase niche and specialized healthy snack bars that may not be readily available in physical stores.
- Online Retail Stores:
- Drivers: Convenience, accessibility, wider product selection, personalized recommendations, subscription models, competitive online pricing.
- Dominance Analysis: The digital landscape allows consumers to easily compare products, read reviews, and access a global marketplace of nutrition bars. This segment is particularly appealing to younger demographics and those seeking specialized dietary options.
Convenience Stores represent a significant segment, catering to impulse purchases and immediate consumption needs, holding an estimated 20% market share.
- Convenience Stores:
- Drivers: Impulse purchase behavior, on-the-go consumption, strategic location in high-traffic areas, quick accessibility.
- Dominance Analysis: Convenience stores serve as a crucial touchpoint for consumers seeking a quick energy boost or a post-workout snack. Their widespread presence in urban and suburban areas ensures consistent demand.
The Organic segment within the 'Type' classification is also a key growth driver, with a projected market share of 30% by 2025, driven by increasing consumer demand for natural and sustainably sourced ingredients.
Nutrition Bar Industry Product Developments
Product innovation in the nutrition bar industry is characterized by a strong emphasis on functionality and health-conscious formulations. Companies are actively developing bars with enhanced protein content (up to 20g per bar), reduced sugar, and the inclusion of superfoods and functional ingredients like probiotics and adaptogens. Technological advancements in ingredient processing allow for improved taste and texture profiles, making these bars more appealing to a wider consumer base. Market relevance is driven by targeted product lines addressing specific needs, such as performance nutrition, weight management, and digestive health, creating competitive edges through specialization.
Challenges in the Nutrition Bar Industry Market
The nutrition bar industry faces several challenges that can impede growth. Regulatory hurdles related to health claims and ingredient labeling can be complex and vary by region. Supply chain disruptions, particularly for specialized or imported ingredients, can impact production costs and availability. Intense competitive pressures from both established brands and emerging startups necessitate continuous innovation and effective marketing strategies to maintain market share. Furthermore, fluctuating raw material costs can affect profit margins, requiring agile sourcing and pricing strategies.
Forces Driving Nutrition Bar Industry Growth
Several forces are propelling the growth of the nutrition bar industry. The escalating global health and wellness trend is a primary driver, with consumers actively seeking convenient ways to meet their nutritional needs. Technological advancements in food science enable the development of bars with enhanced functionality, catering to specific dietary requirements and performance goals. Economic factors, including rising disposable incomes in emerging markets, contribute to increased consumer spending on premium and health-conscious food products. Furthermore, supportive regulatory environments that encourage the development of functional foods can also stimulate market expansion.
Challenges in the Nutrition Bar Industry Market
Long-term growth catalysts for the nutrition bar industry lie in continuous innovation and strategic market expansion. Developing novel product formats and flavors that cater to evolving consumer preferences, such as savory nutrition bars or bars with extended shelf life, will be crucial. Strategic partnerships with fitness centers, healthcare providers, and corporate wellness programs can unlock new distribution channels and customer segments. Geographic expansion into underserved markets with growing health consciousness also presents significant opportunities for sustained growth and increased market penetration.
Emerging Opportunities in Nutrition Bar Industry
Emerging opportunities in the nutrition bar industry are abundant. The growing demand for plant-based and vegan nutrition bars presents a substantial market segment ripe for innovation. The increasing popularity of personalized nutrition and the integration of wearable technology to track dietary needs create opportunities for customized nutrition bar solutions. Furthermore, the development of bars with specific functional benefits, such as cognitive enhancement or stress reduction, leveraging ingredients like nootropics and adaptogens, holds significant promise. The expansion of direct-to-consumer (DTC) models and subscription services offers a direct engagement channel with health-conscious consumers.
Leading Players in the Nutrition Bar Industry Sector
- The Kellogg Company
- Lotus Bakeries Corporate
- General Mills Inc.
- Mondelēz International Inc (Clif Bar & Company)
- OTE Sports Ltd
- Post Holdings Inc
- Mars Incorporated (Kind LLC)
- PepsiCo Inc
- Wholesome Habits Private Limited (EAT Anytime)
- ProBar LLC
- Nestlé S A
Key Milestones in Nutrition Bar Industry Industry
- August 2022: Mondelez International, Inc. acquired Clif Bar & Company, significantly boosting its global snack bar business to over USD 1 billion, integrating brands like CLIF, CLIF Kid, and LUNA.
- August 2021: General Mills, Inc. launched Performance Protein bars under its Cinnamon Toast Crunch and Golden Grahams brands, featuring reduced sugar and up to 20g of protein.
- April 2021: Kellogg India launched K Energy bars, targeting the 'in-between meal' segment and entering a new product category.
Strategic Outlook for Nutrition Bar Industry Market
The strategic outlook for the nutrition bar industry is overwhelmingly positive, driven by sustained consumer demand for convenient, healthy, and functional food options. Growth accelerators include continued innovation in ingredient technology, the expansion of organic and plant-based product lines, and the increasing penetration of online retail channels. Companies that focus on transparent sourcing, personalized nutrition solutions, and targeted marketing efforts towards health-conscious demographics are well-positioned for long-term success. Strategic collaborations and potential further M&A activities will continue to shape the market landscape, creating opportunities for both established players and agile disruptors to capture market share and drive future growth in this dynamic sector.
Nutrition Bar Industry Segmentation
-
1. Type
- 1.1. Organic
- 1.2. Conventional
-
2. Distribution Channel
- 2.1. Supermarkets/Hypermarkets
- 2.2. Convenience Stores
- 2.3. Specialty Stores
- 2.4. Online Retail Stores
- 2.5. Other Distribution Channels
Nutrition Bar Industry Segmentation By Geography
-
1. North America
- 1.1. United States
- 1.2. Canada
- 1.3. Mexico
- 1.4. Rest of North America
-
2. Europe
- 2.1. United Kingdom
- 2.2. Germany
- 2.3. Spain
- 2.4. France
- 2.5. Italy
- 2.6. Russia
- 2.7. Rest of Europe
-
3. Asia Pacific
- 3.1. China
- 3.2. Japan
- 3.3. India
- 3.4. Australia
- 3.5. Rest of Asia Pacific
-
4. South America
- 4.1. Brazil
- 4.2. Argentina
- 4.3. Rest of South America
-
5. Middle East and Africa
- 5.1. Saudi Arabia
- 5.2. South Africa
- 5.3. Rest Middle East and Africa
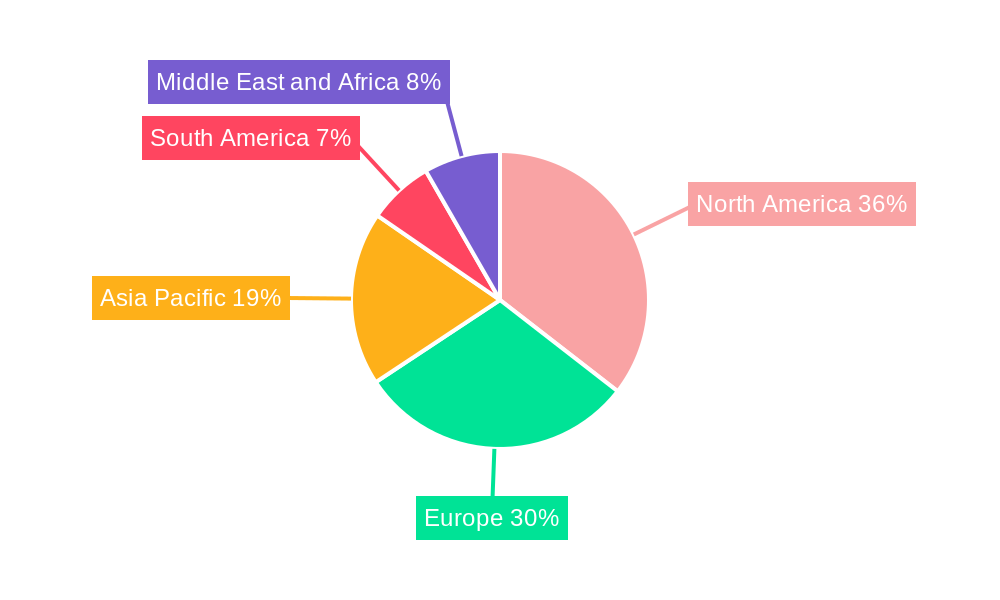
Nutrition Bar Industry Regional Market Share
Geographic Coverage of Nutrition Bar Industry
Nutrition Bar Industry REPORT HIGHLIGHTS
| Aspects | Details |
|---|---|
| Study Period | 2020-2034 |
| Base Year | 2025 |
| Estimated Year | 2026 |
| Forecast Period | 2026-2034 |
| Historical Period | 2020-2025 |
| Growth Rate | CAGR of 3.32% from 2020-2034 |
| Segmentation |
|
Table of Contents
- 1. Introduction
- 1.1. Research Scope
- 1.2. Market Segmentation
- 1.3. Research Methodology
- 1.4. Definitions and Assumptions
- 2. Executive Summary
- 2.1. Introduction
- 3. Market Dynamics
- 3.1. Introduction
- 3.2. Market Drivers
- 3.3. Market Restrains
- 3.4. Market Trends
- 3.4.1. Rising Demand for Healthy On-the-go Snacking
- 4. Market Factor Analysis
- 4.1. Porters Five Forces
- 4.2. Supply/Value Chain
- 4.3. PESTEL analysis
- 4.4. Market Entropy
- 4.5. Patent/Trademark Analysis
- 5. Global Nutrition Bar Industry Analysis, Insights and Forecast, 2020-2032
- 5.1. Market Analysis, Insights and Forecast - by Type
- 5.1.1. Organic
- 5.1.2. Conventional
- 5.2. Market Analysis, Insights and Forecast - by Distribution Channel
- 5.2.1. Supermarkets/Hypermarkets
- 5.2.2. Convenience Stores
- 5.2.3. Specialty Stores
- 5.2.4. Online Retail Stores
- 5.2.5. Other Distribution Channels
- 5.3. Market Analysis, Insights and Forecast - by Region
- 5.3.1. North America
- 5.3.2. Europe
- 5.3.3. Asia Pacific
- 5.3.4. South America
- 5.3.5. Middle East and Africa
- 5.1. Market Analysis, Insights and Forecast - by Type
- 6. North America Nutrition Bar Industry Analysis, Insights and Forecast, 2020-2032
- 6.1. Market Analysis, Insights and Forecast - by Type
- 6.1.1. Organic
- 6.1.2. Conventional
- 6.2. Market Analysis, Insights and Forecast - by Distribution Channel
- 6.2.1. Supermarkets/Hypermarkets
- 6.2.2. Convenience Stores
- 6.2.3. Specialty Stores
- 6.2.4. Online Retail Stores
- 6.2.5. Other Distribution Channels
- 6.1. Market Analysis, Insights and Forecast - by Type
- 7. Europe Nutrition Bar Industry Analysis, Insights and Forecast, 2020-2032
- 7.1. Market Analysis, Insights and Forecast - by Type
- 7.1.1. Organic
- 7.1.2. Conventional
- 7.2. Market Analysis, Insights and Forecast - by Distribution Channel
- 7.2.1. Supermarkets/Hypermarkets
- 7.2.2. Convenience Stores
- 7.2.3. Specialty Stores
- 7.2.4. Online Retail Stores
- 7.2.5. Other Distribution Channels
- 7.1. Market Analysis, Insights and Forecast - by Type
- 8. Asia Pacific Nutrition Bar Industry Analysis, Insights and Forecast, 2020-2032
- 8.1. Market Analysis, Insights and Forecast - by Type
- 8.1.1. Organic
- 8.1.2. Conventional
- 8.2. Market Analysis, Insights and Forecast - by Distribution Channel
- 8.2.1. Supermarkets/Hypermarkets
- 8.2.2. Convenience Stores
- 8.2.3. Specialty Stores
- 8.2.4. Online Retail Stores
- 8.2.5. Other Distribution Channels
- 8.1. Market Analysis, Insights and Forecast - by Type
- 9. South America Nutrition Bar Industry Analysis, Insights and Forecast, 2020-2032
- 9.1. Market Analysis, Insights and Forecast - by Type
- 9.1.1. Organic
- 9.1.2. Conventional
- 9.2. Market Analysis, Insights and Forecast - by Distribution Channel
- 9.2.1. Supermarkets/Hypermarkets
- 9.2.2. Convenience Stores
- 9.2.3. Specialty Stores
- 9.2.4. Online Retail Stores
- 9.2.5. Other Distribution Channels
- 9.1. Market Analysis, Insights and Forecast - by Type
- 10. Middle East and Africa Nutrition Bar Industry Analysis, Insights and Forecast, 2020-2032
- 10.1. Market Analysis, Insights and Forecast - by Type
- 10.1.1. Organic
- 10.1.2. Conventional
- 10.2. Market Analysis, Insights and Forecast - by Distribution Channel
- 10.2.1. Supermarkets/Hypermarkets
- 10.2.2. Convenience Stores
- 10.2.3. Specialty Stores
- 10.2.4. Online Retail Stores
- 10.2.5. Other Distribution Channels
- 10.1. Market Analysis, Insights and Forecast - by Type
- 11. Competitive Analysis
- 11.1. Global Market Share Analysis 2025
- 11.2. Company Profiles
- 11.2.1 The Kellogg Company
- 11.2.1.1. Overview
- 11.2.1.2. Products
- 11.2.1.3. SWOT Analysis
- 11.2.1.4. Recent Developments
- 11.2.1.5. Financials (Based on Availability)
- 11.2.2 Lotus Bakeries Corporate
- 11.2.2.1. Overview
- 11.2.2.2. Products
- 11.2.2.3. SWOT Analysis
- 11.2.2.4. Recent Developments
- 11.2.2.5. Financials (Based on Availability)
- 11.2.3 General Mills Inc
- 11.2.3.1. Overview
- 11.2.3.2. Products
- 11.2.3.3. SWOT Analysis
- 11.2.3.4. Recent Developments
- 11.2.3.5. Financials (Based on Availability)
- 11.2.4 Mondelēz International Inc (Clif Bar & Company)
- 11.2.4.1. Overview
- 11.2.4.2. Products
- 11.2.4.3. SWOT Analysis
- 11.2.4.4. Recent Developments
- 11.2.4.5. Financials (Based on Availability)
- 11.2.5 OTE Sports Ltd
- 11.2.5.1. Overview
- 11.2.5.2. Products
- 11.2.5.3. SWOT Analysis
- 11.2.5.4. Recent Developments
- 11.2.5.5. Financials (Based on Availability)
- 11.2.6 Post Holdings Inc
- 11.2.6.1. Overview
- 11.2.6.2. Products
- 11.2.6.3. SWOT Analysis
- 11.2.6.4. Recent Developments
- 11.2.6.5. Financials (Based on Availability)
- 11.2.7 Mars Incorporated (Kind LLC)
- 11.2.7.1. Overview
- 11.2.7.2. Products
- 11.2.7.3. SWOT Analysis
- 11.2.7.4. Recent Developments
- 11.2.7.5. Financials (Based on Availability)
- 11.2.8 PepsiCo Inc
- 11.2.8.1. Overview
- 11.2.8.2. Products
- 11.2.8.3. SWOT Analysis
- 11.2.8.4. Recent Developments
- 11.2.8.5. Financials (Based on Availability)
- 11.2.9 Wholesome Habits Private Limited (EAT Anytime)
- 11.2.9.1. Overview
- 11.2.9.2. Products
- 11.2.9.3. SWOT Analysis
- 11.2.9.4. Recent Developments
- 11.2.9.5. Financials (Based on Availability)
- 11.2.10 ProBar LLC
- 11.2.10.1. Overview
- 11.2.10.2. Products
- 11.2.10.3. SWOT Analysis
- 11.2.10.4. Recent Developments
- 11.2.10.5. Financials (Based on Availability)
- 11.2.11 Nestlé S A *List Not Exhaustive
- 11.2.11.1. Overview
- 11.2.11.2. Products
- 11.2.11.3. SWOT Analysis
- 11.2.11.4. Recent Developments
- 11.2.11.5. Financials (Based on Availability)
- 11.2.1 The Kellogg Company
List of Figures
- Figure 1: Global Nutrition Bar Industry Revenue Breakdown (Million, %) by Region 2025 & 2033
- Figure 2: Global Nutrition Bar Industry Volume Breakdown (Billion, %) by Region 2025 & 2033
- Figure 3: North America Nutrition Bar Industry Revenue (Million), by Type 2025 & 2033
- Figure 4: North America Nutrition Bar Industry Volume (Billion), by Type 2025 & 2033
- Figure 5: North America Nutrition Bar Industry Revenue Share (%), by Type 2025 & 2033
- Figure 6: North America Nutrition Bar Industry Volume Share (%), by Type 2025 & 2033
- Figure 7: North America Nutrition Bar Industry Revenue (Million), by Distribution Channel 2025 & 2033
- Figure 8: North America Nutrition Bar Industry Volume (Billion), by Distribution Channel 2025 & 2033
- Figure 9: North America Nutrition Bar Industry Revenue Share (%), by Distribution Channel 2025 & 2033
- Figure 10: North America Nutrition Bar Industry Volume Share (%), by Distribution Channel 2025 & 2033
- Figure 11: North America Nutrition Bar Industry Revenue (Million), by Country 2025 & 2033
- Figure 12: North America Nutrition Bar Industry Volume (Billion), by Country 2025 & 2033
- Figure 13: North America Nutrition Bar Industry Revenue Share (%), by Country 2025 & 2033
- Figure 14: North America Nutrition Bar Industry Volume Share (%), by Country 2025 & 2033
- Figure 15: Europe Nutrition Bar Industry Revenue (Million), by Type 2025 & 2033
- Figure 16: Europe Nutrition Bar Industry Volume (Billion), by Type 2025 & 2033
- Figure 17: Europe Nutrition Bar Industry Revenue Share (%), by Type 2025 & 2033
- Figure 18: Europe Nutrition Bar Industry Volume Share (%), by Type 2025 & 2033
- Figure 19: Europe Nutrition Bar Industry Revenue (Million), by Distribution Channel 2025 & 2033
- Figure 20: Europe Nutrition Bar Industry Volume (Billion), by Distribution Channel 2025 & 2033
- Figure 21: Europe Nutrition Bar Industry Revenue Share (%), by Distribution Channel 2025 & 2033
- Figure 22: Europe Nutrition Bar Industry Volume Share (%), by Distribution Channel 2025 & 2033
- Figure 23: Europe Nutrition Bar Industry Revenue (Million), by Country 2025 & 2033
- Figure 24: Europe Nutrition Bar Industry Volume (Billion), by Country 2025 & 2033
- Figure 25: Europe Nutrition Bar Industry Revenue Share (%), by Country 2025 & 2033
- Figure 26: Europe Nutrition Bar Industry Volume Share (%), by Country 2025 & 2033
- Figure 27: Asia Pacific Nutrition Bar Industry Revenue (Million), by Type 2025 & 2033
- Figure 28: Asia Pacific Nutrition Bar Industry Volume (Billion), by Type 2025 & 2033
- Figure 29: Asia Pacific Nutrition Bar Industry Revenue Share (%), by Type 2025 & 2033
- Figure 30: Asia Pacific Nutrition Bar Industry Volume Share (%), by Type 2025 & 2033
- Figure 31: Asia Pacific Nutrition Bar Industry Revenue (Million), by Distribution Channel 2025 & 2033
- Figure 32: Asia Pacific Nutrition Bar Industry Volume (Billion), by Distribution Channel 2025 & 2033
- Figure 33: Asia Pacific Nutrition Bar Industry Revenue Share (%), by Distribution Channel 2025 & 2033
- Figure 34: Asia Pacific Nutrition Bar Industry Volume Share (%), by Distribution Channel 2025 & 2033
- Figure 35: Asia Pacific Nutrition Bar Industry Revenue (Million), by Country 2025 & 2033
- Figure 36: Asia Pacific Nutrition Bar Industry Volume (Billion), by Country 2025 & 2033
- Figure 37: Asia Pacific Nutrition Bar Industry Revenue Share (%), by Country 2025 & 2033
- Figure 38: Asia Pacific Nutrition Bar Industry Volume Share (%), by Country 2025 & 2033
- Figure 39: South America Nutrition Bar Industry Revenue (Million), by Type 2025 & 2033
- Figure 40: South America Nutrition Bar Industry Volume (Billion), by Type 2025 & 2033
- Figure 41: South America Nutrition Bar Industry Revenue Share (%), by Type 2025 & 2033
- Figure 42: South America Nutrition Bar Industry Volume Share (%), by Type 2025 & 2033
- Figure 43: South America Nutrition Bar Industry Revenue (Million), by Distribution Channel 2025 & 2033
- Figure 44: South America Nutrition Bar Industry Volume (Billion), by Distribution Channel 2025 & 2033
- Figure 45: South America Nutrition Bar Industry Revenue Share (%), by Distribution Channel 2025 & 2033
- Figure 46: South America Nutrition Bar Industry Volume Share (%), by Distribution Channel 2025 & 2033
- Figure 47: South America Nutrition Bar Industry Revenue (Million), by Country 2025 & 2033
- Figure 48: South America Nutrition Bar Industry Volume (Billion), by Country 2025 & 2033
- Figure 49: South America Nutrition Bar Industry Revenue Share (%), by Country 2025 & 2033
- Figure 50: South America Nutrition Bar Industry Volume Share (%), by Country 2025 & 2033
- Figure 51: Middle East and Africa Nutrition Bar Industry Revenue (Million), by Type 2025 & 2033
- Figure 52: Middle East and Africa Nutrition Bar Industry Volume (Billion), by Type 2025 & 2033
- Figure 53: Middle East and Africa Nutrition Bar Industry Revenue Share (%), by Type 2025 & 2033
- Figure 54: Middle East and Africa Nutrition Bar Industry Volume Share (%), by Type 2025 & 2033
- Figure 55: Middle East and Africa Nutrition Bar Industry Revenue (Million), by Distribution Channel 2025 & 2033
- Figure 56: Middle East and Africa Nutrition Bar Industry Volume (Billion), by Distribution Channel 2025 & 2033
- Figure 57: Middle East and Africa Nutrition Bar Industry Revenue Share (%), by Distribution Channel 2025 & 2033
- Figure 58: Middle East and Africa Nutrition Bar Industry Volume Share (%), by Distribution Channel 2025 & 2033
- Figure 59: Middle East and Africa Nutrition Bar Industry Revenue (Million), by Country 2025 & 2033
- Figure 60: Middle East and Africa Nutrition Bar Industry Volume (Billion), by Country 2025 & 2033
- Figure 61: Middle East and Africa Nutrition Bar Industry Revenue Share (%), by Country 2025 & 2033
- Figure 62: Middle East and Africa Nutrition Bar Industry Volume Share (%), by Country 2025 & 2033
List of Tables
- Table 1: Global Nutrition Bar Industry Revenue Million Forecast, by Type 2020 & 2033
- Table 2: Global Nutrition Bar Industry Volume Billion Forecast, by Type 2020 & 2033
- Table 3: Global Nutrition Bar Industry Revenue Million Forecast, by Distribution Channel 2020 & 2033
- Table 4: Global Nutrition Bar Industry Volume Billion Forecast, by Distribution Channel 2020 & 2033
- Table 5: Global Nutrition Bar Industry Revenue Million Forecast, by Region 2020 & 2033
- Table 6: Global Nutrition Bar Industry Volume Billion Forecast, by Region 2020 & 2033
- Table 7: Global Nutrition Bar Industry Revenue Million Forecast, by Type 2020 & 2033
- Table 8: Global Nutrition Bar Industry Volume Billion Forecast, by Type 2020 & 2033
- Table 9: Global Nutrition Bar Industry Revenue Million Forecast, by Distribution Channel 2020 & 2033
- Table 10: Global Nutrition Bar Industry Volume Billion Forecast, by Distribution Channel 2020 & 2033
- Table 11: Global Nutrition Bar Industry Revenue Million Forecast, by Country 2020 & 2033
- Table 12: Global Nutrition Bar Industry Volume Billion Forecast, by Country 2020 & 2033
- Table 13: United States Nutrition Bar Industry Revenue (Million) Forecast, by Application 2020 & 2033
- Table 14: United States Nutrition Bar Industry Volume (Billion) Forecast, by Application 2020 & 2033
- Table 15: Canada Nutrition Bar Industry Revenue (Million) Forecast, by Application 2020 & 2033
- Table 16: Canada Nutrition Bar Industry Volume (Billion) Forecast, by Application 2020 & 2033
- Table 17: Mexico Nutrition Bar Industry Revenue (Million) Forecast, by Application 2020 & 2033
- Table 18: Mexico Nutrition Bar Industry Volume (Billion) Forecast, by Application 2020 & 2033
- Table 19: Rest of North America Nutrition Bar Industry Revenue (Million) Forecast, by Application 2020 & 2033
- Table 20: Rest of North America Nutrition Bar Industry Volume (Billion) Forecast, by Application 2020 & 2033
- Table 21: Global Nutrition Bar Industry Revenue Million Forecast, by Type 2020 & 2033
- Table 22: Global Nutrition Bar Industry Volume Billion Forecast, by Type 2020 & 2033
- Table 23: Global Nutrition Bar Industry Revenue Million Forecast, by Distribution Channel 2020 & 2033
- Table 24: Global Nutrition Bar Industry Volume Billion Forecast, by Distribution Channel 2020 & 2033
- Table 25: Global Nutrition Bar Industry Revenue Million Forecast, by Country 2020 & 2033
- Table 26: Global Nutrition Bar Industry Volume Billion Forecast, by Country 2020 & 2033
- Table 27: United Kingdom Nutrition Bar Industry Revenue (Million) Forecast, by Application 2020 & 2033
- Table 28: United Kingdom Nutrition Bar Industry Volume (Billion) Forecast, by Application 2020 & 2033
- Table 29: Germany Nutrition Bar Industry Revenue (Million) Forecast, by Application 2020 & 2033
- Table 30: Germany Nutrition Bar Industry Volume (Billion) Forecast, by Application 2020 & 2033
- Table 31: Spain Nutrition Bar Industry Revenue (Million) Forecast, by Application 2020 & 2033
- Table 32: Spain Nutrition Bar Industry Volume (Billion) Forecast, by Application 2020 & 2033
- Table 33: France Nutrition Bar Industry Revenue (Million) Forecast, by Application 2020 & 2033
- Table 34: France Nutrition Bar Industry Volume (Billion) Forecast, by Application 2020 & 2033
- Table 35: Italy Nutrition Bar Industry Revenue (Million) Forecast, by Application 2020 & 2033
- Table 36: Italy Nutrition Bar Industry Volume (Billion) Forecast, by Application 2020 & 2033
- Table 37: Russia Nutrition Bar Industry Revenue (Million) Forecast, by Application 2020 & 2033
- Table 38: Russia Nutrition Bar Industry Volume (Billion) Forecast, by Application 2020 & 2033
- Table 39: Rest of Europe Nutrition Bar Industry Revenue (Million) Forecast, by Application 2020 & 2033
- Table 40: Rest of Europe Nutrition Bar Industry Volume (Billion) Forecast, by Application 2020 & 2033
- Table 41: Global Nutrition Bar Industry Revenue Million Forecast, by Type 2020 & 2033
- Table 42: Global Nutrition Bar Industry Volume Billion Forecast, by Type 2020 & 2033
- Table 43: Global Nutrition Bar Industry Revenue Million Forecast, by Distribution Channel 2020 & 2033
- Table 44: Global Nutrition Bar Industry Volume Billion Forecast, by Distribution Channel 2020 & 2033
- Table 45: Global Nutrition Bar Industry Revenue Million Forecast, by Country 2020 & 2033
- Table 46: Global Nutrition Bar Industry Volume Billion Forecast, by Country 2020 & 2033
- Table 47: China Nutrition Bar Industry Revenue (Million) Forecast, by Application 2020 & 2033
- Table 48: China Nutrition Bar Industry Volume (Billion) Forecast, by Application 2020 & 2033
- Table 49: Japan Nutrition Bar Industry Revenue (Million) Forecast, by Application 2020 & 2033
- Table 50: Japan Nutrition Bar Industry Volume (Billion) Forecast, by Application 2020 & 2033
- Table 51: India Nutrition Bar Industry Revenue (Million) Forecast, by Application 2020 & 2033
- Table 52: India Nutrition Bar Industry Volume (Billion) Forecast, by Application 2020 & 2033
- Table 53: Australia Nutrition Bar Industry Revenue (Million) Forecast, by Application 2020 & 2033
- Table 54: Australia Nutrition Bar Industry Volume (Billion) Forecast, by Application 2020 & 2033
- Table 55: Rest of Asia Pacific Nutrition Bar Industry Revenue (Million) Forecast, by Application 2020 & 2033
- Table 56: Rest of Asia Pacific Nutrition Bar Industry Volume (Billion) Forecast, by Application 2020 & 2033
- Table 57: Global Nutrition Bar Industry Revenue Million Forecast, by Type 2020 & 2033
- Table 58: Global Nutrition Bar Industry Volume Billion Forecast, by Type 2020 & 2033
- Table 59: Global Nutrition Bar Industry Revenue Million Forecast, by Distribution Channel 2020 & 2033
- Table 60: Global Nutrition Bar Industry Volume Billion Forecast, by Distribution Channel 2020 & 2033
- Table 61: Global Nutrition Bar Industry Revenue Million Forecast, by Country 2020 & 2033
- Table 62: Global Nutrition Bar Industry Volume Billion Forecast, by Country 2020 & 2033
- Table 63: Brazil Nutrition Bar Industry Revenue (Million) Forecast, by Application 2020 & 2033
- Table 64: Brazil Nutrition Bar Industry Volume (Billion) Forecast, by Application 2020 & 2033
- Table 65: Argentina Nutrition Bar Industry Revenue (Million) Forecast, by Application 2020 & 2033
- Table 66: Argentina Nutrition Bar Industry Volume (Billion) Forecast, by Application 2020 & 2033
- Table 67: Rest of South America Nutrition Bar Industry Revenue (Million) Forecast, by Application 2020 & 2033
- Table 68: Rest of South America Nutrition Bar Industry Volume (Billion) Forecast, by Application 2020 & 2033
- Table 69: Global Nutrition Bar Industry Revenue Million Forecast, by Type 2020 & 2033
- Table 70: Global Nutrition Bar Industry Volume Billion Forecast, by Type 2020 & 2033
- Table 71: Global Nutrition Bar Industry Revenue Million Forecast, by Distribution Channel 2020 & 2033
- Table 72: Global Nutrition Bar Industry Volume Billion Forecast, by Distribution Channel 2020 & 2033
- Table 73: Global Nutrition Bar Industry Revenue Million Forecast, by Country 2020 & 2033
- Table 74: Global Nutrition Bar Industry Volume Billion Forecast, by Country 2020 & 2033
- Table 75: Saudi Arabia Nutrition Bar Industry Revenue (Million) Forecast, by Application 2020 & 2033
- Table 76: Saudi Arabia Nutrition Bar Industry Volume (Billion) Forecast, by Application 2020 & 2033
- Table 77: South Africa Nutrition Bar Industry Revenue (Million) Forecast, by Application 2020 & 2033
- Table 78: South Africa Nutrition Bar Industry Volume (Billion) Forecast, by Application 2020 & 2033
- Table 79: Rest Middle East and Africa Nutrition Bar Industry Revenue (Million) Forecast, by Application 2020 & 2033
- Table 80: Rest Middle East and Africa Nutrition Bar Industry Volume (Billion) Forecast, by Application 2020 & 2033
Frequently Asked Questions
1. What is the projected Compound Annual Growth Rate (CAGR) of the Nutrition Bar Industry?
The projected CAGR is approximately 3.32%.
2. Which companies are prominent players in the Nutrition Bar Industry?
Key companies in the market include The Kellogg Company, Lotus Bakeries Corporate, General Mills Inc, Mondelēz International Inc (Clif Bar & Company), OTE Sports Ltd, Post Holdings Inc, Mars Incorporated (Kind LLC), PepsiCo Inc, Wholesome Habits Private Limited (EAT Anytime), ProBar LLC, Nestlé S A *List Not Exhaustive.
3. What are the main segments of the Nutrition Bar Industry?
The market segments include Type, Distribution Channel.
4. Can you provide details about the market size?
The market size is estimated to be USD 3.28 Million as of 2022.
5. What are some drivers contributing to market growth?
N/A
6. What are the notable trends driving market growth?
Rising Demand for Healthy On-the-go Snacking.
7. Are there any restraints impacting market growth?
N/A
8. Can you provide examples of recent developments in the market?
August 2022: Clif Bar & Company, which offers a range of energy bars, was acquired by Mondelez International, Inc. With leading brands like CLIF, CLIF Kid, and LUNA complementing the company's refrigerated snacking business in the United States and popular performance nutrition business Grenade in the United Kingdom, the acquisition is anticipated to increase Mondelez International's global snack bar business to more than USD 1 billion.
9. What pricing options are available for accessing the report?
Pricing options include single-user, multi-user, and enterprise licenses priced at USD 4750, USD 5250, and USD 8750 respectively.
10. Is the market size provided in terms of value or volume?
The market size is provided in terms of value, measured in Million and volume, measured in Billion.
11. Are there any specific market keywords associated with the report?
Yes, the market keyword associated with the report is "Nutrition Bar Industry," which aids in identifying and referencing the specific market segment covered.
12. How do I determine which pricing option suits my needs best?
The pricing options vary based on user requirements and access needs. Individual users may opt for single-user licenses, while businesses requiring broader access may choose multi-user or enterprise licenses for cost-effective access to the report.
13. Are there any additional resources or data provided in the Nutrition Bar Industry report?
While the report offers comprehensive insights, it's advisable to review the specific contents or supplementary materials provided to ascertain if additional resources or data are available.
14. How can I stay updated on further developments or reports in the Nutrition Bar Industry?
To stay informed about further developments, trends, and reports in the Nutrition Bar Industry, consider subscribing to industry newsletters, following relevant companies and organizations, or regularly checking reputable industry news sources and publications.
Methodology
Step 1 - Identification of Relevant Samples Size from Population Database


Step 2 - Approaches for Defining Global Market Size (Value, Volume* & Price*)

Note*: In applicable scenarios
Step 3 - Data Sources
Primary Research
- Web Analytics
- Survey Reports
- Research Institute
- Latest Research Reports
- Opinion Leaders
Secondary Research
- Annual Reports
- White Paper
- Latest Press Release
- Industry Association
- Paid Database
- Investor Presentations

Step 4 - Data Triangulation
Involves using different sources of information in order to increase the validity of a study
These sources are likely to be stakeholders in a program - participants, other researchers, program staff, other community members, and so on.
Then we put all data in single framework & apply various statistical tools to find out the dynamic on the market.
During the analysis stage, feedback from the stakeholder groups would be compared to determine areas of agreement as well as areas of divergence