
Key Insights
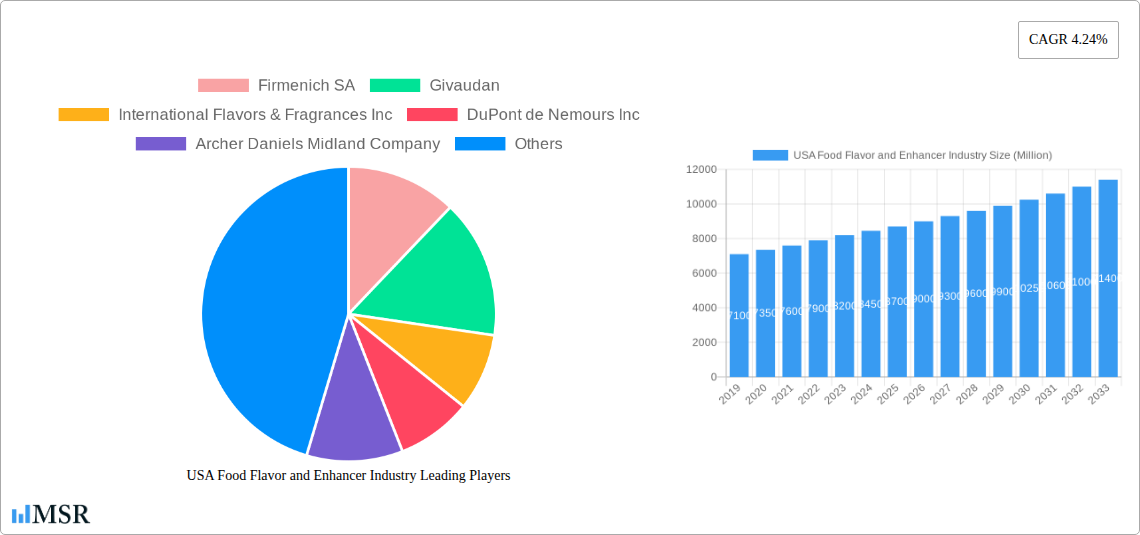
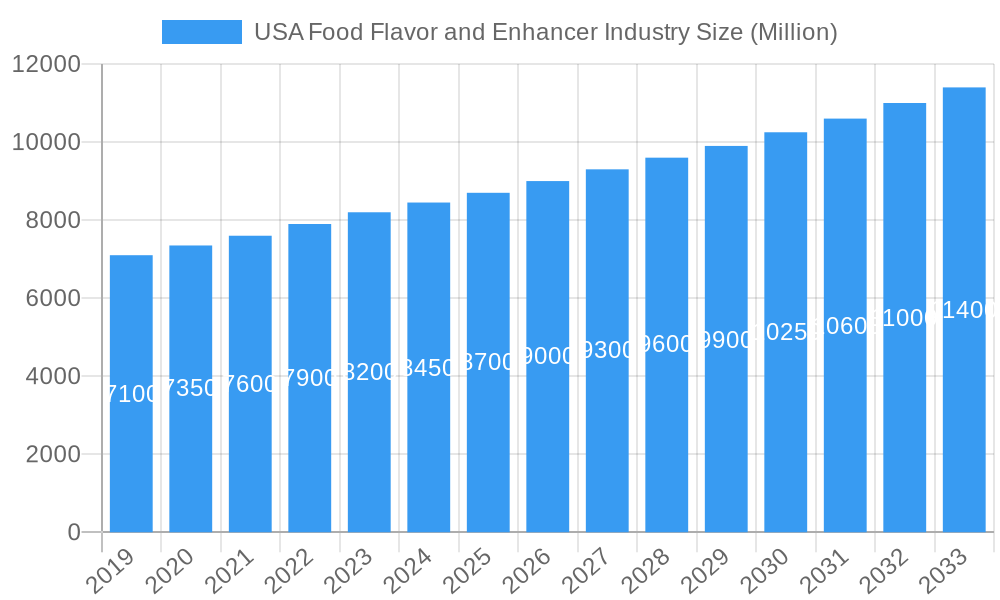
The United States Food Flavor and Enhancer Industry is poised for robust growth, driven by evolving consumer preferences and an increasing demand for innovative and sensory-rich food experiences. With an estimated market size of $8,500 Million in 2025, the industry is projected to expand at a Compound Annual Growth Rate (CAGR) of 4.24%, reaching approximately $11,500 Million by 2033. This growth is fueled by a confluence of factors, including the burgeoning clean label movement, which is pushing manufacturers towards natural and nature-identical flavorings, and the growing popularity of exotic and ethnic cuisines, demanding a wider palette of taste profiles. Furthermore, advancements in flavor technology, such as encapsulation and the development of potent flavor enhancers, are enabling the creation of products with extended shelf life and enhanced sensory appeal, further stimulating market expansion. The demand for sophisticated flavor profiles in beverages, dairy products, and bakery and confectionery items is particularly strong, reflecting a consumer base willing to explore new taste sensations.
USA Food Flavor and Enhancer Industry Market Size (In Billion)
The competitive landscape is characterized by the presence of major global players like Firmenich SA, Givaudan, and International Flavors & Fragrances Inc., alongside significant contributions from companies such as DuPont de Nemours Inc. and Archer Daniels Midland Company. These entities are actively investing in research and development to innovate new flavor compounds and enhancers, catering to the demand for healthier, more sustainable, and highly palatable food options. Key trends influencing the market include the rise of plant-based foods, requiring specialized flavor solutions to replicate traditional tastes, and a heightened consumer awareness regarding the impact of artificial ingredients, leading to a premium on natural and organic alternatives. While the industry benefits from strong consumer demand, potential restraints include volatile raw material prices, stringent regulatory frameworks, and the challenge of developing cost-effective natural flavor solutions. Nonetheless, the dynamic nature of consumer tastes and the continuous innovation in flavor science present a highly promising outlook for the U.S. food flavor and enhancer market.
USA Food Flavor and Enhancer Industry Company Market Share
This comprehensive report offers an in-depth analysis of the USA Food Flavor and Enhancer Industry, a rapidly evolving sector driven by consumer demand for taste innovation and healthier options. Covering the study period from 2019 to 2033, with a base year of 2025 and a forecast period extending to 2033, this report provides critical insights for stakeholders including manufacturers, ingredient suppliers, R&D professionals, and investors. We delve into market dynamics, emerging trends, key segments, product developments, challenges, growth drivers, and strategic opportunities shaping this significant market. The market size for the USA Food Flavor and Enhancer Industry is projected to reach $XX Million by 2025, exhibiting a Compound Annual Growth Rate (CAGR) of XX% during the forecast period.
USA Food Flavor and Enhancer Industry Market Concentration & Dynamics
The USA Food Flavor and Enhancer Industry is characterized by a moderate to high level of market concentration, with a few dominant players holding substantial market share. Key companies like Firmenich SA, Givaudan, International Flavors & Fragrances Inc., DuPont de Nemours Inc., Archer Daniels Midland Company, Koninklijke DSM N V, and FMC Corporation are at the forefront, investing heavily in research and development to fuel innovation. The innovation ecosystem is robust, with continuous advancements in natural sourcing, biotechnology, and encapsulation technologies. Regulatory frameworks, overseen by agencies like the FDA, play a crucial role in ensuring product safety and labeling accuracy, impacting product formulations and market entry strategies. Substitute products, while present, often struggle to replicate the nuanced sensory experiences offered by specialized flavors and enhancers. End-user trends strongly favor clean label, natural ingredients, and functional benefits, prompting manufacturers to adapt their portfolios. Mergers and Acquisitions (M&A) activities are a significant dynamic, with an estimated XX M&A deals observed during the historical period (2019-2024), aimed at expanding market reach, acquiring novel technologies, and consolidating market share. The market share of the top five players is estimated to be XX% in the base year 2025.
USA Food Flavor and Enhancer Industry Industry Insights & Trends
The USA Food Flavor and Enhancer Industry is experiencing robust growth, driven by several interconnected factors. A primary growth driver is the escalating consumer preference for sophisticated and diverse taste profiles across all food and beverage categories. This demand is further amplified by the rising awareness of health and wellness, leading to a surge in demand for natural flavors, reduced-sugar formulations, and enhancers that mask off-notes from alternative proteins or functional ingredients. Technological disruptions are continuously reshaping the industry, with advancements in biotechnology enabling the production of novel flavor compounds, fermentation processes yielding unique taste experiences, and AI-driven platforms assisting in flavor development and trend prediction. The market size for the USA Food Flavor and Enhancer Industry is estimated to be $XX Million in 2025, with a projected CAGR of XX% during the forecast period. Evolving consumer behaviors, such as the increasing adoption of plant-based diets, the demand for convenient meal solutions, and the influence of social media on food trends, are compelling manufacturers to innovate rapidly. The rise of personalized nutrition also presents an opportunity for customized flavor solutions. Furthermore, the demand for clean label ingredients, free from artificial additives, is a persistent trend influencing product development and sourcing strategies. The increasing disposable income in certain demographics also contributes to a greater willingness to spend on premium food products with enhanced taste. The market is also seeing a growing interest in flavors that evoke nostalgic or artisanal experiences, further diversifying product offerings. The impact of economic conditions on consumer spending power also influences the demand for both everyday and premium flavor solutions, with premium segments often demonstrating resilience.
Key Markets & Segments Leading USA Food Flavor and Enhancer Industry
The USA Food Flavor and Enhancer Industry is segmented by Type and Application, with distinct segments exhibiting varying growth trajectories and market dominance.
Dominant Segment by Type:
- Flavors: This segment is the largest, driven by continuous innovation and the broad applicability of flavors across the food and beverage landscape.
- Natural Flavor: This sub-segment is experiencing the highest growth due to strong consumer preference for clean labels and perceived health benefits. Economic growth and increased consumer spending on premium food products contribute to its expansion.
- Synthetic Flavor: While traditionally dominant, its growth is moderating as natural alternatives gain traction. However, its cost-effectiveness and wide range of achievable profiles ensure its continued relevance.
- Nature Identical Flavoring: This sub-segment offers a balance between natural perception and cost-effectiveness, making it a significant contributor to overall flavor market growth.
- Flavor Enhancers: This segment is steadily growing, fueled by the demand for intensified taste experiences and the need to balance flavors in processed foods.
- Flavors: This segment is the largest, driven by continuous innovation and the broad applicability of flavors across the food and beverage landscape.
Dominant Segment by Application:
- Dairy Products: This is a significant application area, with flavors and enhancers crucial for yogurt, cheese, ice cream, and milk-based beverages. Economic stability and a growing market for functional dairy products drive demand.
- Bakery and Confectionery: This segment consistently represents a large share of the market, with a perpetual demand for diverse and appealing flavors in baked goods, candies, and chocolates. Infrastructure supporting efficient production of these goods underpins its strength.
- Savory: This segment is experiencing rapid growth due to the increasing popularity of ready-to-eat meals, snacks, and plant-based savory options. The development of authentic and complex savory profiles is a key driver.
- Soups, Pasta and Noodles: These staple food categories benefit from a consistent demand for flavorings that provide authentic and satisfying taste profiles. Economic accessibility of these products ensures steady market penetration.
- Beverage: This broad application segment encompasses everything from carbonated soft drinks and juices to alcoholic beverages and functional drinks. Innovation in low-calorie and exotic flavor profiles is a key driver here.
- Others: This category includes a wide array of applications like pet food, pharmaceuticals, and nutritional supplements, each contributing to the overall market diversification.
The dominance of these segments is influenced by factors such as changing consumer lifestyles, urbanization, and the increasing accessibility of processed and convenience foods, all supported by robust economic growth and established supply chains.
USA Food Flavor and Enhancer Industry Product Developments
Product innovations in the USA Food Flavor and Enhancer Industry are centered on enhancing naturalness, functionality, and sensory experiences. Companies are actively developing natural flavor profiles derived from botanical extracts, fermentation, and enzyme technologies, addressing the "clean label" demand. Advances in flavor enhancers are focusing on increasing umami taste, masking bitterness from healthier ingredients like stevia, and providing sustained flavor release. Applications are expanding into emerging categories like plant-based alternatives, functional beverages, and personalized nutrition solutions. Technological advancements in encapsulation and delivery systems are crucial for maintaining flavor integrity and optimizing release. The competitive edge is increasingly found in offering unique flavor combinations, sustainable sourcing, and transparent ingredient labeling, catering to discerning consumers and evolving regulatory landscapes.
Challenges in the USA Food Flavor and Enhancer Industry Market
The USA Food Flavor and Enhancer Industry faces several challenges that impact its growth trajectory. Regulatory hurdles, including stringent labeling requirements and evolving safety standards for new ingredients, can slow down product development and market entry. Supply chain issues, such as the availability and price volatility of natural raw materials, can affect production costs and consistency, with potential price increases of up to XX% for certain natural extracts. Intense competitive pressures from both established players and emerging innovators necessitate continuous investment in R&D and marketing, potentially impacting profit margins by XX%. Consumer demand for "free-from" products, while an opportunity, also presents challenges in reformulating existing products without compromising taste and texture, leading to R&D costs potentially reaching $XX Million.
Forces Driving USA Food Flavor and Enhancer Industry Growth
Several key forces are driving the growth of the USA Food Flavor and Enhancer Industry. The relentless pursuit of novel taste experiences by consumers, coupled with a growing demand for natural and clean label ingredients, is a primary catalyst. Technological advancements in biotechnology and fermentation are enabling the creation of unique and sustainable flavor compounds, while AI is streamlining flavor development processes. The increasing popularity of plant-based diets and functional foods is opening new avenues for specialized flavor solutions. Furthermore, a favorable regulatory environment that supports innovation while ensuring safety encourages investment and market expansion. The rising disposable income in the US also fuels demand for premium and specialty food products.
Challenges in the USA Food Flavor and Enhancer Industry Market
Long-term growth catalysts in the USA Food Flavor and Enhancer Industry are deeply intertwined with innovation and strategic market positioning. The continuous development of sustainable and ethically sourced ingredients is becoming paramount, aligning with corporate social responsibility goals and consumer values. Strategic partnerships between flavor houses and food manufacturers can accelerate the adoption of new flavor technologies and ensure market relevance. Furthermore, expanding into niche markets, such as ethnic cuisines or specialized dietary needs, presents significant growth potential. The investment in advanced analytical tools for flavor profiling and sensory science is crucial for maintaining a competitive edge and understanding evolving consumer preferences.
Emerging Opportunities in USA Food Flavor and Enhancer Industry
Emerging opportunities in the USA Food Flavor and Enhancer Industry are abundant and diverse. The burgeoning plant-based food market presents a significant opportunity for developing authentic and appealing meat and dairy alternative flavors. The demand for functional beverages and nutraceuticals with enhanced taste profiles is rapidly growing. Advancements in personalized nutrition will drive the need for customized flavor solutions tailored to individual dietary requirements and preferences. The exploration of novel natural ingredients from underutilized sources and the application of precision fermentation techniques for flavor creation are also promising areas. Furthermore, the increasing focus on sustainability and traceability in the supply chain offers opportunities for brands to differentiate themselves and build consumer trust, potentially leading to a XX% market premium for sustainably sourced ingredients.
Leading Players in the USA Food Flavor and Enhancer Industry Sector
- Firmenich SA
- Givaudan
- International Flavors & Fragrances Inc.
- DuPont de Nemours Inc.
- Archer Daniels Midland Company
- Koninklijke DSM N V
- FMC Corporation
Key Milestones in USA Food Flavor and Enhancer Industry Industry
- 2019: Increased investment in natural flavor extraction technologies, driven by growing consumer demand for clean labels.
- 2020: Introduction of novel flavor enhancers designed to mask the off-notes of plant-based proteins, supporting the booming vegan market.
- 2021: Significant M&A activity as larger players sought to acquire innovative startups with proprietary flavor technologies.
- 2022: Expansion of R&D efforts into biotechnological approaches, including precision fermentation, for creating complex and sustainable flavor compounds.
- 2023: Growing focus on flavor profiles that evoke nostalgia and artisanal experiences, catering to a desire for authenticity.
- 2024: Enhanced regulatory scrutiny on the labeling of natural vs. artificial flavors, prompting greater transparency from manufacturers.
Strategic Outlook for USA Food Flavor and Enhancer Industry Market
The strategic outlook for the USA Food Flavor and Enhancer Industry is overwhelmingly positive, driven by continuous innovation and evolving consumer demands. Growth accelerators will include the further development of clean label and natural solutions, leveraging advancements in biotechnology and sustainable sourcing. The expanding plant-based and functional food sectors will continue to be a major focus, requiring specialized flavor expertise. Strategic collaborations and acquisitions will remain critical for market players to expand their technological capabilities and geographical reach. Companies that can effectively integrate digitalization and AI into their R&D processes, for trend prediction and product development, will gain a significant competitive advantage. The emphasis on transparency and traceability throughout the supply chain will also be a key differentiator, building consumer trust and brand loyalty in this dynamic market. The market is poised for sustained growth, with an estimated market size of $XX Million by 2033.
USA Food Flavor and Enhancer Industry Segmentation
-
1. Type
-
1.1. Flavors
- 1.1.1. Natural Flavor
- 1.1.2. Synthetic Flavor
- 1.1.3. Nature Identical Flavoring
- 1.2. Flavor Enhancers
-
1.1. Flavors
-
2. Application
- 2.1. Dairy Products
- 2.2. Bakery and Confectionery
- 2.3. Savory
- 2.4. Soups, Pasta and Noodles
- 2.5. Beverage
- 2.6. Others
USA Food Flavor and Enhancer Industry Segmentation By Geography
-
1. North America
- 1.1. United States
- 1.2. Canada
- 1.3. Mexico
-
2. South America
- 2.1. Brazil
- 2.2. Argentina
- 2.3. Rest of South America
-
3. Europe
- 3.1. United Kingdom
- 3.2. Germany
- 3.3. France
- 3.4. Italy
- 3.5. Spain
- 3.6. Russia
- 3.7. Benelux
- 3.8. Nordics
- 3.9. Rest of Europe
-
4. Middle East & Africa
- 4.1. Turkey
- 4.2. Israel
- 4.3. GCC
- 4.4. North Africa
- 4.5. South Africa
- 4.6. Rest of Middle East & Africa
-
5. Asia Pacific
- 5.1. China
- 5.2. India
- 5.3. Japan
- 5.4. South Korea
- 5.5. ASEAN
- 5.6. Oceania
- 5.7. Rest of Asia Pacific
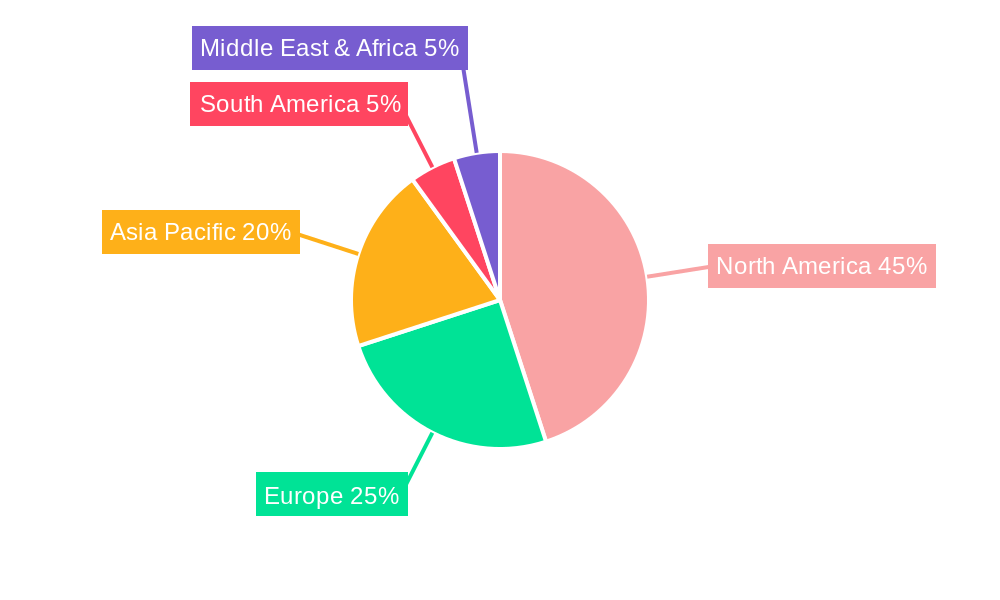
USA Food Flavor and Enhancer Industry Regional Market Share
Geographic Coverage of USA Food Flavor and Enhancer Industry
USA Food Flavor and Enhancer Industry REPORT HIGHLIGHTS
| Aspects | Details |
|---|---|
| Study Period | 2020-2034 |
| Base Year | 2025 |
| Estimated Year | 2026 |
| Forecast Period | 2026-2034 |
| Historical Period | 2020-2025 |
| Growth Rate | CAGR of 4.24% from 2020-2034 |
| Segmentation |
|
Table of Contents
- 1. Introduction
- 1.1. Research Scope
- 1.2. Market Segmentation
- 1.3. Research Methodology
- 1.4. Definitions and Assumptions
- 2. Executive Summary
- 2.1. Introduction
- 3. Market Dynamics
- 3.1. Introduction
- 3.2. Market Drivers
- 3.2.1. The Rising Awareness of the Health Benefits Associated with Collagen Consumption; Rising Sport and Fitness Trends Drives the Market Growth
- 3.3. Market Restrains
- 3.3.1. Concerns over the Source and Animal Welfare in Collagen Extraction Limit the Market Growth
- 3.4. Market Trends
- 3.4.1. Increasing Demand For Natural Food Flavors and Enhancers
- 4. Market Factor Analysis
- 4.1. Porters Five Forces
- 4.2. Supply/Value Chain
- 4.3. PESTEL analysis
- 4.4. Market Entropy
- 4.5. Patent/Trademark Analysis
- 5. Global USA Food Flavor and Enhancer Industry Analysis, Insights and Forecast, 2020-2032
- 5.1. Market Analysis, Insights and Forecast - by Type
- 5.1.1. Flavors
- 5.1.1.1. Natural Flavor
- 5.1.1.2. Synthetic Flavor
- 5.1.1.3. Nature Identical Flavoring
- 5.1.2. Flavor Enhancers
- 5.1.1. Flavors
- 5.2. Market Analysis, Insights and Forecast - by Application
- 5.2.1. Dairy Products
- 5.2.2. Bakery and Confectionery
- 5.2.3. Savory
- 5.2.4. Soups, Pasta and Noodles
- 5.2.5. Beverage
- 5.2.6. Others
- 5.3. Market Analysis, Insights and Forecast - by Region
- 5.3.1. North America
- 5.3.2. South America
- 5.3.3. Europe
- 5.3.4. Middle East & Africa
- 5.3.5. Asia Pacific
- 5.1. Market Analysis, Insights and Forecast - by Type
- 6. North America USA Food Flavor and Enhancer Industry Analysis, Insights and Forecast, 2020-2032
- 6.1. Market Analysis, Insights and Forecast - by Type
- 6.1.1. Flavors
- 6.1.1.1. Natural Flavor
- 6.1.1.2. Synthetic Flavor
- 6.1.1.3. Nature Identical Flavoring
- 6.1.2. Flavor Enhancers
- 6.1.1. Flavors
- 6.2. Market Analysis, Insights and Forecast - by Application
- 6.2.1. Dairy Products
- 6.2.2. Bakery and Confectionery
- 6.2.3. Savory
- 6.2.4. Soups, Pasta and Noodles
- 6.2.5. Beverage
- 6.2.6. Others
- 6.1. Market Analysis, Insights and Forecast - by Type
- 7. South America USA Food Flavor and Enhancer Industry Analysis, Insights and Forecast, 2020-2032
- 7.1. Market Analysis, Insights and Forecast - by Type
- 7.1.1. Flavors
- 7.1.1.1. Natural Flavor
- 7.1.1.2. Synthetic Flavor
- 7.1.1.3. Nature Identical Flavoring
- 7.1.2. Flavor Enhancers
- 7.1.1. Flavors
- 7.2. Market Analysis, Insights and Forecast - by Application
- 7.2.1. Dairy Products
- 7.2.2. Bakery and Confectionery
- 7.2.3. Savory
- 7.2.4. Soups, Pasta and Noodles
- 7.2.5. Beverage
- 7.2.6. Others
- 7.1. Market Analysis, Insights and Forecast - by Type
- 8. Europe USA Food Flavor and Enhancer Industry Analysis, Insights and Forecast, 2020-2032
- 8.1. Market Analysis, Insights and Forecast - by Type
- 8.1.1. Flavors
- 8.1.1.1. Natural Flavor
- 8.1.1.2. Synthetic Flavor
- 8.1.1.3. Nature Identical Flavoring
- 8.1.2. Flavor Enhancers
- 8.1.1. Flavors
- 8.2. Market Analysis, Insights and Forecast - by Application
- 8.2.1. Dairy Products
- 8.2.2. Bakery and Confectionery
- 8.2.3. Savory
- 8.2.4. Soups, Pasta and Noodles
- 8.2.5. Beverage
- 8.2.6. Others
- 8.1. Market Analysis, Insights and Forecast - by Type
- 9. Middle East & Africa USA Food Flavor and Enhancer Industry Analysis, Insights and Forecast, 2020-2032
- 9.1. Market Analysis, Insights and Forecast - by Type
- 9.1.1. Flavors
- 9.1.1.1. Natural Flavor
- 9.1.1.2. Synthetic Flavor
- 9.1.1.3. Nature Identical Flavoring
- 9.1.2. Flavor Enhancers
- 9.1.1. Flavors
- 9.2. Market Analysis, Insights and Forecast - by Application
- 9.2.1. Dairy Products
- 9.2.2. Bakery and Confectionery
- 9.2.3. Savory
- 9.2.4. Soups, Pasta and Noodles
- 9.2.5. Beverage
- 9.2.6. Others
- 9.1. Market Analysis, Insights and Forecast - by Type
- 10. Asia Pacific USA Food Flavor and Enhancer Industry Analysis, Insights and Forecast, 2020-2032
- 10.1. Market Analysis, Insights and Forecast - by Type
- 10.1.1. Flavors
- 10.1.1.1. Natural Flavor
- 10.1.1.2. Synthetic Flavor
- 10.1.1.3. Nature Identical Flavoring
- 10.1.2. Flavor Enhancers
- 10.1.1. Flavors
- 10.2. Market Analysis, Insights and Forecast - by Application
- 10.2.1. Dairy Products
- 10.2.2. Bakery and Confectionery
- 10.2.3. Savory
- 10.2.4. Soups, Pasta and Noodles
- 10.2.5. Beverage
- 10.2.6. Others
- 10.1. Market Analysis, Insights and Forecast - by Type
- 11. Northeast USA Food Flavor and Enhancer Industry Analysis, Insights and Forecast, 2020-2032
- 12. Southeast USA Food Flavor and Enhancer Industry Analysis, Insights and Forecast, 2020-2032
- 13. Midwest USA Food Flavor and Enhancer Industry Analysis, Insights and Forecast, 2020-2032
- 14. Southwest USA Food Flavor and Enhancer Industry Analysis, Insights and Forecast, 2020-2032
- 15. West USA Food Flavor and Enhancer Industry Analysis, Insights and Forecast, 2020-2032
- 16. Competitive Analysis
- 16.1. Global Market Share Analysis 2025
- 16.2. Company Profiles
- 16.2.1 Firmenich SA
- 16.2.1.1. Overview
- 16.2.1.2. Products
- 16.2.1.3. SWOT Analysis
- 16.2.1.4. Recent Developments
- 16.2.1.5. Financials (Based on Availability)
- 16.2.2 Givaudan
- 16.2.2.1. Overview
- 16.2.2.2. Products
- 16.2.2.3. SWOT Analysis
- 16.2.2.4. Recent Developments
- 16.2.2.5. Financials (Based on Availability)
- 16.2.3 International Flavors & Fragrances Inc
- 16.2.3.1. Overview
- 16.2.3.2. Products
- 16.2.3.3. SWOT Analysis
- 16.2.3.4. Recent Developments
- 16.2.3.5. Financials (Based on Availability)
- 16.2.4 DuPont de Nemours Inc
- 16.2.4.1. Overview
- 16.2.4.2. Products
- 16.2.4.3. SWOT Analysis
- 16.2.4.4. Recent Developments
- 16.2.4.5. Financials (Based on Availability)
- 16.2.5 Archer Daniels Midland Company
- 16.2.5.1. Overview
- 16.2.5.2. Products
- 16.2.5.3. SWOT Analysis
- 16.2.5.4. Recent Developments
- 16.2.5.5. Financials (Based on Availability)
- 16.2.6 Koninklijke DSM N V
- 16.2.6.1. Overview
- 16.2.6.2. Products
- 16.2.6.3. SWOT Analysis
- 16.2.6.4. Recent Developments
- 16.2.6.5. Financials (Based on Availability)
- 16.2.7 FMC Corporation*List Not Exhaustive
- 16.2.7.1. Overview
- 16.2.7.2. Products
- 16.2.7.3. SWOT Analysis
- 16.2.7.4. Recent Developments
- 16.2.7.5. Financials (Based on Availability)
- 16.2.1 Firmenich SA
List of Figures
- Figure 1: Global USA Food Flavor and Enhancer Industry Revenue Breakdown (Million, %) by Region 2025 & 2033
- Figure 2: United states USA Food Flavor and Enhancer Industry Revenue (Million), by Country 2025 & 2033
- Figure 3: United states USA Food Flavor and Enhancer Industry Revenue Share (%), by Country 2025 & 2033
- Figure 4: North America USA Food Flavor and Enhancer Industry Revenue (Million), by Type 2025 & 2033
- Figure 5: North America USA Food Flavor and Enhancer Industry Revenue Share (%), by Type 2025 & 2033
- Figure 6: North America USA Food Flavor and Enhancer Industry Revenue (Million), by Application 2025 & 2033
- Figure 7: North America USA Food Flavor and Enhancer Industry Revenue Share (%), by Application 2025 & 2033
- Figure 8: North America USA Food Flavor and Enhancer Industry Revenue (Million), by Country 2025 & 2033
- Figure 9: North America USA Food Flavor and Enhancer Industry Revenue Share (%), by Country 2025 & 2033
- Figure 10: South America USA Food Flavor and Enhancer Industry Revenue (Million), by Type 2025 & 2033
- Figure 11: South America USA Food Flavor and Enhancer Industry Revenue Share (%), by Type 2025 & 2033
- Figure 12: South America USA Food Flavor and Enhancer Industry Revenue (Million), by Application 2025 & 2033
- Figure 13: South America USA Food Flavor and Enhancer Industry Revenue Share (%), by Application 2025 & 2033
- Figure 14: South America USA Food Flavor and Enhancer Industry Revenue (Million), by Country 2025 & 2033
- Figure 15: South America USA Food Flavor and Enhancer Industry Revenue Share (%), by Country 2025 & 2033
- Figure 16: Europe USA Food Flavor and Enhancer Industry Revenue (Million), by Type 2025 & 2033
- Figure 17: Europe USA Food Flavor and Enhancer Industry Revenue Share (%), by Type 2025 & 2033
- Figure 18: Europe USA Food Flavor and Enhancer Industry Revenue (Million), by Application 2025 & 2033
- Figure 19: Europe USA Food Flavor and Enhancer Industry Revenue Share (%), by Application 2025 & 2033
- Figure 20: Europe USA Food Flavor and Enhancer Industry Revenue (Million), by Country 2025 & 2033
- Figure 21: Europe USA Food Flavor and Enhancer Industry Revenue Share (%), by Country 2025 & 2033
- Figure 22: Middle East & Africa USA Food Flavor and Enhancer Industry Revenue (Million), by Type 2025 & 2033
- Figure 23: Middle East & Africa USA Food Flavor and Enhancer Industry Revenue Share (%), by Type 2025 & 2033
- Figure 24: Middle East & Africa USA Food Flavor and Enhancer Industry Revenue (Million), by Application 2025 & 2033
- Figure 25: Middle East & Africa USA Food Flavor and Enhancer Industry Revenue Share (%), by Application 2025 & 2033
- Figure 26: Middle East & Africa USA Food Flavor and Enhancer Industry Revenue (Million), by Country 2025 & 2033
- Figure 27: Middle East & Africa USA Food Flavor and Enhancer Industry Revenue Share (%), by Country 2025 & 2033
- Figure 28: Asia Pacific USA Food Flavor and Enhancer Industry Revenue (Million), by Type 2025 & 2033
- Figure 29: Asia Pacific USA Food Flavor and Enhancer Industry Revenue Share (%), by Type 2025 & 2033
- Figure 30: Asia Pacific USA Food Flavor and Enhancer Industry Revenue (Million), by Application 2025 & 2033
- Figure 31: Asia Pacific USA Food Flavor and Enhancer Industry Revenue Share (%), by Application 2025 & 2033
- Figure 32: Asia Pacific USA Food Flavor and Enhancer Industry Revenue (Million), by Country 2025 & 2033
- Figure 33: Asia Pacific USA Food Flavor and Enhancer Industry Revenue Share (%), by Country 2025 & 2033
List of Tables
- Table 1: Global USA Food Flavor and Enhancer Industry Revenue Million Forecast, by Region 2020 & 2033
- Table 2: Global USA Food Flavor and Enhancer Industry Revenue Million Forecast, by Type 2020 & 2033
- Table 3: Global USA Food Flavor and Enhancer Industry Revenue Million Forecast, by Application 2020 & 2033
- Table 4: Global USA Food Flavor and Enhancer Industry Revenue Million Forecast, by Region 2020 & 2033
- Table 5: Global USA Food Flavor and Enhancer Industry Revenue Million Forecast, by Country 2020 & 2033
- Table 6: Northeast USA Food Flavor and Enhancer Industry Revenue (Million) Forecast, by Application 2020 & 2033
- Table 7: Southeast USA Food Flavor and Enhancer Industry Revenue (Million) Forecast, by Application 2020 & 2033
- Table 8: Midwest USA Food Flavor and Enhancer Industry Revenue (Million) Forecast, by Application 2020 & 2033
- Table 9: Southwest USA Food Flavor and Enhancer Industry Revenue (Million) Forecast, by Application 2020 & 2033
- Table 10: West USA Food Flavor and Enhancer Industry Revenue (Million) Forecast, by Application 2020 & 2033
- Table 11: Global USA Food Flavor and Enhancer Industry Revenue Million Forecast, by Type 2020 & 2033
- Table 12: Global USA Food Flavor and Enhancer Industry Revenue Million Forecast, by Application 2020 & 2033
- Table 13: Global USA Food Flavor and Enhancer Industry Revenue Million Forecast, by Country 2020 & 2033
- Table 14: United States USA Food Flavor and Enhancer Industry Revenue (Million) Forecast, by Application 2020 & 2033
- Table 15: Canada USA Food Flavor and Enhancer Industry Revenue (Million) Forecast, by Application 2020 & 2033
- Table 16: Mexico USA Food Flavor and Enhancer Industry Revenue (Million) Forecast, by Application 2020 & 2033
- Table 17: Global USA Food Flavor and Enhancer Industry Revenue Million Forecast, by Type 2020 & 2033
- Table 18: Global USA Food Flavor and Enhancer Industry Revenue Million Forecast, by Application 2020 & 2033
- Table 19: Global USA Food Flavor and Enhancer Industry Revenue Million Forecast, by Country 2020 & 2033
- Table 20: Brazil USA Food Flavor and Enhancer Industry Revenue (Million) Forecast, by Application 2020 & 2033
- Table 21: Argentina USA Food Flavor and Enhancer Industry Revenue (Million) Forecast, by Application 2020 & 2033
- Table 22: Rest of South America USA Food Flavor and Enhancer Industry Revenue (Million) Forecast, by Application 2020 & 2033
- Table 23: Global USA Food Flavor and Enhancer Industry Revenue Million Forecast, by Type 2020 & 2033
- Table 24: Global USA Food Flavor and Enhancer Industry Revenue Million Forecast, by Application 2020 & 2033
- Table 25: Global USA Food Flavor and Enhancer Industry Revenue Million Forecast, by Country 2020 & 2033
- Table 26: United Kingdom USA Food Flavor and Enhancer Industry Revenue (Million) Forecast, by Application 2020 & 2033
- Table 27: Germany USA Food Flavor and Enhancer Industry Revenue (Million) Forecast, by Application 2020 & 2033
- Table 28: France USA Food Flavor and Enhancer Industry Revenue (Million) Forecast, by Application 2020 & 2033
- Table 29: Italy USA Food Flavor and Enhancer Industry Revenue (Million) Forecast, by Application 2020 & 2033
- Table 30: Spain USA Food Flavor and Enhancer Industry Revenue (Million) Forecast, by Application 2020 & 2033
- Table 31: Russia USA Food Flavor and Enhancer Industry Revenue (Million) Forecast, by Application 2020 & 2033
- Table 32: Benelux USA Food Flavor and Enhancer Industry Revenue (Million) Forecast, by Application 2020 & 2033
- Table 33: Nordics USA Food Flavor and Enhancer Industry Revenue (Million) Forecast, by Application 2020 & 2033
- Table 34: Rest of Europe USA Food Flavor and Enhancer Industry Revenue (Million) Forecast, by Application 2020 & 2033
- Table 35: Global USA Food Flavor and Enhancer Industry Revenue Million Forecast, by Type 2020 & 2033
- Table 36: Global USA Food Flavor and Enhancer Industry Revenue Million Forecast, by Application 2020 & 2033
- Table 37: Global USA Food Flavor and Enhancer Industry Revenue Million Forecast, by Country 2020 & 2033
- Table 38: Turkey USA Food Flavor and Enhancer Industry Revenue (Million) Forecast, by Application 2020 & 2033
- Table 39: Israel USA Food Flavor and Enhancer Industry Revenue (Million) Forecast, by Application 2020 & 2033
- Table 40: GCC USA Food Flavor and Enhancer Industry Revenue (Million) Forecast, by Application 2020 & 2033
- Table 41: North Africa USA Food Flavor and Enhancer Industry Revenue (Million) Forecast, by Application 2020 & 2033
- Table 42: South Africa USA Food Flavor and Enhancer Industry Revenue (Million) Forecast, by Application 2020 & 2033
- Table 43: Rest of Middle East & Africa USA Food Flavor and Enhancer Industry Revenue (Million) Forecast, by Application 2020 & 2033
- Table 44: Global USA Food Flavor and Enhancer Industry Revenue Million Forecast, by Type 2020 & 2033
- Table 45: Global USA Food Flavor and Enhancer Industry Revenue Million Forecast, by Application 2020 & 2033
- Table 46: Global USA Food Flavor and Enhancer Industry Revenue Million Forecast, by Country 2020 & 2033
- Table 47: China USA Food Flavor and Enhancer Industry Revenue (Million) Forecast, by Application 2020 & 2033
- Table 48: India USA Food Flavor and Enhancer Industry Revenue (Million) Forecast, by Application 2020 & 2033
- Table 49: Japan USA Food Flavor and Enhancer Industry Revenue (Million) Forecast, by Application 2020 & 2033
- Table 50: South Korea USA Food Flavor and Enhancer Industry Revenue (Million) Forecast, by Application 2020 & 2033
- Table 51: ASEAN USA Food Flavor and Enhancer Industry Revenue (Million) Forecast, by Application 2020 & 2033
- Table 52: Oceania USA Food Flavor and Enhancer Industry Revenue (Million) Forecast, by Application 2020 & 2033
- Table 53: Rest of Asia Pacific USA Food Flavor and Enhancer Industry Revenue (Million) Forecast, by Application 2020 & 2033
Frequently Asked Questions
1. What is the projected Compound Annual Growth Rate (CAGR) of the USA Food Flavor and Enhancer Industry?
The projected CAGR is approximately 4.24%.
2. Which companies are prominent players in the USA Food Flavor and Enhancer Industry?
Key companies in the market include Firmenich SA, Givaudan, International Flavors & Fragrances Inc, DuPont de Nemours Inc, Archer Daniels Midland Company, Koninklijke DSM N V, FMC Corporation*List Not Exhaustive.
3. What are the main segments of the USA Food Flavor and Enhancer Industry?
The market segments include Type, Application.
4. Can you provide details about the market size?
The market size is estimated to be USD XX Million as of 2022.
5. What are some drivers contributing to market growth?
The Rising Awareness of the Health Benefits Associated with Collagen Consumption; Rising Sport and Fitness Trends Drives the Market Growth.
6. What are the notable trends driving market growth?
Increasing Demand For Natural Food Flavors and Enhancers.
7. Are there any restraints impacting market growth?
Concerns over the Source and Animal Welfare in Collagen Extraction Limit the Market Growth.
8. Can you provide examples of recent developments in the market?
N/A
9. What pricing options are available for accessing the report?
Pricing options include single-user, multi-user, and enterprise licenses priced at USD 3800, USD 4500, and USD 5800 respectively.
10. Is the market size provided in terms of value or volume?
The market size is provided in terms of value, measured in Million.
11. Are there any specific market keywords associated with the report?
Yes, the market keyword associated with the report is "USA Food Flavor and Enhancer Industry," which aids in identifying and referencing the specific market segment covered.
12. How do I determine which pricing option suits my needs best?
The pricing options vary based on user requirements and access needs. Individual users may opt for single-user licenses, while businesses requiring broader access may choose multi-user or enterprise licenses for cost-effective access to the report.
13. Are there any additional resources or data provided in the USA Food Flavor and Enhancer Industry report?
While the report offers comprehensive insights, it's advisable to review the specific contents or supplementary materials provided to ascertain if additional resources or data are available.
14. How can I stay updated on further developments or reports in the USA Food Flavor and Enhancer Industry?
To stay informed about further developments, trends, and reports in the USA Food Flavor and Enhancer Industry, consider subscribing to industry newsletters, following relevant companies and organizations, or regularly checking reputable industry news sources and publications.
Methodology
Step 1 - Identification of Relevant Samples Size from Population Database


Step 2 - Approaches for Defining Global Market Size (Value, Volume* & Price*)

Note*: In applicable scenarios
Step 3 - Data Sources
Primary Research
- Web Analytics
- Survey Reports
- Research Institute
- Latest Research Reports
- Opinion Leaders
Secondary Research
- Annual Reports
- White Paper
- Latest Press Release
- Industry Association
- Paid Database
- Investor Presentations

Step 4 - Data Triangulation
Involves using different sources of information in order to increase the validity of a study
These sources are likely to be stakeholders in a program - participants, other researchers, program staff, other community members, and so on.
Then we put all data in single framework & apply various statistical tools to find out the dynamic on the market.
During the analysis stage, feedback from the stakeholder groups would be compared to determine areas of agreement as well as areas of divergence
