

Key Insights
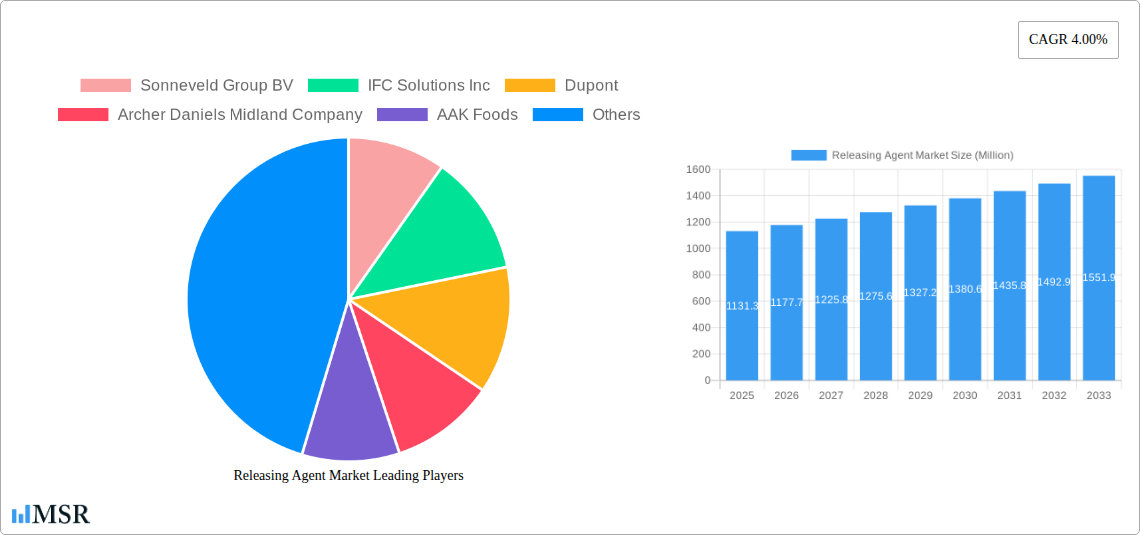
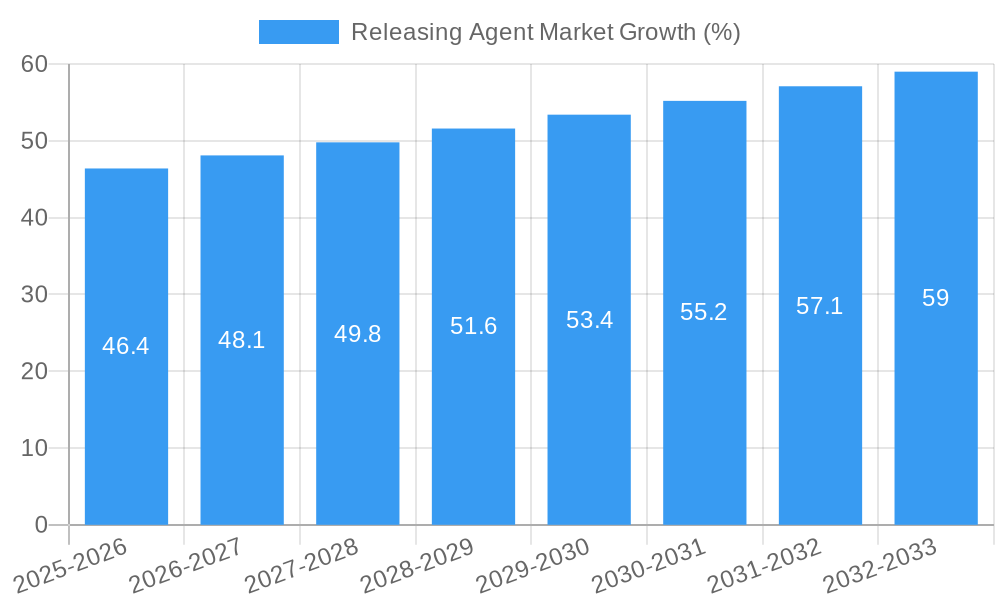
The global releasing agent market, valued at $1131.3 million in 2025, is projected to experience steady growth, driven by increasing demand across diverse industries. The Compound Annual Growth Rate (CAGR) of 4% from 2025 to 2033 indicates a consistent expansion, fueled primarily by the food industry's reliance on releasing agents for efficient production and the expanding pharmaceutical and industrial sectors adopting these agents for various applications. Growth in these sectors is anticipated to be particularly strong in developing economies in Asia-Pacific and South America, where manufacturing and industrial production are rapidly increasing. The market is segmented by type into fluid and solid release agents, with fluid agents currently holding a larger market share due to their versatility and wider application across industries. However, the demand for solid release agents is expected to rise gradually owing to their improved performance in specific applications and growing emphasis on sustainability. Key players like Sonneveld Group BV, DuPont, and BASF SE are strategically investing in research and development to improve product efficacy and expand their market presence. Competitive landscapes are shaped by innovation in product formulations and the development of eco-friendly, high-performance releasing agents.
The market faces certain restraints, including fluctuations in raw material prices and increasing environmental regulations impacting the manufacturing process of certain types of release agents. Companies are responding by focusing on sustainable sourcing of raw materials and developing environmentally benign formulations to mitigate these challenges. The overall market outlook remains positive, with continued growth projected throughout the forecast period. Strategic partnerships, mergers, and acquisitions are expected to further reshape the competitive landscape as companies seek to expand their product portfolios and market reach. Innovation in product design to improve performance and meet the specific requirements of different industries will continue to drive market growth. A robust supply chain will be crucial for manufacturers to meet the growing demand across regions and various applications.
Releasing Agent Market: A Comprehensive Report (2019-2033)
This in-depth report provides a comprehensive analysis of the Releasing Agent market, offering invaluable insights for stakeholders across the industry. From market dynamics and key players to emerging trends and future opportunities, this report is your essential guide to navigating this dynamic sector. Covering the period 2019-2033, with a base year of 2025 and a forecast period of 2025-2033, this study unveils the intricacies of the Releasing Agent market, providing a clear picture of its current state and future trajectory. The market size is projected to reach xx Million by 2033, exhibiting a CAGR of xx% during the forecast period.
Releasing Agent Market Concentration & Dynamics
The Releasing Agent market exhibits a moderately concentrated landscape, with key players such as Sonneveld Group BV, IFC Solutions Inc, Dupont, Archer Daniels Midland Company, AAK Foods, Avatar Corporation, Lecico GmbH, Puratos Group NV, Ecolab Inc, and BASF SE holding significant market share. However, the presence of several smaller, specialized players indicates a degree of fragmentation. Market share analysis reveals that the top 5 players account for approximately xx% of the global market in 2025. Innovation is a key driver, with companies investing heavily in R&D to develop novel releasing agents with enhanced performance characteristics. Regulatory frameworks, particularly concerning food safety and environmental impact, play a significant role in shaping market dynamics. The presence of substitute products, although limited, exerts some competitive pressure. End-user trends towards sustainable and eco-friendly options are driving demand for bio-based releasing agents. Furthermore, M&A activities are relatively frequent, with an estimated xx M&A deals concluded in the historical period (2019-2024), signifying consolidation and expansion within the sector.
- Market Concentration: Moderately concentrated, with top 5 players holding xx% market share in 2025.
- Innovation Ecosystem: High level of R&D investment driving product innovation.
- Regulatory Framework: Stringent regulations impacting product development and market access.
- Substitute Products: Limited substitutes, but increasing pressure from alternative technologies.
- End-User Trends: Growing demand for sustainable and eco-friendly options.
- M&A Activity: Approximately xx M&A deals in 2019-2024, indicating market consolidation.
Releasing Agent Market Industry Insights & Trends
The Releasing Agent market is experiencing robust growth, fueled by increasing demand across various applications. The market size reached xx Million in 2024 and is projected to reach xx Million by 2033, exhibiting a CAGR of xx%. This growth is driven by several factors, including rising consumption in the food industry (particularly baking and confectionery), expansion of the pharmaceutical sector, and the growing industrial application of releasing agents in manufacturing processes. Technological advancements, such as the development of bio-based and high-performance releasing agents, are further propelling market expansion. Evolving consumer preferences towards healthier and more sustainable products are also shaping market trends, with increased demand for natural and eco-friendly options. The report delves into detailed market segmentation, analyzing growth drivers and trends specific to each segment. The impact of macroeconomic factors, such as economic growth and fluctuations in raw material prices, on market performance is also comprehensively analyzed.
Key Markets & Segments Leading Releasing Agent Market
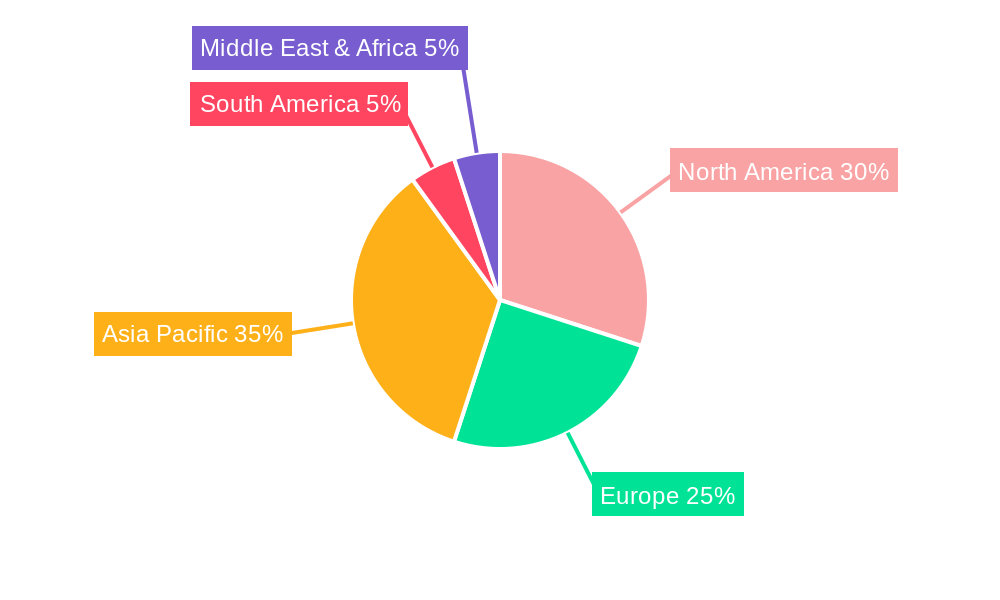
The food segment dominates the Releasing Agent market, accounting for approximately xx% of the global market in 2025, followed by the industrial application segment. Within the "By Type" segmentation, fluid release agents hold a larger market share than solid release agents. Geographically, North America and Europe represent the largest regional markets, driven by robust food and industrial sectors. However, Asia-Pacific is poised for significant growth, fueled by rapid economic expansion and increasing industrialization.
Key Drivers:
- Food Segment: Growing demand for bakery and confectionery products.
- Industrial Application Segment: Expansion of manufacturing sectors.
- North America & Europe: Established markets with strong food & industrial sectors.
- Asia-Pacific: Rapid economic growth and industrialization driving future growth.
Dominance Analysis: The food sector's dominance stems from the widespread use of releasing agents in various food processing applications, particularly in baking and confectionery. The strong performance of North America and Europe reflects mature markets with high consumption levels. The Asia-Pacific region, however, offers the most significant potential for future growth due to factors such as population growth, rising disposable incomes, and increasing industrial activity.
Releasing Agent Market Product Developments
Recent years have witnessed significant product innovations in the releasing agent market. Companies are focusing on developing environmentally friendly, bio-based alternatives to traditional petroleum-based products. Advancements in formulation technologies have led to the creation of high-performance releasing agents with enhanced properties such as improved release efficiency, reduced residue, and extended shelf life. These innovations are enhancing the competitiveness of existing players and creating new market opportunities.
Challenges in the Releasing Agent Market Market
The Releasing Agent market faces several challenges, including stringent regulatory requirements for food-grade products, increasing raw material costs, and intense competition from established and emerging players. These factors can influence pricing strategies and profitability. Supply chain disruptions and potential fluctuations in raw material availability pose additional challenges. The overall impact of these challenges on market growth is estimated to be around xx%.
Forces Driving Releasing Agent Market Growth
Several factors are driving growth in the Releasing Agent market. Technological advancements lead to improved product performance and sustainability. Economic growth in key regions boosts industrial activity and food consumption. Favorable regulatory frameworks can enhance market access and innovation. For example, the increasing focus on sustainable packaging is creating demand for eco-friendly releasing agents.
Long-Term Growth Catalysts in the Releasing Agent Market
Long-term growth will be fueled by continued innovation in materials science, leading to the development of more sustainable and effective releasing agents. Strategic partnerships and collaborations will enhance market reach and product diversification. Expansion into new geographic markets, particularly in developing economies, will unlock significant growth potential.
Emerging Opportunities in Releasing Agent Market
Emerging opportunities exist in developing bio-based and sustainable releasing agents, catering to the growing demand for eco-friendly products. Penetration into niche applications, such as 3D printing and advanced materials processing, presents significant potential. Moreover, focusing on customized solutions and tailored formulations for specific end-user needs will create new avenues for growth.
Leading Players in the Releasing Agent Market Sector
- Sonneveld Group BV
- IFC Solutions Inc
- Dupont
- Archer Daniels Midland Company
- AAK Foods
- Avatar Corporation
- Lecico GmbH
- Puratos Group NV
- Ecolab Inc
- BASF SE
Key Milestones in Releasing Agent Market Industry
- 2020: Introduction of a new bio-based releasing agent by BASF SE.
- 2021: Acquisition of a smaller releasing agent manufacturer by Dupont.
- 2022: Launch of a high-performance releasing agent with reduced residue by Sonneveld Group BV.
- 2023: Increased regulatory scrutiny on certain releasing agent components in the EU.
- 2024: Significant investment in R&D by several key players focused on sustainable solutions.
Strategic Outlook for Releasing Agent Market Market
The Releasing Agent market presents significant future potential. Continued innovation in materials science and formulation technologies will drive growth. Strategic partnerships and expansion into new markets will be key for success. Companies that focus on sustainability and eco-friendly solutions will be particularly well-positioned to capitalize on future opportunities. The market is projected to maintain a steady growth trajectory, with specific segments experiencing particularly strong expansion.
Releasing Agent Market Segmentation
-
1. Type
- 1.1. Fluid Release Agents
- 1.2. Solid Release Agents
-
2. Application
-
2.1. Food
- 2.1.1. Bakery & Confectionery
- 2.1.2. Processed Meat
- 2.1.3. Others
- 2.2. Pharmaceutical
- 2.3. Industrial Application
-
2.1. Food
Releasing Agent Market Segmentation By Geography
-
1. North America
- 1.1. United States
- 1.2. Canada
- 1.3. Mexico
- 1.4. Rest of North America
-
2. Europe
- 2.1. United Kingdom
- 2.2. Germany
- 2.3. France
- 2.4. Russia
- 2.5. Italy
- 2.6. Spain
- 2.7. Rest of Europe
-
3. Asia Pacific
- 3.1. India
- 3.2. China
- 3.3. Japan
- 3.4. Australia
- 3.5. Rest of Asia Pacific
-
4. South America
- 4.1. Brazil
- 4.2. Argentina
- 4.3. Rest of South America
- 5. Middle East
-
6. South Africa
- 6.1. Saudi Arabia
- 6.2. Rest of Middle East
Releasing Agent Market REPORT HIGHLIGHTS
| Aspects | Details |
|---|---|
| Study Period | 2019-2033 |
| Base Year | 2024 |
| Estimated Year | 2025 |
| Forecast Period | 2025-2033 |
| Historical Period | 2019-2024 |
| Growth Rate | CAGR of 4.00% from 2019-2033 |
| Segmentation |
|
Table of Contents
- 1. Introduction
- 1.1. Research Scope
- 1.2. Market Segmentation
- 1.3. Research Methodology
- 1.4. Definitions and Assumptions
- 2. Executive Summary
- 2.1. Introduction
- 3. Market Dynamics
- 3.1. Introduction
- 3.2. Market Drivers
- 3.2.1. Increasing Demand for Processed Food Products; Technological Advancements Supporting Market Growth
- 3.3. Market Restrains
- 3.3.1. Increasing Cost of Production Due to Rise in Energy and Labor Cost
- 3.4. Market Trends
- 3.4.1. Growing Demand for Baked Goods
- 4. Market Factor Analysis
- 4.1. Porters Five Forces
- 4.2. Supply/Value Chain
- 4.3. PESTEL analysis
- 4.4. Market Entropy
- 4.5. Patent/Trademark Analysis
- 5. Global Releasing Agent Market Analysis, Insights and Forecast, 2019-2031
- 5.1. Market Analysis, Insights and Forecast - by Type
- 5.1.1. Fluid Release Agents
- 5.1.2. Solid Release Agents
- 5.2. Market Analysis, Insights and Forecast - by Application
- 5.2.1. Food
- 5.2.1.1. Bakery & Confectionery
- 5.2.1.2. Processed Meat
- 5.2.1.3. Others
- 5.2.2. Pharmaceutical
- 5.2.3. Industrial Application
- 5.2.1. Food
- 5.3. Market Analysis, Insights and Forecast - by Region
- 5.3.1. North America
- 5.3.2. Europe
- 5.3.3. Asia Pacific
- 5.3.4. South America
- 5.3.5. Middle East
- 5.3.6. South Africa
- 5.1. Market Analysis, Insights and Forecast - by Type
- 6. North America Releasing Agent Market Analysis, Insights and Forecast, 2019-2031
- 6.1. Market Analysis, Insights and Forecast - by Type
- 6.1.1. Fluid Release Agents
- 6.1.2. Solid Release Agents
- 6.2. Market Analysis, Insights and Forecast - by Application
- 6.2.1. Food
- 6.2.1.1. Bakery & Confectionery
- 6.2.1.2. Processed Meat
- 6.2.1.3. Others
- 6.2.2. Pharmaceutical
- 6.2.3. Industrial Application
- 6.2.1. Food
- 6.1. Market Analysis, Insights and Forecast - by Type
- 7. Europe Releasing Agent Market Analysis, Insights and Forecast, 2019-2031
- 7.1. Market Analysis, Insights and Forecast - by Type
- 7.1.1. Fluid Release Agents
- 7.1.2. Solid Release Agents
- 7.2. Market Analysis, Insights and Forecast - by Application
- 7.2.1. Food
- 7.2.1.1. Bakery & Confectionery
- 7.2.1.2. Processed Meat
- 7.2.1.3. Others
- 7.2.2. Pharmaceutical
- 7.2.3. Industrial Application
- 7.2.1. Food
- 7.1. Market Analysis, Insights and Forecast - by Type
- 8. Asia Pacific Releasing Agent Market Analysis, Insights and Forecast, 2019-2031
- 8.1. Market Analysis, Insights and Forecast - by Type
- 8.1.1. Fluid Release Agents
- 8.1.2. Solid Release Agents
- 8.2. Market Analysis, Insights and Forecast - by Application
- 8.2.1. Food
- 8.2.1.1. Bakery & Confectionery
- 8.2.1.2. Processed Meat
- 8.2.1.3. Others
- 8.2.2. Pharmaceutical
- 8.2.3. Industrial Application
- 8.2.1. Food
- 8.1. Market Analysis, Insights and Forecast - by Type
- 9. South America Releasing Agent Market Analysis, Insights and Forecast, 2019-2031
- 9.1. Market Analysis, Insights and Forecast - by Type
- 9.1.1. Fluid Release Agents
- 9.1.2. Solid Release Agents
- 9.2. Market Analysis, Insights and Forecast - by Application
- 9.2.1. Food
- 9.2.1.1. Bakery & Confectionery
- 9.2.1.2. Processed Meat
- 9.2.1.3. Others
- 9.2.2. Pharmaceutical
- 9.2.3. Industrial Application
- 9.2.1. Food
- 9.1. Market Analysis, Insights and Forecast - by Type
- 10. Middle East Releasing Agent Market Analysis, Insights and Forecast, 2019-2031
- 10.1. Market Analysis, Insights and Forecast - by Type
- 10.1.1. Fluid Release Agents
- 10.1.2. Solid Release Agents
- 10.2. Market Analysis, Insights and Forecast - by Application
- 10.2.1. Food
- 10.2.1.1. Bakery & Confectionery
- 10.2.1.2. Processed Meat
- 10.2.1.3. Others
- 10.2.2. Pharmaceutical
- 10.2.3. Industrial Application
- 10.2.1. Food
- 10.1. Market Analysis, Insights and Forecast - by Type
- 11. South Africa Releasing Agent Market Analysis, Insights and Forecast, 2019-2031
- 11.1. Market Analysis, Insights and Forecast - by Type
- 11.1.1. Fluid Release Agents
- 11.1.2. Solid Release Agents
- 11.2. Market Analysis, Insights and Forecast - by Application
- 11.2.1. Food
- 11.2.1.1. Bakery & Confectionery
- 11.2.1.2. Processed Meat
- 11.2.1.3. Others
- 11.2.2. Pharmaceutical
- 11.2.3. Industrial Application
- 11.2.1. Food
- 11.1. Market Analysis, Insights and Forecast - by Type
- 12. North America Releasing Agent Market Analysis, Insights and Forecast, 2019-2031
- 12.1. Market Analysis, Insights and Forecast - By Country/Sub-region
- 12.1.1 United States
- 12.1.2 Canada
- 12.1.3 Mexico
- 12.1.4 Rest of North America
- 13. Europe Releasing Agent Market Analysis, Insights and Forecast, 2019-2031
- 13.1. Market Analysis, Insights and Forecast - By Country/Sub-region
- 13.1.1 United Kingdom
- 13.1.2 Germany
- 13.1.3 France
- 13.1.4 Russia
- 13.1.5 Italy
- 13.1.6 Spain
- 13.1.7 Rest of Europe
- 14. Asia Pacific Releasing Agent Market Analysis, Insights and Forecast, 2019-2031
- 14.1. Market Analysis, Insights and Forecast - By Country/Sub-region
- 14.1.1 India
- 14.1.2 China
- 14.1.3 Japan
- 14.1.4 Australia
- 14.1.5 Rest of Asia Pacific
- 15. South America Releasing Agent Market Analysis, Insights and Forecast, 2019-2031
- 15.1. Market Analysis, Insights and Forecast - By Country/Sub-region
- 15.1.1 Brazil
- 15.1.2 Argentina
- 15.1.3 Rest of South America
- 16. Middle East Releasing Agent Market Analysis, Insights and Forecast, 2019-2031
- 16.1. Market Analysis, Insights and Forecast - By Country/Sub-region
- 16.1.1 Middle East
- 16.1.2 Africa
- 17. South Africa Releasing Agent Market Analysis, Insights and Forecast, 2019-2031
- 17.1. Market Analysis, Insights and Forecast - By Country/Sub-region
- 17.1.1 Saudi Arabia
- 17.1.2 Rest of Middle East
- 18. Competitive Analysis
- 18.1. Global Market Share Analysis 2024
- 18.2. Company Profiles
- 18.2.1 Sonneveld Group BV
- 18.2.1.1. Overview
- 18.2.1.2. Products
- 18.2.1.3. SWOT Analysis
- 18.2.1.4. Recent Developments
- 18.2.1.5. Financials (Based on Availability)
- 18.2.2 IFC Solutions Inc
- 18.2.2.1. Overview
- 18.2.2.2. Products
- 18.2.2.3. SWOT Analysis
- 18.2.2.4. Recent Developments
- 18.2.2.5. Financials (Based on Availability)
- 18.2.3 Dupont
- 18.2.3.1. Overview
- 18.2.3.2. Products
- 18.2.3.3. SWOT Analysis
- 18.2.3.4. Recent Developments
- 18.2.3.5. Financials (Based on Availability)
- 18.2.4 Archer Daniels Midland Company
- 18.2.4.1. Overview
- 18.2.4.2. Products
- 18.2.4.3. SWOT Analysis
- 18.2.4.4. Recent Developments
- 18.2.4.5. Financials (Based on Availability)
- 18.2.5 AAK Foods
- 18.2.5.1. Overview
- 18.2.5.2. Products
- 18.2.5.3. SWOT Analysis
- 18.2.5.4. Recent Developments
- 18.2.5.5. Financials (Based on Availability)
- 18.2.6 Avatar Corporation
- 18.2.6.1. Overview
- 18.2.6.2. Products
- 18.2.6.3. SWOT Analysis
- 18.2.6.4. Recent Developments
- 18.2.6.5. Financials (Based on Availability)
- 18.2.7 Lecico GmbH*List Not Exhaustive
- 18.2.7.1. Overview
- 18.2.7.2. Products
- 18.2.7.3. SWOT Analysis
- 18.2.7.4. Recent Developments
- 18.2.7.5. Financials (Based on Availability)
- 18.2.8 Puratos Group NV
- 18.2.8.1. Overview
- 18.2.8.2. Products
- 18.2.8.3. SWOT Analysis
- 18.2.8.4. Recent Developments
- 18.2.8.5. Financials (Based on Availability)
- 18.2.9 Ecolab Inc.
- 18.2.9.1. Overview
- 18.2.9.2. Products
- 18.2.9.3. SWOT Analysis
- 18.2.9.4. Recent Developments
- 18.2.9.5. Financials (Based on Availability)
- 18.2.10 BASF SE
- 18.2.10.1. Overview
- 18.2.10.2. Products
- 18.2.10.3. SWOT Analysis
- 18.2.10.4. Recent Developments
- 18.2.10.5. Financials (Based on Availability)
- 18.2.1 Sonneveld Group BV
List of Figures
- Figure 1: Global Releasing Agent Market Revenue Breakdown (Million, %) by Region 2024 & 2032
- Figure 2: Global Releasing Agent Market Volume Breakdown (k Tons, %) by Region 2024 & 2032
- Figure 3: North America Releasing Agent Market Revenue (Million), by Country 2024 & 2032
- Figure 4: North America Releasing Agent Market Volume (k Tons), by Country 2024 & 2032
- Figure 5: North America Releasing Agent Market Revenue Share (%), by Country 2024 & 2032
- Figure 6: North America Releasing Agent Market Volume Share (%), by Country 2024 & 2032
- Figure 7: Europe Releasing Agent Market Revenue (Million), by Country 2024 & 2032
- Figure 8: Europe Releasing Agent Market Volume (k Tons), by Country 2024 & 2032
- Figure 9: Europe Releasing Agent Market Revenue Share (%), by Country 2024 & 2032
- Figure 10: Europe Releasing Agent Market Volume Share (%), by Country 2024 & 2032
- Figure 11: Asia Pacific Releasing Agent Market Revenue (Million), by Country 2024 & 2032
- Figure 12: Asia Pacific Releasing Agent Market Volume (k Tons), by Country 2024 & 2032
- Figure 13: Asia Pacific Releasing Agent Market Revenue Share (%), by Country 2024 & 2032
- Figure 14: Asia Pacific Releasing Agent Market Volume Share (%), by Country 2024 & 2032
- Figure 15: South America Releasing Agent Market Revenue (Million), by Country 2024 & 2032
- Figure 16: South America Releasing Agent Market Volume (k Tons), by Country 2024 & 2032
- Figure 17: South America Releasing Agent Market Revenue Share (%), by Country 2024 & 2032
- Figure 18: South America Releasing Agent Market Volume Share (%), by Country 2024 & 2032
- Figure 19: Middle East Releasing Agent Market Revenue (Million), by Country 2024 & 2032
- Figure 20: Middle East Releasing Agent Market Volume (k Tons), by Country 2024 & 2032
- Figure 21: Middle East Releasing Agent Market Revenue Share (%), by Country 2024 & 2032
- Figure 22: Middle East Releasing Agent Market Volume Share (%), by Country 2024 & 2032
- Figure 23: South Africa Releasing Agent Market Revenue (Million), by Country 2024 & 2032
- Figure 24: South Africa Releasing Agent Market Volume (k Tons), by Country 2024 & 2032
- Figure 25: South Africa Releasing Agent Market Revenue Share (%), by Country 2024 & 2032
- Figure 26: South Africa Releasing Agent Market Volume Share (%), by Country 2024 & 2032
- Figure 27: North America Releasing Agent Market Revenue (Million), by Type 2024 & 2032
- Figure 28: North America Releasing Agent Market Volume (k Tons), by Type 2024 & 2032
- Figure 29: North America Releasing Agent Market Revenue Share (%), by Type 2024 & 2032
- Figure 30: North America Releasing Agent Market Volume Share (%), by Type 2024 & 2032
- Figure 31: North America Releasing Agent Market Revenue (Million), by Application 2024 & 2032
- Figure 32: North America Releasing Agent Market Volume (k Tons), by Application 2024 & 2032
- Figure 33: North America Releasing Agent Market Revenue Share (%), by Application 2024 & 2032
- Figure 34: North America Releasing Agent Market Volume Share (%), by Application 2024 & 2032
- Figure 35: North America Releasing Agent Market Revenue (Million), by Country 2024 & 2032
- Figure 36: North America Releasing Agent Market Volume (k Tons), by Country 2024 & 2032
- Figure 37: North America Releasing Agent Market Revenue Share (%), by Country 2024 & 2032
- Figure 38: North America Releasing Agent Market Volume Share (%), by Country 2024 & 2032
- Figure 39: Europe Releasing Agent Market Revenue (Million), by Type 2024 & 2032
- Figure 40: Europe Releasing Agent Market Volume (k Tons), by Type 2024 & 2032
- Figure 41: Europe Releasing Agent Market Revenue Share (%), by Type 2024 & 2032
- Figure 42: Europe Releasing Agent Market Volume Share (%), by Type 2024 & 2032
- Figure 43: Europe Releasing Agent Market Revenue (Million), by Application 2024 & 2032
- Figure 44: Europe Releasing Agent Market Volume (k Tons), by Application 2024 & 2032
- Figure 45: Europe Releasing Agent Market Revenue Share (%), by Application 2024 & 2032
- Figure 46: Europe Releasing Agent Market Volume Share (%), by Application 2024 & 2032
- Figure 47: Europe Releasing Agent Market Revenue (Million), by Country 2024 & 2032
- Figure 48: Europe Releasing Agent Market Volume (k Tons), by Country 2024 & 2032
- Figure 49: Europe Releasing Agent Market Revenue Share (%), by Country 2024 & 2032
- Figure 50: Europe Releasing Agent Market Volume Share (%), by Country 2024 & 2032
- Figure 51: Asia Pacific Releasing Agent Market Revenue (Million), by Type 2024 & 2032
- Figure 52: Asia Pacific Releasing Agent Market Volume (k Tons), by Type 2024 & 2032
- Figure 53: Asia Pacific Releasing Agent Market Revenue Share (%), by Type 2024 & 2032
- Figure 54: Asia Pacific Releasing Agent Market Volume Share (%), by Type 2024 & 2032
- Figure 55: Asia Pacific Releasing Agent Market Revenue (Million), by Application 2024 & 2032
- Figure 56: Asia Pacific Releasing Agent Market Volume (k Tons), by Application 2024 & 2032
- Figure 57: Asia Pacific Releasing Agent Market Revenue Share (%), by Application 2024 & 2032
- Figure 58: Asia Pacific Releasing Agent Market Volume Share (%), by Application 2024 & 2032
- Figure 59: Asia Pacific Releasing Agent Market Revenue (Million), by Country 2024 & 2032
- Figure 60: Asia Pacific Releasing Agent Market Volume (k Tons), by Country 2024 & 2032
- Figure 61: Asia Pacific Releasing Agent Market Revenue Share (%), by Country 2024 & 2032
- Figure 62: Asia Pacific Releasing Agent Market Volume Share (%), by Country 2024 & 2032
- Figure 63: South America Releasing Agent Market Revenue (Million), by Type 2024 & 2032
- Figure 64: South America Releasing Agent Market Volume (k Tons), by Type 2024 & 2032
- Figure 65: South America Releasing Agent Market Revenue Share (%), by Type 2024 & 2032
- Figure 66: South America Releasing Agent Market Volume Share (%), by Type 2024 & 2032
- Figure 67: South America Releasing Agent Market Revenue (Million), by Application 2024 & 2032
- Figure 68: South America Releasing Agent Market Volume (k Tons), by Application 2024 & 2032
- Figure 69: South America Releasing Agent Market Revenue Share (%), by Application 2024 & 2032
- Figure 70: South America Releasing Agent Market Volume Share (%), by Application 2024 & 2032
- Figure 71: South America Releasing Agent Market Revenue (Million), by Country 2024 & 2032
- Figure 72: South America Releasing Agent Market Volume (k Tons), by Country 2024 & 2032
- Figure 73: South America Releasing Agent Market Revenue Share (%), by Country 2024 & 2032
- Figure 74: South America Releasing Agent Market Volume Share (%), by Country 2024 & 2032
- Figure 75: Middle East Releasing Agent Market Revenue (Million), by Type 2024 & 2032
- Figure 76: Middle East Releasing Agent Market Volume (k Tons), by Type 2024 & 2032
- Figure 77: Middle East Releasing Agent Market Revenue Share (%), by Type 2024 & 2032
- Figure 78: Middle East Releasing Agent Market Volume Share (%), by Type 2024 & 2032
- Figure 79: Middle East Releasing Agent Market Revenue (Million), by Application 2024 & 2032
- Figure 80: Middle East Releasing Agent Market Volume (k Tons), by Application 2024 & 2032
- Figure 81: Middle East Releasing Agent Market Revenue Share (%), by Application 2024 & 2032
- Figure 82: Middle East Releasing Agent Market Volume Share (%), by Application 2024 & 2032
- Figure 83: Middle East Releasing Agent Market Revenue (Million), by Country 2024 & 2032
- Figure 84: Middle East Releasing Agent Market Volume (k Tons), by Country 2024 & 2032
- Figure 85: Middle East Releasing Agent Market Revenue Share (%), by Country 2024 & 2032
- Figure 86: Middle East Releasing Agent Market Volume Share (%), by Country 2024 & 2032
- Figure 87: South Africa Releasing Agent Market Revenue (Million), by Type 2024 & 2032
- Figure 88: South Africa Releasing Agent Market Volume (k Tons), by Type 2024 & 2032
- Figure 89: South Africa Releasing Agent Market Revenue Share (%), by Type 2024 & 2032
- Figure 90: South Africa Releasing Agent Market Volume Share (%), by Type 2024 & 2032
- Figure 91: South Africa Releasing Agent Market Revenue (Million), by Application 2024 & 2032
- Figure 92: South Africa Releasing Agent Market Volume (k Tons), by Application 2024 & 2032
- Figure 93: South Africa Releasing Agent Market Revenue Share (%), by Application 2024 & 2032
- Figure 94: South Africa Releasing Agent Market Volume Share (%), by Application 2024 & 2032
- Figure 95: South Africa Releasing Agent Market Revenue (Million), by Country 2024 & 2032
- Figure 96: South Africa Releasing Agent Market Volume (k Tons), by Country 2024 & 2032
- Figure 97: South Africa Releasing Agent Market Revenue Share (%), by Country 2024 & 2032
- Figure 98: South Africa Releasing Agent Market Volume Share (%), by Country 2024 & 2032
List of Tables
- Table 1: Global Releasing Agent Market Revenue Million Forecast, by Region 2019 & 2032
- Table 2: Global Releasing Agent Market Volume k Tons Forecast, by Region 2019 & 2032
- Table 3: Global Releasing Agent Market Revenue Million Forecast, by Type 2019 & 2032
- Table 4: Global Releasing Agent Market Volume k Tons Forecast, by Type 2019 & 2032
- Table 5: Global Releasing Agent Market Revenue Million Forecast, by Application 2019 & 2032
- Table 6: Global Releasing Agent Market Volume k Tons Forecast, by Application 2019 & 2032
- Table 7: Global Releasing Agent Market Revenue Million Forecast, by Region 2019 & 2032
- Table 8: Global Releasing Agent Market Volume k Tons Forecast, by Region 2019 & 2032
- Table 9: Global Releasing Agent Market Revenue Million Forecast, by Country 2019 & 2032
- Table 10: Global Releasing Agent Market Volume k Tons Forecast, by Country 2019 & 2032
- Table 11: United States Releasing Agent Market Revenue (Million) Forecast, by Application 2019 & 2032
- Table 12: United States Releasing Agent Market Volume (k Tons) Forecast, by Application 2019 & 2032
- Table 13: Canada Releasing Agent Market Revenue (Million) Forecast, by Application 2019 & 2032
- Table 14: Canada Releasing Agent Market Volume (k Tons) Forecast, by Application 2019 & 2032
- Table 15: Mexico Releasing Agent Market Revenue (Million) Forecast, by Application 2019 & 2032
- Table 16: Mexico Releasing Agent Market Volume (k Tons) Forecast, by Application 2019 & 2032
- Table 17: Rest of North America Releasing Agent Market Revenue (Million) Forecast, by Application 2019 & 2032
- Table 18: Rest of North America Releasing Agent Market Volume (k Tons) Forecast, by Application 2019 & 2032
- Table 19: Global Releasing Agent Market Revenue Million Forecast, by Country 2019 & 2032
- Table 20: Global Releasing Agent Market Volume k Tons Forecast, by Country 2019 & 2032
- Table 21: United Kingdom Releasing Agent Market Revenue (Million) Forecast, by Application 2019 & 2032
- Table 22: United Kingdom Releasing Agent Market Volume (k Tons) Forecast, by Application 2019 & 2032
- Table 23: Germany Releasing Agent Market Revenue (Million) Forecast, by Application 2019 & 2032
- Table 24: Germany Releasing Agent Market Volume (k Tons) Forecast, by Application 2019 & 2032
- Table 25: France Releasing Agent Market Revenue (Million) Forecast, by Application 2019 & 2032
- Table 26: France Releasing Agent Market Volume (k Tons) Forecast, by Application 2019 & 2032
- Table 27: Russia Releasing Agent Market Revenue (Million) Forecast, by Application 2019 & 2032
- Table 28: Russia Releasing Agent Market Volume (k Tons) Forecast, by Application 2019 & 2032
- Table 29: Italy Releasing Agent Market Revenue (Million) Forecast, by Application 2019 & 2032
- Table 30: Italy Releasing Agent Market Volume (k Tons) Forecast, by Application 2019 & 2032
- Table 31: Spain Releasing Agent Market Revenue (Million) Forecast, by Application 2019 & 2032
- Table 32: Spain Releasing Agent Market Volume (k Tons) Forecast, by Application 2019 & 2032
- Table 33: Rest of Europe Releasing Agent Market Revenue (Million) Forecast, by Application 2019 & 2032
- Table 34: Rest of Europe Releasing Agent Market Volume (k Tons) Forecast, by Application 2019 & 2032
- Table 35: Global Releasing Agent Market Revenue Million Forecast, by Country 2019 & 2032
- Table 36: Global Releasing Agent Market Volume k Tons Forecast, by Country 2019 & 2032
- Table 37: India Releasing Agent Market Revenue (Million) Forecast, by Application 2019 & 2032
- Table 38: India Releasing Agent Market Volume (k Tons) Forecast, by Application 2019 & 2032
- Table 39: China Releasing Agent Market Revenue (Million) Forecast, by Application 2019 & 2032
- Table 40: China Releasing Agent Market Volume (k Tons) Forecast, by Application 2019 & 2032
- Table 41: Japan Releasing Agent Market Revenue (Million) Forecast, by Application 2019 & 2032
- Table 42: Japan Releasing Agent Market Volume (k Tons) Forecast, by Application 2019 & 2032
- Table 43: Australia Releasing Agent Market Revenue (Million) Forecast, by Application 2019 & 2032
- Table 44: Australia Releasing Agent Market Volume (k Tons) Forecast, by Application 2019 & 2032
- Table 45: Rest of Asia Pacific Releasing Agent Market Revenue (Million) Forecast, by Application 2019 & 2032
- Table 46: Rest of Asia Pacific Releasing Agent Market Volume (k Tons) Forecast, by Application 2019 & 2032
- Table 47: Global Releasing Agent Market Revenue Million Forecast, by Country 2019 & 2032
- Table 48: Global Releasing Agent Market Volume k Tons Forecast, by Country 2019 & 2032
- Table 49: Brazil Releasing Agent Market Revenue (Million) Forecast, by Application 2019 & 2032
- Table 50: Brazil Releasing Agent Market Volume (k Tons) Forecast, by Application 2019 & 2032
- Table 51: Argentina Releasing Agent Market Revenue (Million) Forecast, by Application 2019 & 2032
- Table 52: Argentina Releasing Agent Market Volume (k Tons) Forecast, by Application 2019 & 2032
- Table 53: Rest of South America Releasing Agent Market Revenue (Million) Forecast, by Application 2019 & 2032
- Table 54: Rest of South America Releasing Agent Market Volume (k Tons) Forecast, by Application 2019 & 2032
- Table 55: Global Releasing Agent Market Revenue Million Forecast, by Country 2019 & 2032
- Table 56: Global Releasing Agent Market Volume k Tons Forecast, by Country 2019 & 2032
- Table 57: Middle East Releasing Agent Market Revenue (Million) Forecast, by Application 2019 & 2032
- Table 58: Middle East Releasing Agent Market Volume (k Tons) Forecast, by Application 2019 & 2032
- Table 59: Africa Releasing Agent Market Revenue (Million) Forecast, by Application 2019 & 2032
- Table 60: Africa Releasing Agent Market Volume (k Tons) Forecast, by Application 2019 & 2032
- Table 61: Global Releasing Agent Market Revenue Million Forecast, by Country 2019 & 2032
- Table 62: Global Releasing Agent Market Volume k Tons Forecast, by Country 2019 & 2032
- Table 63: Saudi Arabia Releasing Agent Market Revenue (Million) Forecast, by Application 2019 & 2032
- Table 64: Saudi Arabia Releasing Agent Market Volume (k Tons) Forecast, by Application 2019 & 2032
- Table 65: Rest of Middle East Releasing Agent Market Revenue (Million) Forecast, by Application 2019 & 2032
- Table 66: Rest of Middle East Releasing Agent Market Volume (k Tons) Forecast, by Application 2019 & 2032
- Table 67: Global Releasing Agent Market Revenue Million Forecast, by Type 2019 & 2032
- Table 68: Global Releasing Agent Market Volume k Tons Forecast, by Type 2019 & 2032
- Table 69: Global Releasing Agent Market Revenue Million Forecast, by Application 2019 & 2032
- Table 70: Global Releasing Agent Market Volume k Tons Forecast, by Application 2019 & 2032
- Table 71: Global Releasing Agent Market Revenue Million Forecast, by Country 2019 & 2032
- Table 72: Global Releasing Agent Market Volume k Tons Forecast, by Country 2019 & 2032
- Table 73: United States Releasing Agent Market Revenue (Million) Forecast, by Application 2019 & 2032
- Table 74: United States Releasing Agent Market Volume (k Tons) Forecast, by Application 2019 & 2032
- Table 75: Canada Releasing Agent Market Revenue (Million) Forecast, by Application 2019 & 2032
- Table 76: Canada Releasing Agent Market Volume (k Tons) Forecast, by Application 2019 & 2032
- Table 77: Mexico Releasing Agent Market Revenue (Million) Forecast, by Application 2019 & 2032
- Table 78: Mexico Releasing Agent Market Volume (k Tons) Forecast, by Application 2019 & 2032
- Table 79: Rest of North America Releasing Agent Market Revenue (Million) Forecast, by Application 2019 & 2032
- Table 80: Rest of North America Releasing Agent Market Volume (k Tons) Forecast, by Application 2019 & 2032
- Table 81: Global Releasing Agent Market Revenue Million Forecast, by Type 2019 & 2032
- Table 82: Global Releasing Agent Market Volume k Tons Forecast, by Type 2019 & 2032
- Table 83: Global Releasing Agent Market Revenue Million Forecast, by Application 2019 & 2032
- Table 84: Global Releasing Agent Market Volume k Tons Forecast, by Application 2019 & 2032
- Table 85: Global Releasing Agent Market Revenue Million Forecast, by Country 2019 & 2032
- Table 86: Global Releasing Agent Market Volume k Tons Forecast, by Country 2019 & 2032
- Table 87: United Kingdom Releasing Agent Market Revenue (Million) Forecast, by Application 2019 & 2032
- Table 88: United Kingdom Releasing Agent Market Volume (k Tons) Forecast, by Application 2019 & 2032
- Table 89: Germany Releasing Agent Market Revenue (Million) Forecast, by Application 2019 & 2032
- Table 90: Germany Releasing Agent Market Volume (k Tons) Forecast, by Application 2019 & 2032
- Table 91: France Releasing Agent Market Revenue (Million) Forecast, by Application 2019 & 2032
- Table 92: France Releasing Agent Market Volume (k Tons) Forecast, by Application 2019 & 2032
- Table 93: Russia Releasing Agent Market Revenue (Million) Forecast, by Application 2019 & 2032
- Table 94: Russia Releasing Agent Market Volume (k Tons) Forecast, by Application 2019 & 2032
- Table 95: Italy Releasing Agent Market Revenue (Million) Forecast, by Application 2019 & 2032
- Table 96: Italy Releasing Agent Market Volume (k Tons) Forecast, by Application 2019 & 2032
- Table 97: Spain Releasing Agent Market Revenue (Million) Forecast, by Application 2019 & 2032
- Table 98: Spain Releasing Agent Market Volume (k Tons) Forecast, by Application 2019 & 2032
- Table 99: Rest of Europe Releasing Agent Market Revenue (Million) Forecast, by Application 2019 & 2032
- Table 100: Rest of Europe Releasing Agent Market Volume (k Tons) Forecast, by Application 2019 & 2032
- Table 101: Global Releasing Agent Market Revenue Million Forecast, by Type 2019 & 2032
- Table 102: Global Releasing Agent Market Volume k Tons Forecast, by Type 2019 & 2032
- Table 103: Global Releasing Agent Market Revenue Million Forecast, by Application 2019 & 2032
- Table 104: Global Releasing Agent Market Volume k Tons Forecast, by Application 2019 & 2032
- Table 105: Global Releasing Agent Market Revenue Million Forecast, by Country 2019 & 2032
- Table 106: Global Releasing Agent Market Volume k Tons Forecast, by Country 2019 & 2032
- Table 107: India Releasing Agent Market Revenue (Million) Forecast, by Application 2019 & 2032
- Table 108: India Releasing Agent Market Volume (k Tons) Forecast, by Application 2019 & 2032
- Table 109: China Releasing Agent Market Revenue (Million) Forecast, by Application 2019 & 2032
- Table 110: China Releasing Agent Market Volume (k Tons) Forecast, by Application 2019 & 2032
- Table 111: Japan Releasing Agent Market Revenue (Million) Forecast, by Application 2019 & 2032
- Table 112: Japan Releasing Agent Market Volume (k Tons) Forecast, by Application 2019 & 2032
- Table 113: Australia Releasing Agent Market Revenue (Million) Forecast, by Application 2019 & 2032
- Table 114: Australia Releasing Agent Market Volume (k Tons) Forecast, by Application 2019 & 2032
- Table 115: Rest of Asia Pacific Releasing Agent Market Revenue (Million) Forecast, by Application 2019 & 2032
- Table 116: Rest of Asia Pacific Releasing Agent Market Volume (k Tons) Forecast, by Application 2019 & 2032
- Table 117: Global Releasing Agent Market Revenue Million Forecast, by Type 2019 & 2032
- Table 118: Global Releasing Agent Market Volume k Tons Forecast, by Type 2019 & 2032
- Table 119: Global Releasing Agent Market Revenue Million Forecast, by Application 2019 & 2032
- Table 120: Global Releasing Agent Market Volume k Tons Forecast, by Application 2019 & 2032
- Table 121: Global Releasing Agent Market Revenue Million Forecast, by Country 2019 & 2032
- Table 122: Global Releasing Agent Market Volume k Tons Forecast, by Country 2019 & 2032
- Table 123: Brazil Releasing Agent Market Revenue (Million) Forecast, by Application 2019 & 2032
- Table 124: Brazil Releasing Agent Market Volume (k Tons) Forecast, by Application 2019 & 2032
- Table 125: Argentina Releasing Agent Market Revenue (Million) Forecast, by Application 2019 & 2032
- Table 126: Argentina Releasing Agent Market Volume (k Tons) Forecast, by Application 2019 & 2032
- Table 127: Rest of South America Releasing Agent Market Revenue (Million) Forecast, by Application 2019 & 2032
- Table 128: Rest of South America Releasing Agent Market Volume (k Tons) Forecast, by Application 2019 & 2032
- Table 129: Global Releasing Agent Market Revenue Million Forecast, by Type 2019 & 2032
- Table 130: Global Releasing Agent Market Volume k Tons Forecast, by Type 2019 & 2032
- Table 131: Global Releasing Agent Market Revenue Million Forecast, by Application 2019 & 2032
- Table 132: Global Releasing Agent Market Volume k Tons Forecast, by Application 2019 & 2032
- Table 133: Global Releasing Agent Market Revenue Million Forecast, by Country 2019 & 2032
- Table 134: Global Releasing Agent Market Volume k Tons Forecast, by Country 2019 & 2032
- Table 135: Global Releasing Agent Market Revenue Million Forecast, by Type 2019 & 2032
- Table 136: Global Releasing Agent Market Volume k Tons Forecast, by Type 2019 & 2032
- Table 137: Global Releasing Agent Market Revenue Million Forecast, by Application 2019 & 2032
- Table 138: Global Releasing Agent Market Volume k Tons Forecast, by Application 2019 & 2032
- Table 139: Global Releasing Agent Market Revenue Million Forecast, by Country 2019 & 2032
- Table 140: Global Releasing Agent Market Volume k Tons Forecast, by Country 2019 & 2032
- Table 141: Saudi Arabia Releasing Agent Market Revenue (Million) Forecast, by Application 2019 & 2032
- Table 142: Saudi Arabia Releasing Agent Market Volume (k Tons) Forecast, by Application 2019 & 2032
- Table 143: Rest of Middle East Releasing Agent Market Revenue (Million) Forecast, by Application 2019 & 2032
- Table 144: Rest of Middle East Releasing Agent Market Volume (k Tons) Forecast, by Application 2019 & 2032
Frequently Asked Questions
1. What is the projected Compound Annual Growth Rate (CAGR) of the Releasing Agent Market?
The projected CAGR is approximately 4.00%.
2. Which companies are prominent players in the Releasing Agent Market?
Key companies in the market include Sonneveld Group BV, IFC Solutions Inc, Dupont, Archer Daniels Midland Company, AAK Foods, Avatar Corporation, Lecico GmbH*List Not Exhaustive, Puratos Group NV, Ecolab Inc. , BASF SE.
3. What are the main segments of the Releasing Agent Market?
The market segments include Type, Application.
4. Can you provide details about the market size?
The market size is estimated to be USD 1131.3 Million as of 2022.
5. What are some drivers contributing to market growth?
Increasing Demand for Processed Food Products; Technological Advancements Supporting Market Growth.
6. What are the notable trends driving market growth?
Growing Demand for Baked Goods.
7. Are there any restraints impacting market growth?
Increasing Cost of Production Due to Rise in Energy and Labor Cost.
8. Can you provide examples of recent developments in the market?
N/A
9. What pricing options are available for accessing the report?
Pricing options include single-user, multi-user, and enterprise licenses priced at USD 4750, USD 5250, and USD 8750 respectively.
10. Is the market size provided in terms of value or volume?
The market size is provided in terms of value, measured in Million and volume, measured in k Tons.
11. Are there any specific market keywords associated with the report?
Yes, the market keyword associated with the report is "Releasing Agent Market," which aids in identifying and referencing the specific market segment covered.
12. How do I determine which pricing option suits my needs best?
The pricing options vary based on user requirements and access needs. Individual users may opt for single-user licenses, while businesses requiring broader access may choose multi-user or enterprise licenses for cost-effective access to the report.
13. Are there any additional resources or data provided in the Releasing Agent Market report?
While the report offers comprehensive insights, it's advisable to review the specific contents or supplementary materials provided to ascertain if additional resources or data are available.
14. How can I stay updated on further developments or reports in the Releasing Agent Market?
To stay informed about further developments, trends, and reports in the Releasing Agent Market, consider subscribing to industry newsletters, following relevant companies and organizations, or regularly checking reputable industry news sources and publications.
Methodology
Step 1 - Identification of Relevant Samples Size from Population Database


Step 2 - Approaches for Defining Global Market Size (Value, Volume* & Price*)

Note*: In applicable scenarios
Step 3 - Data Sources
Primary Research
- Web Analytics
- Survey Reports
- Research Institute
- Latest Research Reports
- Opinion Leaders
Secondary Research
- Annual Reports
- White Paper
- Latest Press Release
- Industry Association
- Paid Database
- Investor Presentations

Step 4 - Data Triangulation
Involves using different sources of information in order to increase the validity of a study
These sources are likely to be stakeholders in a program - participants, other researchers, program staff, other community members, and so on.
Then we put all data in single framework & apply various statistical tools to find out the dynamic on the market.
During the analysis stage, feedback from the stakeholder groups would be compared to determine areas of agreement as well as areas of divergence
