

Key Insights
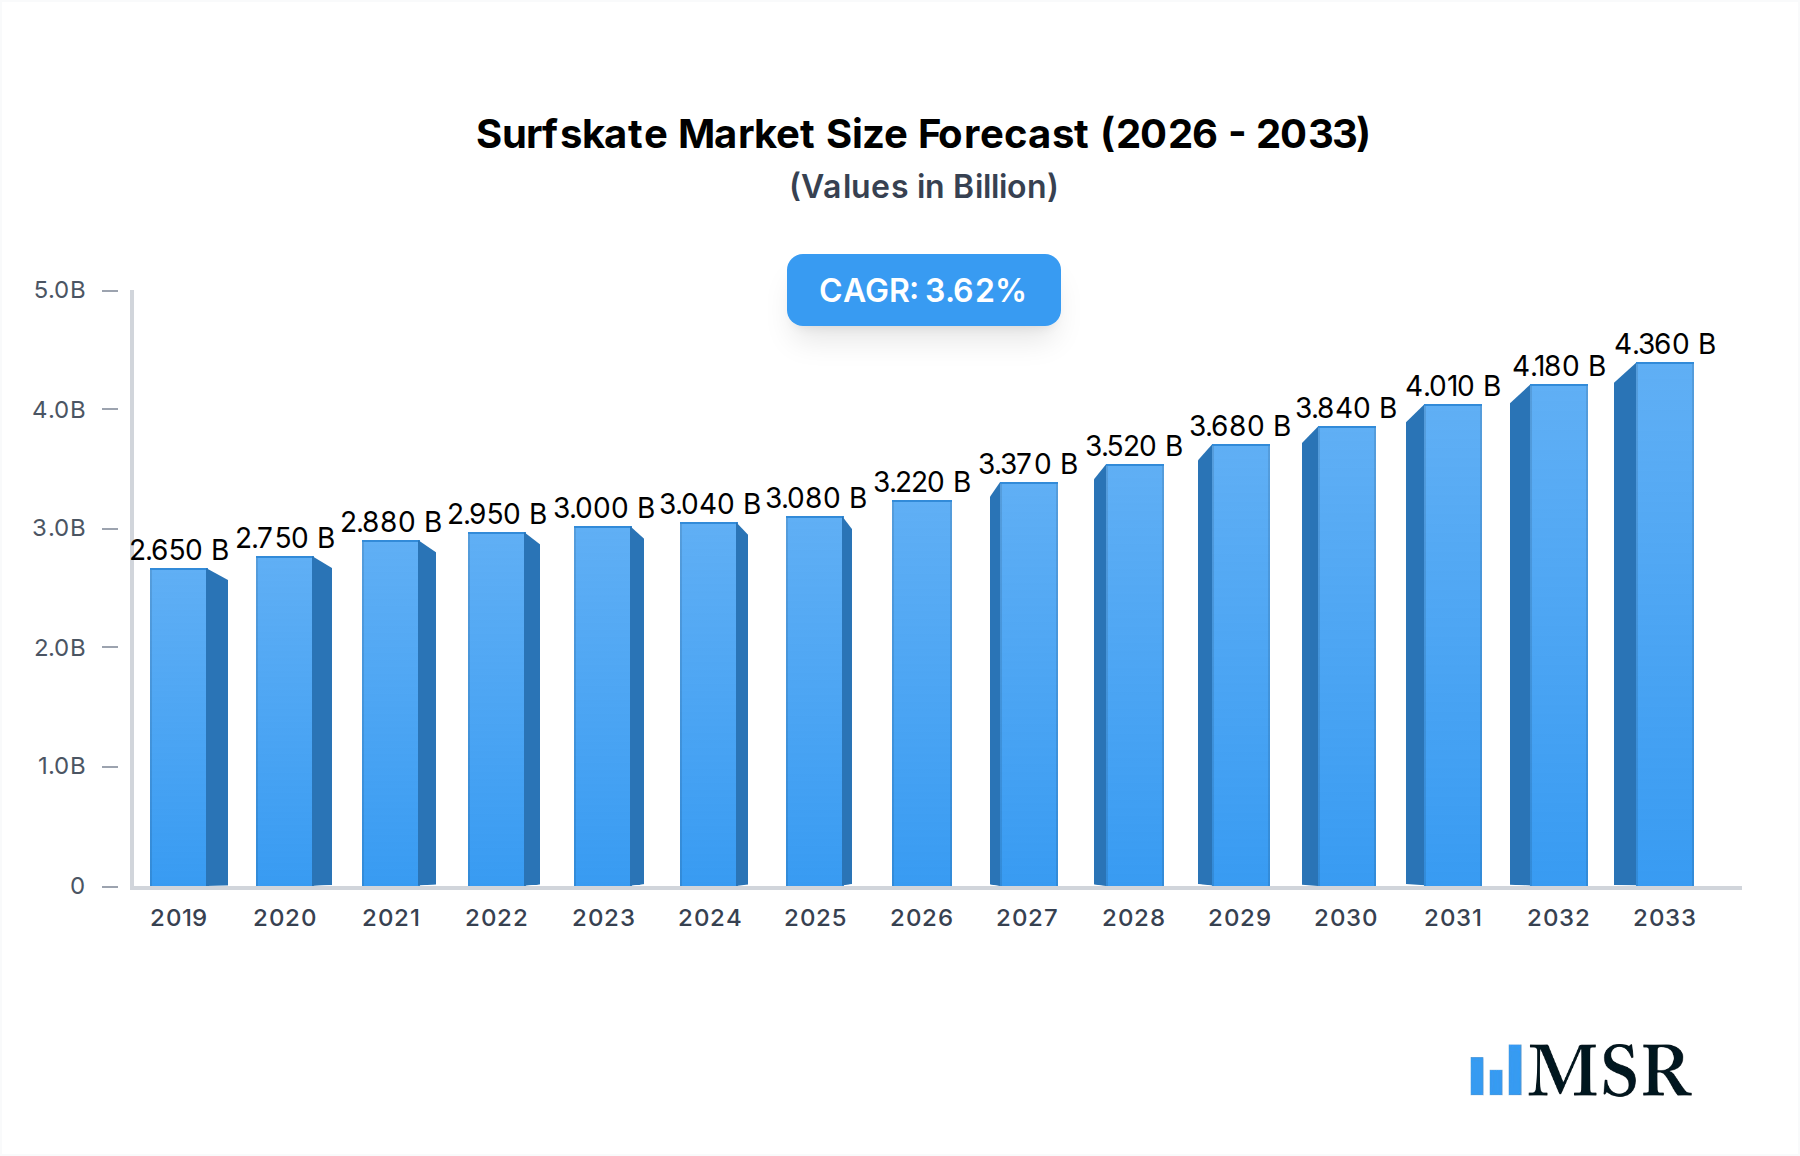
The global surfskate market is poised for significant expansion, projected to reach $3.08 billion by 2025. This growth is fueled by a confluence of factors, including the rising popularity of outdoor recreational activities, the increasing adoption of surfskating as a cross-training tool for surfers, and a growing trend towards active lifestyles among millennials and Gen Z. The market's CAGR of 4.72% from 2025 to 2033 underscores a robust and sustained upward trajectory. The online sales segment is expected to be a primary driver, benefiting from the ease of e-commerce and the widespread availability of diverse product offerings. Geographically, North America and Europe are anticipated to lead in market share, driven by a well-established sporting goods culture and a high disposable income among consumers. The Asia Pacific region, however, presents a substantial growth opportunity, with increasing urbanization and a burgeoning middle class adopting new leisure pursuits.

Surfskate Market Size (In Billion)
The surfskate market encompasses a variety of types, including Spring Bridges, PU Bridges, and others, catering to different riding styles and preferences. Key players like Carver, Slide, and YOW are actively innovating, introducing advanced designs and materials to enhance performance and rider experience. The market's expansion is also supported by increased awareness and accessibility through social media platforms, which showcase the dynamic and engaging nature of surfskating. While the market benefits from strong consumer interest and product innovation, potential restraints could include the economic sensitivity of discretionary spending and the need for accessible and safe training spaces, particularly in densely populated urban areas. Nevertheless, the overall outlook for the surfskate market remains exceptionally positive, driven by its appeal as a fun, accessible, and effective way to enjoy a taste of surfing on land.
Surfskate Company Market Share
This comprehensive surfskate market research report delves into the dynamic landscape of the surfskate industry, providing in-depth analysis and actionable insights for industry stakeholders. Spanning from 2019 to 2033, with a base year of 2025 and a robust forecast period of 2025–2033, this report leverages historical data from 2019–2024 to predict future trajectories. We meticulously examine market concentration, key players, emerging trends, segment dominance, product innovations, challenges, growth drivers, and strategic outlooks, offering a definitive guide for navigating this rapidly expanding market. Discover the billion-dollar opportunities in online sales, offline sales, spring bridge surfskates, PU bridge surfskates, and other crucial segments.
Surfskate Market Concentration & Dynamics
The global surfskate market, while exhibiting significant growth potential, is characterized by a moderately concentrated landscape. Leading players like Carver, Slide, YOW, Smoothstar, SwellTech, Sixty-six, WoodDetail, Globe, Penny, BackWave, and Waterborne are actively shaping market dynamics through continuous innovation and strategic market penetration. The innovation ecosystem thrives on the development of advanced truck systems, particularly the evolution from traditional PU bridge designs to more sophisticated spring bridge mechanisms, enhancing maneuverability and mimicking real surfing sensations. Regulatory frameworks are largely supportive, focusing on safety standards and product quality. Substitute products, such as traditional skateboards and longboards, offer some competition, but the unique surf-like experience of surfskates carves out a distinct niche. End-user trends are heavily influenced by the desire for accessible surfing experiences, urban commuting solutions, and fitness-oriented recreational activities, driving demand across all demographics. Mergers and acquisitions (M&A) activities, while not yet at peak levels, are anticipated to increase as established players seek to consolidate market share and acquire innovative technologies, with an estimated billion in M&A deal value projected for the forecast period. Market share analysis reveals Carver and YOW as key leaders, each commanding an estimated billion in global market share.
Surfskate Industry Insights & Trends
The surfskate industry is poised for exceptional growth, driven by a confluence of factors including the increasing popularity of action sports, the quest for accessible surf training alternatives, and the burgeoning urban mobility trend. The global surfskate market size is estimated to reach an astounding billion by 2033, exhibiting a remarkable Compound Annual Growth Rate (CAGR) of XX% during the 2025–2033 forecast period. Technological disruptions are at the forefront, with continuous advancements in truck geometry, board construction materials, and wheel compounds enhancing performance, durability, and rider experience. The market is witnessing a significant surge in demand for surfskates that offer a more realistic surfing feel, leading to the development of sophisticated suspension systems and responsive turning mechanisms. Evolving consumer behaviors are characterized by a growing appreciation for skill-based sports, a desire for outdoor recreation, and the integration of fitness into daily routines. The online sales channel, in particular, has experienced exponential growth, facilitated by e-commerce platforms and social media marketing. This trend is expected to continue, alongside a resurgence in offline retail experiences as specialized surfskate shops gain prominence. The cultural integration of surfskate culture, amplified by social media influencers and dedicated communities, further fuels market expansion, projecting a market value of billion by the end of 2033.
Key Markets & Segments Leading Surfskate
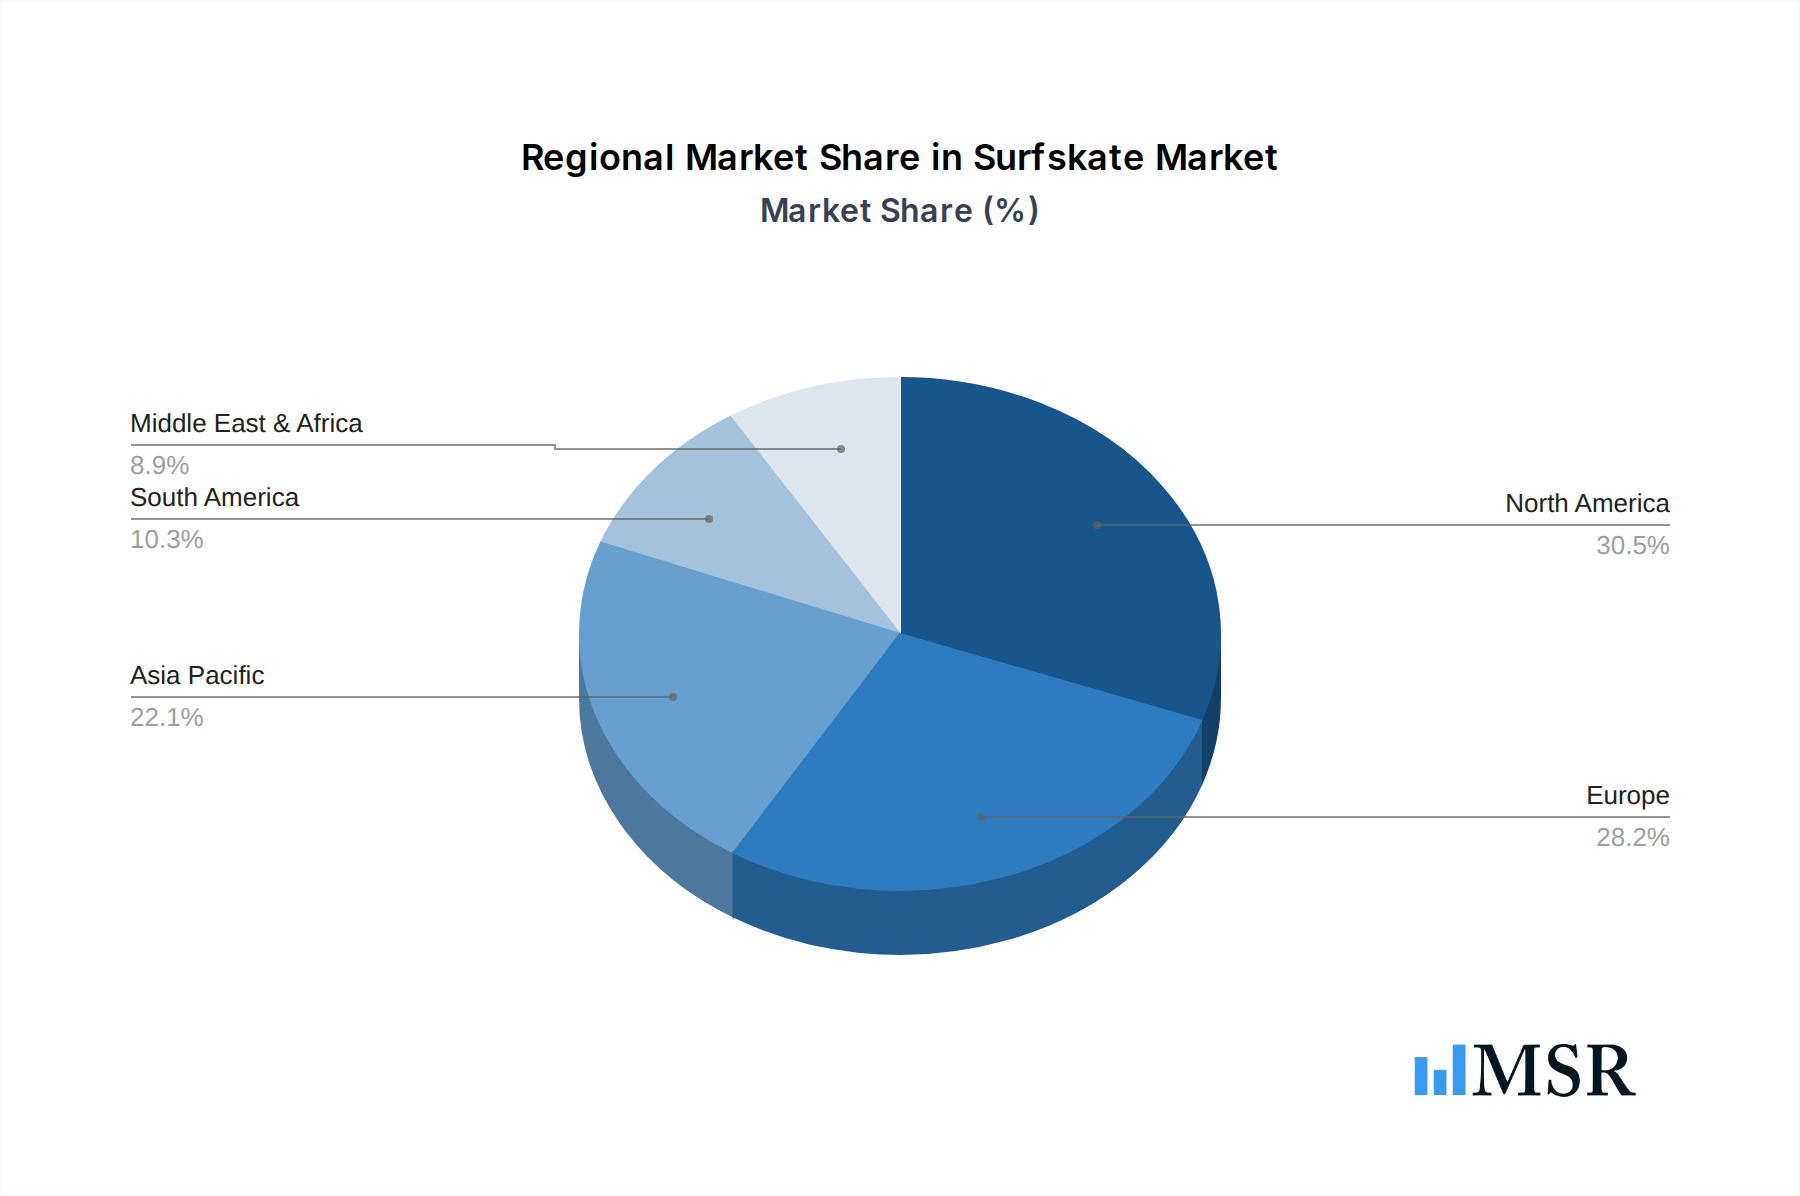
The surfskate market is experiencing robust growth across various geographical regions and product segments. North America, particularly the United States, continues to be a dominant force, driven by a strong surfing culture, high disposable incomes, and a thriving action sports scene. The prevalence of coastal communities and a year-round demand for outdoor activities contribute significantly to this dominance, with estimated market revenue of billion from this region alone.
Application: Online Sales
- Driver: The proliferation of e-commerce platforms and direct-to-consumer (DTC) brand strategies.
- Dominance Analysis: Online sales represent a substantial and rapidly expanding segment, accounting for an estimated billion in revenue. The convenience of purchasing from anywhere, coupled with wider product selection and competitive pricing, makes this channel highly attractive. Social media marketing and influencer collaborations further amplify online reach, driving brand visibility and consumer engagement.
Application: Offline Sales
- Driver: The growing demand for specialized retail experiences and the tactile nature of product selection.
- Dominance Analysis: While online sales are dominant, offline sales retain significant importance, contributing an estimated billion. Brick-and-mortar surf shops, skate parks, and sporting goods stores offer consumers the opportunity to physically interact with surfskates, test ride them, and receive expert advice. This segment is crucial for building brand loyalty and catering to enthusiasts who value personalized service.
Types: Spring Bridge
- Driver: The technological advancement in replicating surf-like pumping and carving.
- Dominance Analysis: Spring bridge surfskates are a key growth driver, projected to capture a market share of XX% by 2033, with an estimated market value of billion. These advanced systems offer superior maneuverability and a more authentic surfing sensation, attracting a dedicated customer base seeking enhanced performance and training capabilities.
Types: PU Bridge
- Driver: Affordability and widespread availability for beginner and casual riders.
- Dominance Analysis: PU bridge surfskates remain a significant segment, estimated at billion, catering to a broad spectrum of users who prioritize accessibility and a more traditional, albeit less responsive, ride. They serve as an entry point for many into the surfskate world, ensuring continued demand.
Types: Other
- Driver: Niche innovations and specialized designs catering to specific user needs.
- Dominance Analysis: The "Other" category, encompassing unique designs and custom builds, represents a growing niche, contributing an estimated billion. This segment highlights the ongoing innovation within the market and the desire for personalized riding experiences.
Surfskate Product Developments
Surfskate product developments are characterized by a relentless pursuit of enhanced performance and authenticity. Innovations in truck systems, such as the evolution of the spring bridge mechanism and advanced pivot designs, are central to mimicking the nuanced movements of surfing. Manufacturers are also exploring lighter, more durable deck materials and specialized wheel compounds to optimize grip and speed. These advancements cater to a growing demand for surfskates that serve not only as recreational tools but also as effective training aids for surfers of all levels, contributing to an estimated market relevance of billion.
Challenges in the Surfskate Market
Despite its promising growth, the surfskate market faces several challenges. Regulatory hurdles related to safety standards and product certifications can impede market entry for new players, with an estimated compliance cost of million per company. Supply chain disruptions, particularly for specialized components and raw materials, can lead to production delays and increased costs, impacting availability and pricing. Intense competitive pressures from both established brands and emerging startups necessitate continuous innovation and aggressive marketing strategies, with an estimated billion spent annually on R&D and marketing. Furthermore, the education gap regarding the unique benefits and proper usage of surfskates can limit broader consumer adoption, requiring significant investment in awareness campaigns.
Forces Driving Surfskate Growth
The surfskate market is propelled by a potent combination of forces. Technological innovation in truck systems, deck design, and material science is paramount, offering riders increasingly realistic and engaging experiences. Economic factors, including rising disposable incomes and a growing interest in outdoor recreational activities, fuel consumer spending. Sociocultural trends such as the surge in popularity of action sports, the desire for alternative fitness solutions, and the influence of social media are creating a strong demand. Furthermore, regulatory support for sports and recreation, coupled with favorable urban planning initiatives that encourage alternative transportation, contribute to the market's upward trajectory. The projected growth is estimated to add billion to the market value by 2033.
Challenges in the Surfskate Market
Long-term growth catalysts for the surfskate market are deeply rooted in continuous innovation, strategic partnerships, and effective market expansion. The development of eco-friendly manufacturing processes and the use of sustainable materials will appeal to an increasingly environmentally conscious consumer base. Strategic alliances between surfskate manufacturers, surf schools, and sports apparel brands can broaden reach and enhance brand credibility. Furthermore, international market expansion, particularly into emerging economies with a burgeoning interest in action sports, presents significant untapped potential. Investing in advanced research and development for improved safety features and enhanced user experience will also be critical for sustained growth, ensuring the market reaches an estimated billion by 2033.
Emerging Opportunities in Surfskate
Emerging opportunities in the surfskate market are diverse and promising. The development of smart surfskates integrated with sensors and tracking capabilities offers a new frontier for data-driven training and performance analysis, potentially adding billion in value. New material technologies, such as advanced composites and sustainable bamboo, can lead to lighter, stronger, and more environmentally friendly boards. The expansion into niche markets, including downhill surfskating, artistic disciplines, and adaptive surfskating for individuals with disabilities, presents unique growth avenues. Furthermore, the increasing demand for personalized and customizable surfskate experiences opens doors for bespoke manufacturing and direct-to-consumer customization platforms.
Leading Players in the Surfskate Sector
- Carver
- Slide
- YOW
- Smoothstar
- SwellTech
- Sixty-six
- WoodDetail
- Globe
- Penny
- BackWave
- Waterborne
Key Milestones in Surfskate Industry
- 2019: Increased adoption of spring-loaded truck systems by major brands, enhancing maneuverability.
- 2020: Surge in online sales driven by lockdowns and increased interest in home-based fitness.
- 2021: Introduction of lighter and more durable deck materials, improving performance.
- 2022: Growing influence of social media influencers promoting surfskate culture globally.
- 2023: Emergence of specialized surfskate training academies and parks.
- 2024: Increased focus on sustainable manufacturing practices within the industry.
Strategic Outlook for Surfskate Market
The strategic outlook for the surfskate market is exceptionally positive, with sustained growth anticipated across all segments. Key growth accelerators include the continued innovation in performance-enhancing technologies, such as advanced suspension systems and lighter materials, estimated to contribute billion in market value. The expansion of online sales channels, supported by direct-to-consumer strategies and robust digital marketing, will remain a critical revenue driver. Furthermore, the increasing integration of surfskates into urban mobility solutions and fitness regimes presents substantial market potential. Strategic partnerships and global market penetration, especially in underserved regions, will be crucial for maximizing future growth, projecting the market to reach an impressive billion by 2033.
Surfskate Segmentation
-
1. Application
- 1.1. Online Sales
- 1.2. Offline Sales
-
2. Types
- 2.1. Spring Bridge
- 2.2. PU Bridge
- 2.3. Other
Surfskate Segmentation By Geography
-
1. North America
- 1.1. United States
- 1.2. Canada
- 1.3. Mexico
-
2. South America
- 2.1. Brazil
- 2.2. Argentina
- 2.3. Rest of South America
-
3. Europe
- 3.1. United Kingdom
- 3.2. Germany
- 3.3. France
- 3.4. Italy
- 3.5. Spain
- 3.6. Russia
- 3.7. Benelux
- 3.8. Nordics
- 3.9. Rest of Europe
-
4. Middle East & Africa
- 4.1. Turkey
- 4.2. Israel
- 4.3. GCC
- 4.4. North Africa
- 4.5. South Africa
- 4.6. Rest of Middle East & Africa
-
5. Asia Pacific
- 5.1. China
- 5.2. India
- 5.3. Japan
- 5.4. South Korea
- 5.5. ASEAN
- 5.6. Oceania
- 5.7. Rest of Asia Pacific
Surfskate Regional Market Share
Geographic Coverage of Surfskate
Surfskate REPORT HIGHLIGHTS
| Aspects | Details |
|---|---|
| Study Period | 2020-2034 |
| Base Year | 2025 |
| Estimated Year | 2026 |
| Forecast Period | 2026-2034 |
| Historical Period | 2020-2025 |
| Growth Rate | CAGR of 2.2% from 2020-2034 |
| Segmentation |
|
Table of Contents
- 1. Introduction
- 1.1. Research Scope
- 1.2. Market Segmentation
- 1.3. Research Objective
- 1.4. Definitions and Assumptions
- 2. Executive Summary
- 2.1. Market Snapshot
- 3. Market Dynamics
- 3.1. Market Drivers
- 3.2. Market Restrains
- 3.3. Market Trends
- 3.4. Market Opportunities
- 4. Market Factor Analysis
- 4.1. Porters Five Forces
- 4.1.1. Bargaining Power of Suppliers
- 4.1.2. Bargaining Power of Buyers
- 4.1.3. Threat of New Entrants
- 4.1.4. Threat of Substitutes
- 4.1.5. Competitive Rivalry
- 4.2. PESTEL analysis
- 4.3. BCG Analysis
- 4.3.1. Stars (High Growth, High Market Share)
- 4.3.2. Cash Cows (Low Growth, High Market Share)
- 4.3.3. Question Mark (High Growth, Low Market Share)
- 4.3.4. Dogs (Low Growth, Low Market Share)
- 4.4. Ansoff Matrix Analysis
- 4.5. Supply Chain Analysis
- 4.6. Regulatory Landscape
- 4.7. Current Market Potential and Opportunity Assessment (TAM–SAM–SOM Framework)
- 4.8. MSR Analyst Note
- 4.1. Porters Five Forces
- 5. Market Analysis, Insights and Forecast 2021-2033
- 5.1. Market Analysis, Insights and Forecast - by Application
- 5.1.1. Online Sales
- 5.1.2. Offline Sales
- 5.2. Market Analysis, Insights and Forecast - by Types
- 5.2.1. Spring Bridge
- 5.2.2. PU Bridge
- 5.2.3. Other
- 5.3. Market Analysis, Insights and Forecast - by Region
- 5.3.1. North America
- 5.3.2. South America
- 5.3.3. Europe
- 5.3.4. Middle East & Africa
- 5.3.5. Asia Pacific
- 5.1. Market Analysis, Insights and Forecast - by Application
- 6. Global Surfskate Analysis, Insights and Forecast, 2021-2033
- 6.1. Market Analysis, Insights and Forecast - by Application
- 6.1.1. Online Sales
- 6.1.2. Offline Sales
- 6.2. Market Analysis, Insights and Forecast - by Types
- 6.2.1. Spring Bridge
- 6.2.2. PU Bridge
- 6.2.3. Other
- 6.1. Market Analysis, Insights and Forecast - by Application
- 7. North America Surfskate Analysis, Insights and Forecast, 2020-2032
- 7.1. Market Analysis, Insights and Forecast - by Application
- 7.1.1. Online Sales
- 7.1.2. Offline Sales
- 7.2. Market Analysis, Insights and Forecast - by Types
- 7.2.1. Spring Bridge
- 7.2.2. PU Bridge
- 7.2.3. Other
- 7.1. Market Analysis, Insights and Forecast - by Application
- 8. South America Surfskate Analysis, Insights and Forecast, 2020-2032
- 8.1. Market Analysis, Insights and Forecast - by Application
- 8.1.1. Online Sales
- 8.1.2. Offline Sales
- 8.2. Market Analysis, Insights and Forecast - by Types
- 8.2.1. Spring Bridge
- 8.2.2. PU Bridge
- 8.2.3. Other
- 8.1. Market Analysis, Insights and Forecast - by Application
- 9. Europe Surfskate Analysis, Insights and Forecast, 2020-2032
- 9.1. Market Analysis, Insights and Forecast - by Application
- 9.1.1. Online Sales
- 9.1.2. Offline Sales
- 9.2. Market Analysis, Insights and Forecast - by Types
- 9.2.1. Spring Bridge
- 9.2.2. PU Bridge
- 9.2.3. Other
- 9.1. Market Analysis, Insights and Forecast - by Application
- 10. Middle East & Africa Surfskate Analysis, Insights and Forecast, 2020-2032
- 10.1. Market Analysis, Insights and Forecast - by Application
- 10.1.1. Online Sales
- 10.1.2. Offline Sales
- 10.2. Market Analysis, Insights and Forecast - by Types
- 10.2.1. Spring Bridge
- 10.2.2. PU Bridge
- 10.2.3. Other
- 10.1. Market Analysis, Insights and Forecast - by Application
- 11. Asia Pacific Surfskate Analysis, Insights and Forecast, 2020-2032
- 11.1. Market Analysis, Insights and Forecast - by Application
- 11.1.1. Online Sales
- 11.1.2. Offline Sales
- 11.2. Market Analysis, Insights and Forecast - by Types
- 11.2.1. Spring Bridge
- 11.2.2. PU Bridge
- 11.2.3. Other
- 11.1. Market Analysis, Insights and Forecast - by Application
- 12. Competitive Analysis
- 12.1. Company Profiles
- 12.1.1 Carver
- 12.1.1.1. Company Overview
- 12.1.1.2. Products
- 12.1.1.3. Company Financials
- 12.1.1.4. SWOT Analysis
- 12.1.2 Slide
- 12.1.2.1. Company Overview
- 12.1.2.2. Products
- 12.1.2.3. Company Financials
- 12.1.2.4. SWOT Analysis
- 12.1.3 YOW
- 12.1.3.1. Company Overview
- 12.1.3.2. Products
- 12.1.3.3. Company Financials
- 12.1.3.4. SWOT Analysis
- 12.1.4 Smoothstar
- 12.1.4.1. Company Overview
- 12.1.4.2. Products
- 12.1.4.3. Company Financials
- 12.1.4.4. SWOT Analysis
- 12.1.5 SwellTech
- 12.1.5.1. Company Overview
- 12.1.5.2. Products
- 12.1.5.3. Company Financials
- 12.1.5.4. SWOT Analysis
- 12.1.6 Sixty-six
- 12.1.6.1. Company Overview
- 12.1.6.2. Products
- 12.1.6.3. Company Financials
- 12.1.6.4. SWOT Analysis
- 12.1.7 WoodDetail
- 12.1.7.1. Company Overview
- 12.1.7.2. Products
- 12.1.7.3. Company Financials
- 12.1.7.4. SWOT Analysis
- 12.1.8 Globe
- 12.1.8.1. Company Overview
- 12.1.8.2. Products
- 12.1.8.3. Company Financials
- 12.1.8.4. SWOT Analysis
- 12.1.9 Penny
- 12.1.9.1. Company Overview
- 12.1.9.2. Products
- 12.1.9.3. Company Financials
- 12.1.9.4. SWOT Analysis
- 12.1.10 BackWave
- 12.1.10.1. Company Overview
- 12.1.10.2. Products
- 12.1.10.3. Company Financials
- 12.1.10.4. SWOT Analysis
- 12.1.11 Waterborne
- 12.1.11.1. Company Overview
- 12.1.11.2. Products
- 12.1.11.3. Company Financials
- 12.1.11.4. SWOT Analysis
- 12.1.1 Carver
- 12.2. Market Entropy
- 12.2.1 Company's Key Areas Served
- 12.2.2 Recent Developments
- 12.3. Company Market Share Analysis 2025
- 12.3.1 Top 5 Companies Market Share Analysis
- 12.3.2 Top 3 Companies Market Share Analysis
- 12.4. List of Potential Customers
- 13. Research Methodology
List of Figures
- Figure 1: Global Surfskate Revenue Breakdown (undefined, %) by Region 2025 & 2033
- Figure 2: Global Surfskate Volume Breakdown (K, %) by Region 2025 & 2033
- Figure 3: North America Surfskate Revenue (undefined), by Application 2025 & 2033
- Figure 4: North America Surfskate Volume (K), by Application 2025 & 2033
- Figure 5: North America Surfskate Revenue Share (%), by Application 2025 & 2033
- Figure 6: North America Surfskate Volume Share (%), by Application 2025 & 2033
- Figure 7: North America Surfskate Revenue (undefined), by Types 2025 & 2033
- Figure 8: North America Surfskate Volume (K), by Types 2025 & 2033
- Figure 9: North America Surfskate Revenue Share (%), by Types 2025 & 2033
- Figure 10: North America Surfskate Volume Share (%), by Types 2025 & 2033
- Figure 11: North America Surfskate Revenue (undefined), by Country 2025 & 2033
- Figure 12: North America Surfskate Volume (K), by Country 2025 & 2033
- Figure 13: North America Surfskate Revenue Share (%), by Country 2025 & 2033
- Figure 14: North America Surfskate Volume Share (%), by Country 2025 & 2033
- Figure 15: South America Surfskate Revenue (undefined), by Application 2025 & 2033
- Figure 16: South America Surfskate Volume (K), by Application 2025 & 2033
- Figure 17: South America Surfskate Revenue Share (%), by Application 2025 & 2033
- Figure 18: South America Surfskate Volume Share (%), by Application 2025 & 2033
- Figure 19: South America Surfskate Revenue (undefined), by Types 2025 & 2033
- Figure 20: South America Surfskate Volume (K), by Types 2025 & 2033
- Figure 21: South America Surfskate Revenue Share (%), by Types 2025 & 2033
- Figure 22: South America Surfskate Volume Share (%), by Types 2025 & 2033
- Figure 23: South America Surfskate Revenue (undefined), by Country 2025 & 2033
- Figure 24: South America Surfskate Volume (K), by Country 2025 & 2033
- Figure 25: South America Surfskate Revenue Share (%), by Country 2025 & 2033
- Figure 26: South America Surfskate Volume Share (%), by Country 2025 & 2033
- Figure 27: Europe Surfskate Revenue (undefined), by Application 2025 & 2033
- Figure 28: Europe Surfskate Volume (K), by Application 2025 & 2033
- Figure 29: Europe Surfskate Revenue Share (%), by Application 2025 & 2033
- Figure 30: Europe Surfskate Volume Share (%), by Application 2025 & 2033
- Figure 31: Europe Surfskate Revenue (undefined), by Types 2025 & 2033
- Figure 32: Europe Surfskate Volume (K), by Types 2025 & 2033
- Figure 33: Europe Surfskate Revenue Share (%), by Types 2025 & 2033
- Figure 34: Europe Surfskate Volume Share (%), by Types 2025 & 2033
- Figure 35: Europe Surfskate Revenue (undefined), by Country 2025 & 2033
- Figure 36: Europe Surfskate Volume (K), by Country 2025 & 2033
- Figure 37: Europe Surfskate Revenue Share (%), by Country 2025 & 2033
- Figure 38: Europe Surfskate Volume Share (%), by Country 2025 & 2033
- Figure 39: Middle East & Africa Surfskate Revenue (undefined), by Application 2025 & 2033
- Figure 40: Middle East & Africa Surfskate Volume (K), by Application 2025 & 2033
- Figure 41: Middle East & Africa Surfskate Revenue Share (%), by Application 2025 & 2033
- Figure 42: Middle East & Africa Surfskate Volume Share (%), by Application 2025 & 2033
- Figure 43: Middle East & Africa Surfskate Revenue (undefined), by Types 2025 & 2033
- Figure 44: Middle East & Africa Surfskate Volume (K), by Types 2025 & 2033
- Figure 45: Middle East & Africa Surfskate Revenue Share (%), by Types 2025 & 2033
- Figure 46: Middle East & Africa Surfskate Volume Share (%), by Types 2025 & 2033
- Figure 47: Middle East & Africa Surfskate Revenue (undefined), by Country 2025 & 2033
- Figure 48: Middle East & Africa Surfskate Volume (K), by Country 2025 & 2033
- Figure 49: Middle East & Africa Surfskate Revenue Share (%), by Country 2025 & 2033
- Figure 50: Middle East & Africa Surfskate Volume Share (%), by Country 2025 & 2033
- Figure 51: Asia Pacific Surfskate Revenue (undefined), by Application 2025 & 2033
- Figure 52: Asia Pacific Surfskate Volume (K), by Application 2025 & 2033
- Figure 53: Asia Pacific Surfskate Revenue Share (%), by Application 2025 & 2033
- Figure 54: Asia Pacific Surfskate Volume Share (%), by Application 2025 & 2033
- Figure 55: Asia Pacific Surfskate Revenue (undefined), by Types 2025 & 2033
- Figure 56: Asia Pacific Surfskate Volume (K), by Types 2025 & 2033
- Figure 57: Asia Pacific Surfskate Revenue Share (%), by Types 2025 & 2033
- Figure 58: Asia Pacific Surfskate Volume Share (%), by Types 2025 & 2033
- Figure 59: Asia Pacific Surfskate Revenue (undefined), by Country 2025 & 2033
- Figure 60: Asia Pacific Surfskate Volume (K), by Country 2025 & 2033
- Figure 61: Asia Pacific Surfskate Revenue Share (%), by Country 2025 & 2033
- Figure 62: Asia Pacific Surfskate Volume Share (%), by Country 2025 & 2033
List of Tables
- Table 1: Global Surfskate Revenue undefined Forecast, by Application 2020 & 2033
- Table 2: Global Surfskate Volume K Forecast, by Application 2020 & 2033
- Table 3: Global Surfskate Revenue undefined Forecast, by Types 2020 & 2033
- Table 4: Global Surfskate Volume K Forecast, by Types 2020 & 2033
- Table 5: Global Surfskate Revenue undefined Forecast, by Region 2020 & 2033
- Table 6: Global Surfskate Volume K Forecast, by Region 2020 & 2033
- Table 7: Global Surfskate Revenue undefined Forecast, by Application 2020 & 2033
- Table 8: Global Surfskate Volume K Forecast, by Application 2020 & 2033
- Table 9: Global Surfskate Revenue undefined Forecast, by Types 2020 & 2033
- Table 10: Global Surfskate Volume K Forecast, by Types 2020 & 2033
- Table 11: Global Surfskate Revenue undefined Forecast, by Country 2020 & 2033
- Table 12: Global Surfskate Volume K Forecast, by Country 2020 & 2033
- Table 13: United States Surfskate Revenue (undefined) Forecast, by Application 2020 & 2033
- Table 14: United States Surfskate Volume (K) Forecast, by Application 2020 & 2033
- Table 15: Canada Surfskate Revenue (undefined) Forecast, by Application 2020 & 2033
- Table 16: Canada Surfskate Volume (K) Forecast, by Application 2020 & 2033
- Table 17: Mexico Surfskate Revenue (undefined) Forecast, by Application 2020 & 2033
- Table 18: Mexico Surfskate Volume (K) Forecast, by Application 2020 & 2033
- Table 19: Global Surfskate Revenue undefined Forecast, by Application 2020 & 2033
- Table 20: Global Surfskate Volume K Forecast, by Application 2020 & 2033
- Table 21: Global Surfskate Revenue undefined Forecast, by Types 2020 & 2033
- Table 22: Global Surfskate Volume K Forecast, by Types 2020 & 2033
- Table 23: Global Surfskate Revenue undefined Forecast, by Country 2020 & 2033
- Table 24: Global Surfskate Volume K Forecast, by Country 2020 & 2033
- Table 25: Brazil Surfskate Revenue (undefined) Forecast, by Application 2020 & 2033
- Table 26: Brazil Surfskate Volume (K) Forecast, by Application 2020 & 2033
- Table 27: Argentina Surfskate Revenue (undefined) Forecast, by Application 2020 & 2033
- Table 28: Argentina Surfskate Volume (K) Forecast, by Application 2020 & 2033
- Table 29: Rest of South America Surfskate Revenue (undefined) Forecast, by Application 2020 & 2033
- Table 30: Rest of South America Surfskate Volume (K) Forecast, by Application 2020 & 2033
- Table 31: Global Surfskate Revenue undefined Forecast, by Application 2020 & 2033
- Table 32: Global Surfskate Volume K Forecast, by Application 2020 & 2033
- Table 33: Global Surfskate Revenue undefined Forecast, by Types 2020 & 2033
- Table 34: Global Surfskate Volume K Forecast, by Types 2020 & 2033
- Table 35: Global Surfskate Revenue undefined Forecast, by Country 2020 & 2033
- Table 36: Global Surfskate Volume K Forecast, by Country 2020 & 2033
- Table 37: United Kingdom Surfskate Revenue (undefined) Forecast, by Application 2020 & 2033
- Table 38: United Kingdom Surfskate Volume (K) Forecast, by Application 2020 & 2033
- Table 39: Germany Surfskate Revenue (undefined) Forecast, by Application 2020 & 2033
- Table 40: Germany Surfskate Volume (K) Forecast, by Application 2020 & 2033
- Table 41: France Surfskate Revenue (undefined) Forecast, by Application 2020 & 2033
- Table 42: France Surfskate Volume (K) Forecast, by Application 2020 & 2033
- Table 43: Italy Surfskate Revenue (undefined) Forecast, by Application 2020 & 2033
- Table 44: Italy Surfskate Volume (K) Forecast, by Application 2020 & 2033
- Table 45: Spain Surfskate Revenue (undefined) Forecast, by Application 2020 & 2033
- Table 46: Spain Surfskate Volume (K) Forecast, by Application 2020 & 2033
- Table 47: Russia Surfskate Revenue (undefined) Forecast, by Application 2020 & 2033
- Table 48: Russia Surfskate Volume (K) Forecast, by Application 2020 & 2033
- Table 49: Benelux Surfskate Revenue (undefined) Forecast, by Application 2020 & 2033
- Table 50: Benelux Surfskate Volume (K) Forecast, by Application 2020 & 2033
- Table 51: Nordics Surfskate Revenue (undefined) Forecast, by Application 2020 & 2033
- Table 52: Nordics Surfskate Volume (K) Forecast, by Application 2020 & 2033
- Table 53: Rest of Europe Surfskate Revenue (undefined) Forecast, by Application 2020 & 2033
- Table 54: Rest of Europe Surfskate Volume (K) Forecast, by Application 2020 & 2033
- Table 55: Global Surfskate Revenue undefined Forecast, by Application 2020 & 2033
- Table 56: Global Surfskate Volume K Forecast, by Application 2020 & 2033
- Table 57: Global Surfskate Revenue undefined Forecast, by Types 2020 & 2033
- Table 58: Global Surfskate Volume K Forecast, by Types 2020 & 2033
- Table 59: Global Surfskate Revenue undefined Forecast, by Country 2020 & 2033
- Table 60: Global Surfskate Volume K Forecast, by Country 2020 & 2033
- Table 61: Turkey Surfskate Revenue (undefined) Forecast, by Application 2020 & 2033
- Table 62: Turkey Surfskate Volume (K) Forecast, by Application 2020 & 2033
- Table 63: Israel Surfskate Revenue (undefined) Forecast, by Application 2020 & 2033
- Table 64: Israel Surfskate Volume (K) Forecast, by Application 2020 & 2033
- Table 65: GCC Surfskate Revenue (undefined) Forecast, by Application 2020 & 2033
- Table 66: GCC Surfskate Volume (K) Forecast, by Application 2020 & 2033
- Table 67: North Africa Surfskate Revenue (undefined) Forecast, by Application 2020 & 2033
- Table 68: North Africa Surfskate Volume (K) Forecast, by Application 2020 & 2033
- Table 69: South Africa Surfskate Revenue (undefined) Forecast, by Application 2020 & 2033
- Table 70: South Africa Surfskate Volume (K) Forecast, by Application 2020 & 2033
- Table 71: Rest of Middle East & Africa Surfskate Revenue (undefined) Forecast, by Application 2020 & 2033
- Table 72: Rest of Middle East & Africa Surfskate Volume (K) Forecast, by Application 2020 & 2033
- Table 73: Global Surfskate Revenue undefined Forecast, by Application 2020 & 2033
- Table 74: Global Surfskate Volume K Forecast, by Application 2020 & 2033
- Table 75: Global Surfskate Revenue undefined Forecast, by Types 2020 & 2033
- Table 76: Global Surfskate Volume K Forecast, by Types 2020 & 2033
- Table 77: Global Surfskate Revenue undefined Forecast, by Country 2020 & 2033
- Table 78: Global Surfskate Volume K Forecast, by Country 2020 & 2033
- Table 79: China Surfskate Revenue (undefined) Forecast, by Application 2020 & 2033
- Table 80: China Surfskate Volume (K) Forecast, by Application 2020 & 2033
- Table 81: India Surfskate Revenue (undefined) Forecast, by Application 2020 & 2033
- Table 82: India Surfskate Volume (K) Forecast, by Application 2020 & 2033
- Table 83: Japan Surfskate Revenue (undefined) Forecast, by Application 2020 & 2033
- Table 84: Japan Surfskate Volume (K) Forecast, by Application 2020 & 2033
- Table 85: South Korea Surfskate Revenue (undefined) Forecast, by Application 2020 & 2033
- Table 86: South Korea Surfskate Volume (K) Forecast, by Application 2020 & 2033
- Table 87: ASEAN Surfskate Revenue (undefined) Forecast, by Application 2020 & 2033
- Table 88: ASEAN Surfskate Volume (K) Forecast, by Application 2020 & 2033
- Table 89: Oceania Surfskate Revenue (undefined) Forecast, by Application 2020 & 2033
- Table 90: Oceania Surfskate Volume (K) Forecast, by Application 2020 & 2033
- Table 91: Rest of Asia Pacific Surfskate Revenue (undefined) Forecast, by Application 2020 & 2033
- Table 92: Rest of Asia Pacific Surfskate Volume (K) Forecast, by Application 2020 & 2033
Frequently Asked Questions
1. What is the projected Compound Annual Growth Rate (CAGR) of the Surfskate?
The projected CAGR is approximately 2.2%.
2. Which companies are prominent players in the Surfskate?
Key companies in the market include Carver, Slide, YOW, Smoothstar, SwellTech, Sixty-six, WoodDetail, Globe, Penny, BackWave, Waterborne.
3. What are the main segments of the Surfskate?
The market segments include Application, Types.
4. Can you provide details about the market size?
The market size is estimated to be USD XXX N/A as of 2022.
5. What are some drivers contributing to market growth?
N/A
6. What are the notable trends driving market growth?
N/A
7. Are there any restraints impacting market growth?
N/A
8. Can you provide examples of recent developments in the market?
N/A
9. What pricing options are available for accessing the report?
Pricing options include single-user, multi-user, and enterprise licenses priced at USD 3950.00, USD 5925.00, and USD 7900.00 respectively.
10. Is the market size provided in terms of value or volume?
The market size is provided in terms of value, measured in N/A and volume, measured in K.
11. Are there any specific market keywords associated with the report?
Yes, the market keyword associated with the report is "Surfskate," which aids in identifying and referencing the specific market segment covered.
12. How do I determine which pricing option suits my needs best?
The pricing options vary based on user requirements and access needs. Individual users may opt for single-user licenses, while businesses requiring broader access may choose multi-user or enterprise licenses for cost-effective access to the report.
13. Are there any additional resources or data provided in the Surfskate report?
While the report offers comprehensive insights, it's advisable to review the specific contents or supplementary materials provided to ascertain if additional resources or data are available.
14. How can I stay updated on further developments or reports in the Surfskate?
To stay informed about further developments, trends, and reports in the Surfskate, consider subscribing to industry newsletters, following relevant companies and organizations, or regularly checking reputable industry news sources and publications.
Methodology
Step 1 - Identification of Relevant Samples Size from Population Database


Step 2 - Approaches for Defining Global Market Size (Value, Volume* & Price*)

Note*: In applicable scenarios
Step 3 - Data Sources
Primary Research
- Web Analytics
- Survey Reports
- Research Institute
- Latest Research Reports
- Opinion Leaders
Secondary Research
- Annual Reports
- White Paper
- Latest Press Release
- Industry Association
- Paid Database
- Investor Presentations

Step 4 - Data Triangulation
Involves using different sources of information in order to increase the validity of a study
These sources are likely to be stakeholders in a program - participants, other researchers, program staff, other community members, and so on.
Then we put all data in single framework & apply various statistical tools to find out the dynamic on the market.
During the analysis stage, feedback from the stakeholder groups would be compared to determine areas of agreement as well as areas of divergence