

Key Insights
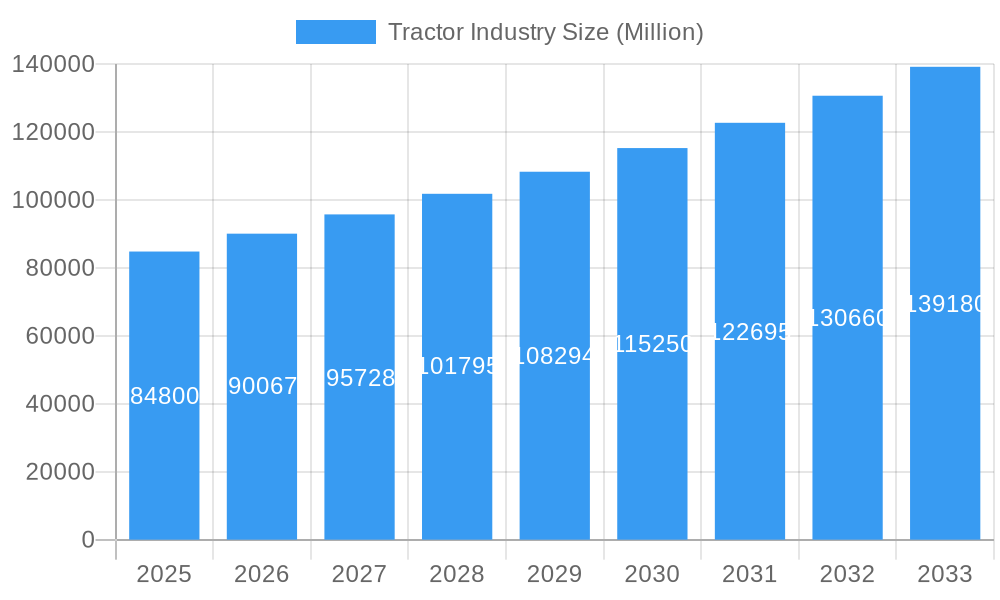
The global tractor market, valued at $84.80 billion in 2025, is projected to experience robust growth, driven by a Compound Annual Growth Rate (CAGR) of 5.90% from 2025 to 2033. This expansion is fueled by several key factors. Increasing agricultural mechanization in developing economies like India and China is a significant driver, as farmers seek to improve efficiency and productivity. Furthermore, advancements in tractor technology, such as the integration of precision farming techniques and automation features, are enhancing operational efficiency and crop yields, stimulating demand. Growth is also being propelled by government initiatives promoting agricultural modernization and increased investment in agricultural infrastructure. The market is segmented by horsepower (below 40 HP, 40-100 HP, above 100 HP) and drive type (two-wheel drive, four-wheel drive/all-wheel drive), with the higher horsepower and four-wheel drive segments expected to witness faster growth due to their suitability for large-scale farming operations. Key players like Escorts Limited, Deere & Company, and Kubota Corporation are continuously innovating and expanding their product portfolios to cater to the evolving needs of the agricultural sector. Regional variations exist, with North America and Europe representing established markets, while Asia-Pacific is demonstrating significant growth potential due to its expanding agricultural sector and rising farmer incomes.
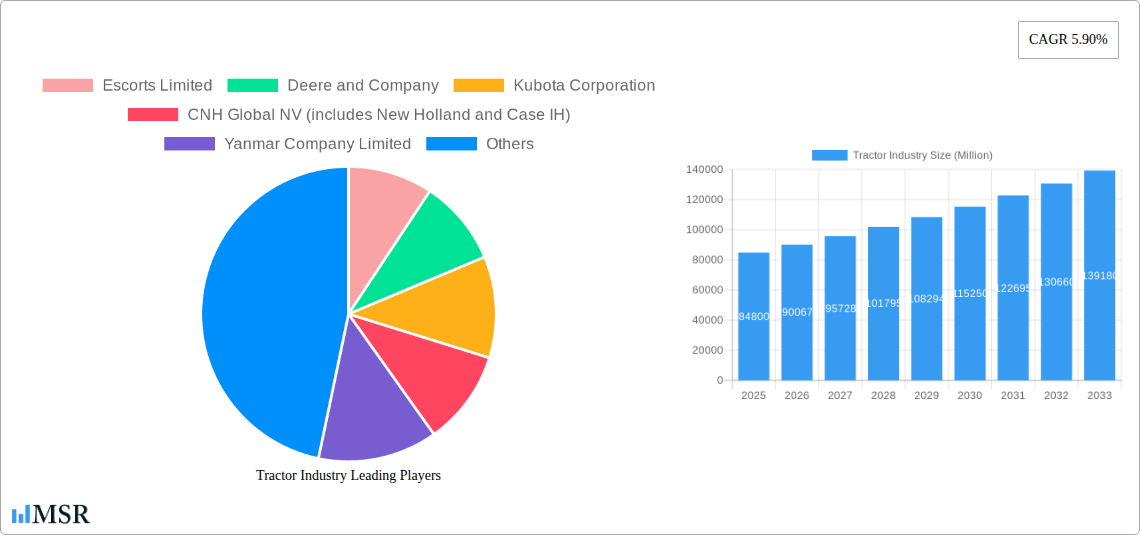
Tractor Industry Market Size (In Billion)
However, the market's growth is not without challenges. Fluctuations in fuel prices and raw material costs pose a significant constraint, impacting tractor manufacturing and operational expenses. Furthermore, environmental concerns related to greenhouse gas emissions from tractors are prompting a shift towards more sustainable and fuel-efficient technologies, necessitating adaptation within the industry. Stricter emission norms in several regions also present regulatory hurdles. Despite these restraints, the overall outlook for the tractor industry remains positive, with continued growth expected throughout the forecast period driven by the aforementioned factors. The increasing global population and rising demand for food security will continue to drive the demand for efficient agricultural machinery, ensuring a promising future for the tractor market.
Tractor Industry Company Market Share
Tractor Industry Market Report: 2019-2033
This comprehensive report provides a detailed analysis of the global tractor industry, encompassing market dynamics, key players, and future growth prospects. With a study period spanning 2019-2033, a base year of 2025, and a forecast period of 2025-2033, this report offers invaluable insights for industry stakeholders, investors, and strategic decision-makers. The global tractor market, valued at xx Million USD in 2024, is projected to reach xx Million USD by 2033, exhibiting a CAGR of xx% during the forecast period.
Tractor Industry Market Concentration & Dynamics
The global tractor market exhibits a moderately concentrated structure, with several multinational corporations holding significant market shares. Key players such as Deere & Company, Mahindra & Mahindra, and CNH Industrial (Case IH and New Holland) dominate the landscape, while regional players like Escorts Limited and TAFE contribute significantly to specific markets. Market share dynamics are influenced by factors such as technological advancements, strategic acquisitions, and evolving agricultural practices. The industry is characterized by a dynamic innovation ecosystem, driven by the need for enhanced efficiency, automation, and sustainability.
- Market Share: Deere & Company holds approximately xx% market share, followed by Mahindra & Mahindra at xx%, and CNH Industrial at xx%. The remaining share is distributed among several regional and smaller players.
- M&A Activity: The past five years have witnessed xx major mergers and acquisitions within the tractor industry, reflecting consolidation efforts and expansion strategies. These deals have primarily focused on strengthening market positions, enhancing technology portfolios, and expanding geographic reach.
- Regulatory Frameworks: Government regulations concerning emission standards, safety, and fuel efficiency significantly impact tractor design and manufacturing. These regulations vary across regions, creating complexities for global players.
- Substitute Products: While tractors remain the primary agricultural machinery, the emergence of autonomous vehicles and precision farming technologies presents potential substitutes in niche applications.
- End-User Trends: The increasing demand for high-efficiency tractors, precision farming solutions, and sustainable agricultural practices drives industry innovation and product development.
Tractor Industry Industry Insights & Trends
The global tractor market is currently experiencing robust expansion, fueled by a confluence of powerful factors. The ever-increasing global demand for food is a primary catalyst, coupled with the accelerated pace of agricultural mechanization, particularly in developing economies. Furthermore, supportive government initiatives aimed at modernizing agricultural practices are significantly contributing to market growth. The industry is also being profoundly reshaped by technological innovations, including the seamless integration of precision farming techniques, advanced automation, and sophisticated data analytics. These advancements are not only creating new avenues for growth but also presenting unique challenges. Moreover, shifts in consumer preferences, such as a growing inclination towards fuel-efficient and technologically advanced tractor models, are actively shaping market dynamics. The agricultural tractor market is anticipated to witness a significant upward trajectory, projected to grow from approximately [Insert XX] Million USD in 2025 to [Insert XX] Million USD by 2033, reflecting sustained momentum.
Key Markets & Segments Leading Tractor Industry
The Asia-Pacific region stands out as the dominant force in the global tractor market, with countries like India and China spearheading this leadership. This dominance is underpinned by their extensive agricultural activities, rising farm incomes, and strong governmental backing for agricultural mechanization. Within specific market segments, the 40 HP - 100 HP category commands the largest market share. This is largely attributable to its exceptional versatility and suitability for a wide spectrum of farming applications. Additionally, four-wheel drive tractors are also securing a substantial market presence, particularly in geographical areas characterized by challenging terrain and demanding agricultural conditions.
-
Key Growth Drivers:
- Economic Prosperity: Escalating disposable incomes and enhanced agricultural productivity directly translate into a higher demand for tractors, bolstering market growth.
- Infrastructure Advancement: Significant improvements in rural infrastructure are enhancing accessibility to agricultural areas, thereby facilitating increased tractor sales and adoption.
- Strategic Government Policies: Proactive government support programs specifically designed to promote agricultural mechanization are proving to be instrumental in driving tractor adoption rates across various regions.
-
Dominance Insights: The 40 HP - 100 HP segment's leadership is a testament to its cost-effectiveness and its broad applicability across diverse agricultural tasks. Four-wheel drive tractors are the preferred choice in regions facing difficult terrain and requiring robust performance for heavy-duty agricultural operations.
Tractor Industry Product Developments
Recent product innovations include the introduction of electric and autonomous tractors, reflecting the industry's focus on sustainability and efficiency. Advanced features such as GPS-guided systems, precision planting capabilities, and data analytics integration enhance operational efficiency and reduce input costs. These developments provide competitive advantages, enabling manufacturers to cater to the evolving needs of modern agriculture.
Challenges in the Tractor Industry Market
Sustaining long-term growth in the tractor industry necessitates a continuous focus on innovation and strategic adaptation. Key to overcoming existing barriers and ensuring continued expansion are the ongoing development of advanced technologies, the cultivation of strategic partnerships to foster collaborative innovation, and the proactive expansion into new geographical markets that exhibit high agricultural potential. Close collaboration between manufacturers, cutting-edge technology providers, and dedicated research institutions is paramount to addressing current challenges and unlocking future opportunities.
Forces Driving Tractor Industry Growth
The tractor industry's growth trajectory is being powerfully propelled by a wave of technological advancements. Innovations such as widespread automation, the sophisticated application of precision farming technologies, and the pioneering development of electric tractors are generating substantial market momentum. Complementing these technological shifts are favorable government policies that actively encourage agricultural mechanization. This supportive policy environment, combined with increasing agricultural output driven by the growing global food demand, is creating a highly conducive market ecosystem. The expanding adoption of precision farming techniques is further amplifying market expansion, signaling a strong future outlook.
Challenges in the Tractor Industry Market
Sustaining long-term growth in the tractor industry necessitates a continuous focus on innovation and strategic adaptation. Key to overcoming existing barriers and ensuring continued expansion are the ongoing development of advanced technologies, the cultivation of strategic partnerships to foster collaborative innovation, and the proactive expansion into new geographical markets that exhibit high agricultural potential. Close collaboration between manufacturers, cutting-edge technology providers, and dedicated research institutions is paramount to addressing current challenges and unlocking future opportunities.
Emerging Opportunities in Tractor Industry
The tractor industry is ripe with emerging opportunities poised to shape its future landscape. The rapidly growing demand for electric and autonomous tractors signifies a major shift towards sustainable and advanced agricultural machinery. Furthermore, the widespread adoption of precision farming solutions and sophisticated data-driven agricultural management systems presents significant potential for enhanced efficiency and productivity. Exploring and developing solutions for untapped markets, particularly in regions like Africa and South America, alongside the creation of tailored machinery to meet specific local agricultural needs, represents substantial growth avenues for forward-thinking companies.
Leading Players in the Tractor Industry Sector
Key Milestones in Tractor Industry Industry
- July 2022: Ashok Leyland introduced the AVTR 4220 and AVTR 4420 tractors, expanding its offerings in the 4x2 segment.
- August 2022: Foxconn partnered with Monarch Tractor to manufacture autonomous tractors and battery packs, indicating a shift towards automation.
- September 2022: KAMAZ PJSC announced plans to expand its range of gas-powered vehicles, highlighting the growing focus on alternative fuels.
- May 2023: CNH Industrial committed USD 50 Million to the Indian farm machinery sector, signifying growing investment in emerging markets.
- October 2023: International Tractors Limited launched the SV Solis electric tractor, a significant development in sustainable agricultural technology.
- March 2024: Hyster Company supplied battery-powered terminal tractors to APM Terminals, reflecting the expansion of electric tractors into non-agricultural sectors.
Strategic Outlook for Tractor Industry Market
The future of the tractor industry is bright, driven by the convergence of technology and agriculture. Continued innovation in automation, electrification, and precision farming will reshape the industry. Strategic partnerships and investments in research and development will be crucial for sustaining long-term growth. Expanding into new markets and adapting to evolving consumer preferences will unlock significant market potential.
Tractor Industry Segmentation
-
1. Horsepower
- 1.1. Below 40 HP
- 1.2. 40 HP - 100 HP
- 1.3. Above 100 HP
-
2. Drive Type
- 2.1. Two-wheel Drive
- 2.2. Four-wheel Drive/All-wheel Drive
Tractor Industry Segmentation By Geography
-
1. North America
- 1.1. United States
- 1.2. Canada
- 1.3. Rest of North America
-
2. Europe
- 2.1. Germany
- 2.2. United Kingdom
- 2.3. France
- 2.4. Spain
- 2.5. Italy
- 2.6. Rest of Europe
-
3. Asia Pacific
- 3.1. China
- 3.2. Japan
- 3.3. India
- 3.4. South Korea
- 3.5. Rest of Asia Pacific
-
4. Rest of the World
- 4.1. South America
- 4.2. Middle East and Africa
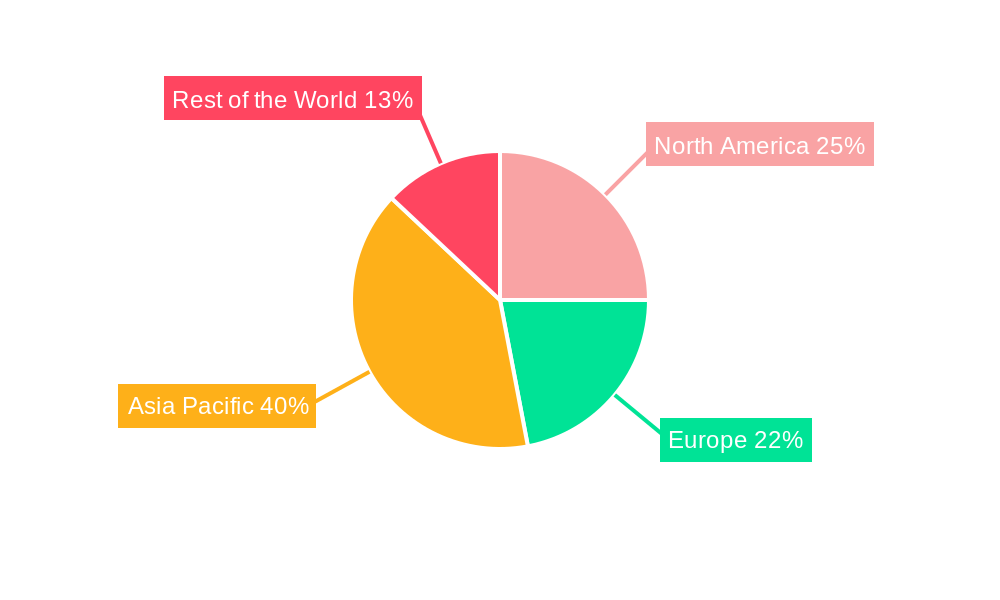
Tractor Industry Regional Market Share
Geographic Coverage of Tractor Industry
Tractor Industry REPORT HIGHLIGHTS
| Aspects | Details |
|---|---|
| Study Period | 2020-2034 |
| Base Year | 2025 |
| Estimated Year | 2026 |
| Forecast Period | 2026-2034 |
| Historical Period | 2020-2025 |
| Growth Rate | CAGR of 5.90% from 2020-2034 |
| Segmentation |
|
Table of Contents
- 1. Introduction
- 1.1. Research Scope
- 1.2. Market Segmentation
- 1.3. Research Objective
- 1.4. Definitions and Assumptions
- 2. Executive Summary
- 2.1. Market Snapshot
- 3. Market Dynamics
- 3.1. Market Drivers
- 3.2. Market Restrains
- 3.3. Market Trends
- 3.4. Market Opportunities
- 4. Market Factor Analysis
- 4.1. Porters Five Forces
- 4.1.1. Bargaining Power of Suppliers
- 4.1.2. Bargaining Power of Buyers
- 4.1.3. Threat of New Entrants
- 4.1.4. Threat of Substitutes
- 4.1.5. Competitive Rivalry
- 4.2. PESTEL analysis
- 4.3. BCG Analysis
- 4.3.1. Stars (High Growth, High Market Share)
- 4.3.2. Cash Cows (Low Growth, High Market Share)
- 4.3.3. Question Mark (High Growth, Low Market Share)
- 4.3.4. Dogs (Low Growth, Low Market Share)
- 4.4. Ansoff Matrix Analysis
- 4.5. Supply Chain Analysis
- 4.6. Regulatory Landscape
- 4.7. Current Market Potential and Opportunity Assessment (TAM–SAM–SOM Framework)
- 4.8. MSR Analyst Note
- 4.1. Porters Five Forces
- 5. Market Analysis, Insights and Forecast 2021-2033
- 5.1. Market Analysis, Insights and Forecast - by Horsepower
- 5.1.1. Below 40 HP
- 5.1.2. 40 HP - 100 HP
- 5.1.3. Above 100 HP
- 5.2. Market Analysis, Insights and Forecast - by Drive Type
- 5.2.1. Two-wheel Drive
- 5.2.2. Four-wheel Drive/All-wheel Drive
- 5.3. Market Analysis, Insights and Forecast - by Region
- 5.3.1. North America
- 5.3.2. Europe
- 5.3.3. Asia Pacific
- 5.3.4. Rest of the World
- 5.1. Market Analysis, Insights and Forecast - by Horsepower
- 6. Global Tractor Industry Analysis, Insights and Forecast, 2021-2033
- 6.1. Market Analysis, Insights and Forecast - by Horsepower
- 6.1.1. Below 40 HP
- 6.1.2. 40 HP - 100 HP
- 6.1.3. Above 100 HP
- 6.2. Market Analysis, Insights and Forecast - by Drive Type
- 6.2.1. Two-wheel Drive
- 6.2.2. Four-wheel Drive/All-wheel Drive
- 6.1. Market Analysis, Insights and Forecast - by Horsepower
- 7. North America Tractor Industry Analysis, Insights and Forecast, 2020-2032
- 7.1. Market Analysis, Insights and Forecast - by Horsepower
- 7.1.1. Below 40 HP
- 7.1.2. 40 HP - 100 HP
- 7.1.3. Above 100 HP
- 7.2. Market Analysis, Insights and Forecast - by Drive Type
- 7.2.1. Two-wheel Drive
- 7.2.2. Four-wheel Drive/All-wheel Drive
- 7.1. Market Analysis, Insights and Forecast - by Horsepower
- 8. Europe Tractor Industry Analysis, Insights and Forecast, 2020-2032
- 8.1. Market Analysis, Insights and Forecast - by Horsepower
- 8.1.1. Below 40 HP
- 8.1.2. 40 HP - 100 HP
- 8.1.3. Above 100 HP
- 8.2. Market Analysis, Insights and Forecast - by Drive Type
- 8.2.1. Two-wheel Drive
- 8.2.2. Four-wheel Drive/All-wheel Drive
- 8.1. Market Analysis, Insights and Forecast - by Horsepower
- 9. Asia Pacific Tractor Industry Analysis, Insights and Forecast, 2020-2032
- 9.1. Market Analysis, Insights and Forecast - by Horsepower
- 9.1.1. Below 40 HP
- 9.1.2. 40 HP - 100 HP
- 9.1.3. Above 100 HP
- 9.2. Market Analysis, Insights and Forecast - by Drive Type
- 9.2.1. Two-wheel Drive
- 9.2.2. Four-wheel Drive/All-wheel Drive
- 9.1. Market Analysis, Insights and Forecast - by Horsepower
- 10. Rest of the World Tractor Industry Analysis, Insights and Forecast, 2020-2032
- 10.1. Market Analysis, Insights and Forecast - by Horsepower
- 10.1.1. Below 40 HP
- 10.1.2. 40 HP - 100 HP
- 10.1.3. Above 100 HP
- 10.2. Market Analysis, Insights and Forecast - by Drive Type
- 10.2.1. Two-wheel Drive
- 10.2.2. Four-wheel Drive/All-wheel Drive
- 10.1. Market Analysis, Insights and Forecast - by Horsepower
- 11. Competitive Analysis
- 11.1. Company Profiles
- 11.1.1 Escorts Limited
- 11.1.1.1. Company Overview
- 11.1.1.2. Products
- 11.1.1.3. Company Financials
- 11.1.1.4. SWOT Analysis
- 11.1.2 Deere and Company
- 11.1.2.1. Company Overview
- 11.1.2.2. Products
- 11.1.2.3. Company Financials
- 11.1.2.4. SWOT Analysis
- 11.1.3 Kubota Corporation
- 11.1.3.1. Company Overview
- 11.1.3.2. Products
- 11.1.3.3. Company Financials
- 11.1.3.4. SWOT Analysis
- 11.1.4 CNH Global NV (includes New Holland and Case IH)
- 11.1.4.1. Company Overview
- 11.1.4.2. Products
- 11.1.4.3. Company Financials
- 11.1.4.4. SWOT Analysis
- 11.1.5 Yanmar Company Limited
- 11.1.5.1. Company Overview
- 11.1.5.2. Products
- 11.1.5.3. Company Financials
- 11.1.5.4. SWOT Analysis
- 11.1.6 Kuhn Group (Subsidiary of Bucher Industries)
- 11.1.6.1. Company Overview
- 11.1.6.2. Products
- 11.1.6.3. Company Financials
- 11.1.6.4. SWOT Analysis
- 11.1.7 Deutz-Fah
- 11.1.7.1. Company Overview
- 11.1.7.2. Products
- 11.1.7.3. Company Financials
- 11.1.7.4. SWOT Analysis
- 11.1.8 Mahindra and Mahindra Corporation
- 11.1.8.1. Company Overview
- 11.1.8.2. Products
- 11.1.8.3. Company Financials
- 11.1.8.4. SWOT Analysis
- 11.1.9 CLAAS KGaA mbH
- 11.1.9.1. Company Overview
- 11.1.9.2. Products
- 11.1.9.3. Company Financials
- 11.1.9.4. SWOT Analysis
- 11.1.10 Tractors and Farm Equipment Limited (TAFE)
- 11.1.10.1. Company Overview
- 11.1.10.2. Products
- 11.1.10.3. Company Financials
- 11.1.10.4. SWOT Analysis
- 11.1.11 AGCO Corporation (includes Massey Ferguson Valtra Fendt and Challenger)
- 11.1.11.1. Company Overview
- 11.1.11.2. Products
- 11.1.11.3. Company Financials
- 11.1.11.4. SWOT Analysis
- 11.1.1 Escorts Limited
- 11.2. Market Entropy
- 11.2.1 Company's Key Areas Served
- 11.2.2 Recent Developments
- 11.3. Company Market Share Analysis 2025
- 11.3.1 Top 5 Companies Market Share Analysis
- 11.3.2 Top 3 Companies Market Share Analysis
- 11.4. List of Potential Customers
- 12. Research Methodology
List of Figures
- Figure 1: Global Tractor Industry Revenue Breakdown (Million, %) by Region 2025 & 2033
- Figure 2: North America Tractor Industry Revenue (Million), by Horsepower 2025 & 2033
- Figure 3: North America Tractor Industry Revenue Share (%), by Horsepower 2025 & 2033
- Figure 4: North America Tractor Industry Revenue (Million), by Drive Type 2025 & 2033
- Figure 5: North America Tractor Industry Revenue Share (%), by Drive Type 2025 & 2033
- Figure 6: North America Tractor Industry Revenue (Million), by Country 2025 & 2033
- Figure 7: North America Tractor Industry Revenue Share (%), by Country 2025 & 2033
- Figure 8: Europe Tractor Industry Revenue (Million), by Horsepower 2025 & 2033
- Figure 9: Europe Tractor Industry Revenue Share (%), by Horsepower 2025 & 2033
- Figure 10: Europe Tractor Industry Revenue (Million), by Drive Type 2025 & 2033
- Figure 11: Europe Tractor Industry Revenue Share (%), by Drive Type 2025 & 2033
- Figure 12: Europe Tractor Industry Revenue (Million), by Country 2025 & 2033
- Figure 13: Europe Tractor Industry Revenue Share (%), by Country 2025 & 2033
- Figure 14: Asia Pacific Tractor Industry Revenue (Million), by Horsepower 2025 & 2033
- Figure 15: Asia Pacific Tractor Industry Revenue Share (%), by Horsepower 2025 & 2033
- Figure 16: Asia Pacific Tractor Industry Revenue (Million), by Drive Type 2025 & 2033
- Figure 17: Asia Pacific Tractor Industry Revenue Share (%), by Drive Type 2025 & 2033
- Figure 18: Asia Pacific Tractor Industry Revenue (Million), by Country 2025 & 2033
- Figure 19: Asia Pacific Tractor Industry Revenue Share (%), by Country 2025 & 2033
- Figure 20: Rest of the World Tractor Industry Revenue (Million), by Horsepower 2025 & 2033
- Figure 21: Rest of the World Tractor Industry Revenue Share (%), by Horsepower 2025 & 2033
- Figure 22: Rest of the World Tractor Industry Revenue (Million), by Drive Type 2025 & 2033
- Figure 23: Rest of the World Tractor Industry Revenue Share (%), by Drive Type 2025 & 2033
- Figure 24: Rest of the World Tractor Industry Revenue (Million), by Country 2025 & 2033
- Figure 25: Rest of the World Tractor Industry Revenue Share (%), by Country 2025 & 2033
List of Tables
- Table 1: Global Tractor Industry Revenue Million Forecast, by Horsepower 2020 & 2033
- Table 2: Global Tractor Industry Revenue Million Forecast, by Drive Type 2020 & 2033
- Table 3: Global Tractor Industry Revenue Million Forecast, by Region 2020 & 2033
- Table 4: Global Tractor Industry Revenue Million Forecast, by Horsepower 2020 & 2033
- Table 5: Global Tractor Industry Revenue Million Forecast, by Drive Type 2020 & 2033
- Table 6: Global Tractor Industry Revenue Million Forecast, by Country 2020 & 2033
- Table 7: United States Tractor Industry Revenue (Million) Forecast, by Application 2020 & 2033
- Table 8: Canada Tractor Industry Revenue (Million) Forecast, by Application 2020 & 2033
- Table 9: Rest of North America Tractor Industry Revenue (Million) Forecast, by Application 2020 & 2033
- Table 10: Global Tractor Industry Revenue Million Forecast, by Horsepower 2020 & 2033
- Table 11: Global Tractor Industry Revenue Million Forecast, by Drive Type 2020 & 2033
- Table 12: Global Tractor Industry Revenue Million Forecast, by Country 2020 & 2033
- Table 13: Germany Tractor Industry Revenue (Million) Forecast, by Application 2020 & 2033
- Table 14: United Kingdom Tractor Industry Revenue (Million) Forecast, by Application 2020 & 2033
- Table 15: France Tractor Industry Revenue (Million) Forecast, by Application 2020 & 2033
- Table 16: Spain Tractor Industry Revenue (Million) Forecast, by Application 2020 & 2033
- Table 17: Italy Tractor Industry Revenue (Million) Forecast, by Application 2020 & 2033
- Table 18: Rest of Europe Tractor Industry Revenue (Million) Forecast, by Application 2020 & 2033
- Table 19: Global Tractor Industry Revenue Million Forecast, by Horsepower 2020 & 2033
- Table 20: Global Tractor Industry Revenue Million Forecast, by Drive Type 2020 & 2033
- Table 21: Global Tractor Industry Revenue Million Forecast, by Country 2020 & 2033
- Table 22: China Tractor Industry Revenue (Million) Forecast, by Application 2020 & 2033
- Table 23: Japan Tractor Industry Revenue (Million) Forecast, by Application 2020 & 2033
- Table 24: India Tractor Industry Revenue (Million) Forecast, by Application 2020 & 2033
- Table 25: South Korea Tractor Industry Revenue (Million) Forecast, by Application 2020 & 2033
- Table 26: Rest of Asia Pacific Tractor Industry Revenue (Million) Forecast, by Application 2020 & 2033
- Table 27: Global Tractor Industry Revenue Million Forecast, by Horsepower 2020 & 2033
- Table 28: Global Tractor Industry Revenue Million Forecast, by Drive Type 2020 & 2033
- Table 29: Global Tractor Industry Revenue Million Forecast, by Country 2020 & 2033
- Table 30: South America Tractor Industry Revenue (Million) Forecast, by Application 2020 & 2033
- Table 31: Middle East and Africa Tractor Industry Revenue (Million) Forecast, by Application 2020 & 2033
Frequently Asked Questions
1. What is the projected Compound Annual Growth Rate (CAGR) of the Tractor Industry?
The projected CAGR is approximately 5.90%.
2. Which companies are prominent players in the Tractor Industry?
Key companies in the market include Escorts Limited, Deere and Company, Kubota Corporation, CNH Global NV (includes New Holland and Case IH), Yanmar Company Limited, Kuhn Group (Subsidiary of Bucher Industries), Deutz-Fah, Mahindra and Mahindra Corporation, CLAAS KGaA mbH, Tractors and Farm Equipment Limited (TAFE), AGCO Corporation (includes Massey Ferguson Valtra Fendt and Challenger).
3. What are the main segments of the Tractor Industry?
The market segments include Horsepower, Drive Type.
4. Can you provide details about the market size?
The market size is estimated to be USD 84.80 Million as of 2022.
5. What are some drivers contributing to market growth?
Rising Residential Activities in Addition to Consumer Spending to Enhance Market Demand.
6. What are the notable trends driving market growth?
The Below 40 HP Tractors Segment's Growth is Expected to be Bolstered over the Next Five Years.
7. Are there any restraints impacting market growth?
Rising Electric Vehicle Adoption to Hinder Market Growth in the Long Run.
8. Can you provide examples of recent developments in the market?
March 2024: Hyster Company announced an agreement to provide APM Terminals with 10 battery-powered terminal tractors for their location at the Port of Mobile in Alabama. The electric terminal tractors, which are scheduled to be delivered in 2024, are part of a USD 60 million investment in port equipment electrification pilots by APM Terminals.
9. What pricing options are available for accessing the report?
Pricing options include single-user, multi-user, and enterprise licenses priced at USD 4750, USD 5250, and USD 8750 respectively.
10. Is the market size provided in terms of value or volume?
The market size is provided in terms of value, measured in Million.
11. Are there any specific market keywords associated with the report?
Yes, the market keyword associated with the report is "Tractor Industry," which aids in identifying and referencing the specific market segment covered.
12. How do I determine which pricing option suits my needs best?
The pricing options vary based on user requirements and access needs. Individual users may opt for single-user licenses, while businesses requiring broader access may choose multi-user or enterprise licenses for cost-effective access to the report.
13. Are there any additional resources or data provided in the Tractor Industry report?
While the report offers comprehensive insights, it's advisable to review the specific contents or supplementary materials provided to ascertain if additional resources or data are available.
14. How can I stay updated on further developments or reports in the Tractor Industry?
To stay informed about further developments, trends, and reports in the Tractor Industry, consider subscribing to industry newsletters, following relevant companies and organizations, or regularly checking reputable industry news sources and publications.
Methodology
Step 1 - Identification of Relevant Samples Size from Population Database


Step 2 - Approaches for Defining Global Market Size (Value, Volume* & Price*)

Note*: In applicable scenarios
Step 3 - Data Sources
Primary Research
- Web Analytics
- Survey Reports
- Research Institute
- Latest Research Reports
- Opinion Leaders
Secondary Research
- Annual Reports
- White Paper
- Latest Press Release
- Industry Association
- Paid Database
- Investor Presentations

Step 4 - Data Triangulation
Involves using different sources of information in order to increase the validity of a study
These sources are likely to be stakeholders in a program - participants, other researchers, program staff, other community members, and so on.
Then we put all data in single framework & apply various statistical tools to find out the dynamic on the market.
During the analysis stage, feedback from the stakeholder groups would be compared to determine areas of agreement as well as areas of divergence