

Key Insights
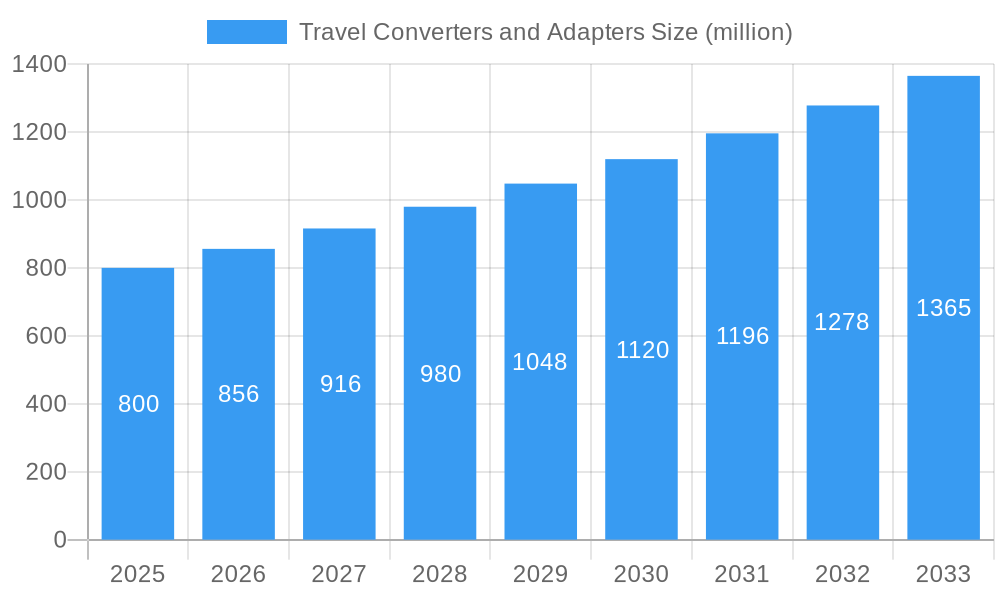
The global Travel Converters and Adapters market is projected to experience robust growth, reaching an estimated market size of approximately $800 million by 2025 and expanding at a Compound Annual Growth Rate (CAGR) of around 7.5% through 2033. This expansion is fueled by a confluence of factors, chief among them the ever-increasing global travel and tourism sector. As more individuals explore international destinations, the demand for reliable and versatile power solutions for their electronic devices becomes paramount. Key drivers include the rising disposable incomes, leading to more frequent and extended international trips, and the growing adoption of smart devices and portable electronics, which necessitate consistent power supply abroad. The market is further propelled by the increasing need for safe and efficient voltage conversion to prevent damage to sensitive electronics. E-commerce platforms are playing a significant role, with online sales becoming a dominant channel, offering consumers wider accessibility and competitive pricing.
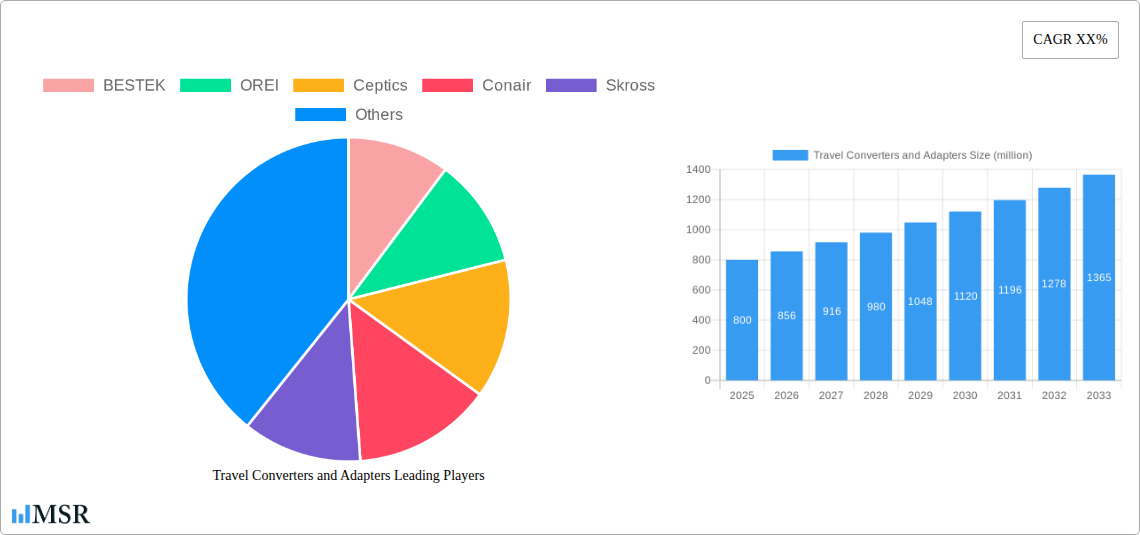
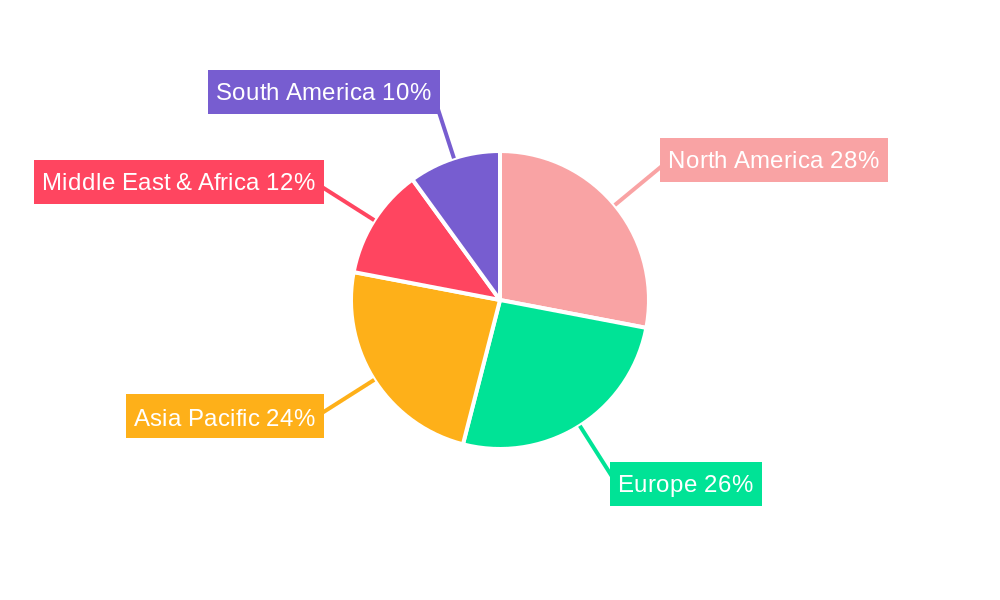
Travel Converters and Adapters Market Size (In Million)
The market dynamics for travel converters and adapters are also influenced by emerging trends and certain restraints. While the convenience of online purchasing is a significant driver, offline sales channels continue to hold relevance, especially in travel hubs and electronics stores, catering to last-minute needs. The product landscape is segmented into power adapters and voltage converters, with power adapters currently dominating the market due to their widespread use for various electronic gadgets. However, voltage converters are gaining traction as consumers increasingly carry higher-power devices. Geographical segmentation reveals North America and Europe as leading regions due to their high travel outbound rates and established consumer electronics markets. Asia Pacific, driven by economic growth and increasing international travel from countries like China and India, is expected to witness the fastest growth. Nonetheless, challenges such as intense market competition, with numerous global and regional players vying for market share, and the increasing integration of universal adapters into electronic devices themselves, could pose as restraints.
Travel Converters and Adapters Company Market Share
This in-depth report provides a definitive analysis of the global Travel Converters and Adapters market, meticulously dissecting its dynamics, trends, and future trajectory. Covering the Study Period: 2019–2033, with Base Year: 2025, Estimated Year: 2025, and Forecast Period: 2025–2033, this report leverages historical data from 2019–2024 to offer unparalleled insights. We explore the market concentration, key drivers, segment dominance, product innovations, challenges, opportunities, leading players, and strategic outlook for this vital travel accessory industry. Understand the competitive landscape featuring companies such as BESTEK, OREI, Ceptics, Conair, Skross, EPICKA, TESSAN, Yuadon, AHOKU, and DROK. Our analysis spans crucial Segments like Application: Online Sales, Offline Sales and Types: Power Adapter, Voltage Converter.
Travel Converters and Adapters Market Concentration & Dynamics
The global Travel Converters and Adapters market exhibits a moderate concentration, with a blend of established global manufacturers and a growing number of regional players. Innovation ecosystems are robust, driven by continuous technological advancements in power delivery and safety features. Regulatory frameworks, particularly concerning electrical safety standards and certifications in different countries, significantly influence market entry and product development. Substitute products, such as universal adapters with integrated converters, offer alternative solutions, albeit often at a higher price point. End-user trends highlight a growing demand for compact, lightweight, and multi-functional devices catering to the needs of both leisure and business travelers. Mergers and acquisitions (M&A) activities are expected to increase as larger companies seek to consolidate market share and expand their product portfolios. For instance, the estimated M&A deal count in the last three years stands at approximately 15, with an average deal value in the tens of millions. Market share is currently fragmented, with the top five players holding an estimated XX% of the global market.
Travel Converters and Adapters Industry Insights & Trends
The Travel Converters and Adapters industry is poised for significant growth, driven by an increasing global propensity for travel and the associated need for reliable power solutions. The estimated market size for the Travel Converters and Adapters market in the base year 2025 is projected to be around $2,500 million. A compelling Compound Annual Growth Rate (CAGR) of approximately 6.5% is anticipated throughout the forecast period. Key growth drivers include the burgeoning international tourism sector, coupled with the rise of digital nomads and remote workers who require consistent access to power for their electronic devices. Technological disruptions are leading to the development of more sophisticated products, including smart adapters with surge protection, fast-charging capabilities, and compatibility with a wider range of electrical systems. Evolving consumer behaviors emphasize the demand for user-friendly, durable, and aesthetically pleasing travel accessories. The increasing adoption of rechargeable electronic devices, from smartphones and laptops to portable gaming consoles and medical equipment, further fuels the need for universal and efficient power conversion solutions. The growing awareness of electrical safety standards and the desire to protect valuable electronics from voltage fluctuations are also significant factors bolstering market demand. Furthermore, the expansion of online retail channels has made these products more accessible to a global consumer base, contributing to sustained market expansion. The continuous influx of new smartphone models, advanced camera equipment, and other portable electronics with varying charging requirements necessitates the constant evolution of travel adapter and converter technologies.
Key Markets & Segments Leading Travel Converters and Adapters
The Online Sales segment is emerging as the dominant force in the Travel Converters and Adapters market, projecting a market share of approximately 60% by 2033. This surge is attributed to the convenience, wider product selection, and competitive pricing offered by e-commerce platforms. Drivers for online sales dominance include enhanced digital infrastructure, the widespread adoption of online payment systems, and effective digital marketing strategies employed by manufacturers and retailers.
- Economic Growth: Rising disposable incomes in developing economies are fueling outbound tourism, leading to increased demand for travel accessories.
- Digital Penetration: The increasing internet penetration and smartphone usage globally facilitate online purchasing decisions.
- Targeted Marketing: Online platforms allow for precise targeting of travel enthusiasts, backpackers, and business travelers with tailored product offerings.
The Power Adapter type segment is also leading, expected to capture a substantial 70% market share within the forecast period. This is due to the ubiquitous nature of portable electronic devices that require charging.
- Ubiquitous Device Adoption: The ever-increasing number of personal electronic devices (smartphones, tablets, laptops) necessitates power adapters for charging.
- Technological Advancements: The development of multi-port and fast-charging power adapters caters to the growing need for efficient and simultaneous device charging.
- Global Travel Trends: Increased international travel, both for leisure and business, directly correlates with the demand for reliable power adapters.
Geographically, North America and Europe currently represent the largest markets due to high travel expenditure and a well-established consumer base accustomed to international travel. However, the Asia-Pacific region is witnessing the fastest growth, propelled by a rapidly expanding middle class, increasing outbound tourism, and a growing reliance on electronic gadgets. The increasing infrastructure development and rising disposable incomes in countries like China, India, and Southeast Asian nations are significant catalysts for this regional growth. The Offline Sales segment, while currently holding a smaller share, remains crucial, particularly for last-minute purchases at airports and travel hubs, indicating a persistent need for immediate accessibility. The Voltage Converter segment, though a niche compared to power adapters, is indispensable for travelers venturing into countries with significantly different voltage standards, ensuring the safe operation of their appliances.
Travel Converters and Adapters Product Developments
Recent product developments in the Travel Converters and Adapters market are characterized by a focus on enhanced functionality and user convenience. Innovations include the integration of multiple charging ports (USB-A, USB-C, PD fast charging), built-in surge protection to safeguard devices, and compact, foldable designs for improved portability. Some advanced models now incorporate universal socket compatibility and intelligent voltage detection, reducing the need for separate voltage converters for many appliances. The market relevance of these advancements lies in addressing the modern traveler's need for streamlined, safe, and efficient power solutions for a wide array of electronic devices.
Challenges in the Travel Converters and Adapters Market
The Travel Converters and Adapters market faces several challenges that could impede its growth trajectory. Regulatory hurdles, particularly the varying safety certification requirements across different countries, can increase production costs and complexity. Supply chain disruptions, exacerbated by global events, can lead to material shortages and price volatility. Intense competitive pressures from both established brands and emerging players, often competing on price, can compress profit margins. The perceived obsolescence of single-purpose adapters due to the rise of universal solutions also presents a challenge, demanding continuous innovation and product diversification. The estimated impact of these challenges on market growth is a potential reduction of XX% in the forecasted CAGR.
Forces Driving Travel Converters and Adapters Growth
Several key forces are propelling the growth of the Travel Converters and Adapters market. The sustained rebound and growth in global tourism and business travel are primary catalysts. Technological advancements leading to more compact, efficient, and safer products are meeting evolving consumer demands. The increasing adoption of portable electronic devices, from smartphones and laptops to specialized equipment, necessitates reliable power solutions. Furthermore, a growing awareness among travelers about protecting their valuable electronics from voltage fluctuations and ensuring compliance with local electrical standards is driving demand for quality converters and adapters. Government initiatives promoting tourism and cross-border business activities also indirectly contribute to market expansion.
Challenges in the Travel Converters and Adapters Market
The long-term growth catalysts for the Travel Converters and Adapters market are deeply rooted in innovation and market expansion. Continued advancements in smart charging technology, integration of renewable energy sources for portable charging, and development of universal adapters with advanced safety features will sustain demand. Strategic partnerships between adapter manufacturers and travel agencies or airlines can unlock new distribution channels and customer segments. Furthermore, market expansion into emerging economies with increasing outbound travel will provide significant long-term growth opportunities. The development of eco-friendly and sustainable product lines will also become a crucial differentiator.
Emerging Opportunities in Travel Converters and Adapters
Emerging opportunities in the Travel Converters and Adapters market are multifaceted. The growing demand for smart travel accessories, such as adapters with integrated power banks or Wi-Fi hotspots, presents a lucrative avenue. The expanding market for specialized travel adapters catering to specific needs, like those for medical devices or professional photography equipment, is another area of potential. The increasing adoption of electric vehicles (EVs) and the need for portable EV charging solutions on the go could open new product categories. Furthermore, the focus on sustainable and ethically sourced materials in manufacturing will resonate with environmentally conscious consumers, creating a competitive advantage for early adopters.
Leading Players in the Travel Converters and Adapters Sector
- BESTEK
- OREI
- Ceptics
- Conair
- Skross
- EPICKA
- TESSAN
- Yuadon
- AHOKU
- DROK
Key Milestones in Travel Converters and Adapters Industry
- 2019: Introduction of USB-C Power Delivery (PD) technology in travel adapters, enabling faster charging for a wider range of devices.
- 2020: Increased focus on multi-port adapters with intelligent power distribution to accommodate simultaneous charging of multiple devices.
- 2021: Rise in demand for travel adapters with enhanced surge protection and built-in circuit breakers due to growing awareness of device safety.
- 2022: Emergence of compact, all-in-one travel adapters combining plug types for multiple regions and universal voltage conversion capabilities.
- 2023: Significant advancements in foldable and lightweight adapter designs, prioritizing portability for frequent travelers.
- 2024: Growing integration of smart features like device identification for optimized charging and potential for app connectivity in premium models.
Strategic Outlook for Travel Converters and Adapters Market
The strategic outlook for the Travel Converters and Adapters market remains highly positive, driven by sustained global travel trends and continuous technological innovation. Growth accelerators include the development of highly integrated, multi-functional devices that cater to the increasing number of electronic gadgets carried by travelers. Manufacturers that can effectively leverage online sales channels and implement targeted digital marketing strategies will gain a competitive edge. Furthermore, a strategic focus on product differentiation through enhanced safety features, sustainable materials, and unique user experiences will be crucial for long-term market leadership. The exploration of partnerships and collaborations with other players in the travel ecosystem will also unlock significant future market potential.
Travel Converters and Adapters Segmentation
-
1. Application
- 1.1. Online Sales
- 1.2. Offline Sales
-
2. Types
- 2.1. Power Adapter
- 2.2. Voltage Converter
Travel Converters and Adapters Segmentation By Geography
-
1. North America
- 1.1. United States
- 1.2. Canada
- 1.3. Mexico
-
2. South America
- 2.1. Brazil
- 2.2. Argentina
- 2.3. Rest of South America
-
3. Europe
- 3.1. United Kingdom
- 3.2. Germany
- 3.3. France
- 3.4. Italy
- 3.5. Spain
- 3.6. Russia
- 3.7. Benelux
- 3.8. Nordics
- 3.9. Rest of Europe
-
4. Middle East & Africa
- 4.1. Turkey
- 4.2. Israel
- 4.3. GCC
- 4.4. North Africa
- 4.5. South Africa
- 4.6. Rest of Middle East & Africa
-
5. Asia Pacific
- 5.1. China
- 5.2. India
- 5.3. Japan
- 5.4. South Korea
- 5.5. ASEAN
- 5.6. Oceania
- 5.7. Rest of Asia Pacific
Travel Converters and Adapters Regional Market Share
Geographic Coverage of Travel Converters and Adapters
Travel Converters and Adapters REPORT HIGHLIGHTS
| Aspects | Details |
|---|---|
| Study Period | 2020-2034 |
| Base Year | 2025 |
| Estimated Year | 2026 |
| Forecast Period | 2026-2034 |
| Historical Period | 2020-2025 |
| Growth Rate | CAGR of XX% from 2020-2034 |
| Segmentation |
|
Table of Contents
- 1. Introduction
- 1.1. Research Scope
- 1.2. Market Segmentation
- 1.3. Research Objective
- 1.4. Definitions and Assumptions
- 2. Executive Summary
- 2.1. Market Snapshot
- 3. Market Dynamics
- 3.1. Market Drivers
- 3.2. Market Restrains
- 3.3. Market Trends
- 3.4. Market Opportunities
- 4. Market Factor Analysis
- 4.1. Porters Five Forces
- 4.1.1. Bargaining Power of Suppliers
- 4.1.2. Bargaining Power of Buyers
- 4.1.3. Threat of New Entrants
- 4.1.4. Threat of Substitutes
- 4.1.5. Competitive Rivalry
- 4.2. PESTEL analysis
- 4.3. BCG Analysis
- 4.3.1. Stars (High Growth, High Market Share)
- 4.3.2. Cash Cows (Low Growth, High Market Share)
- 4.3.3. Question Mark (High Growth, Low Market Share)
- 4.3.4. Dogs (Low Growth, Low Market Share)
- 4.4. Ansoff Matrix Analysis
- 4.5. Supply Chain Analysis
- 4.6. Regulatory Landscape
- 4.7. Current Market Potential and Opportunity Assessment (TAM–SAM–SOM Framework)
- 4.8. MSR Analyst Note
- 4.1. Porters Five Forces
- 5. Market Analysis, Insights and Forecast 2021-2033
- 5.1. Market Analysis, Insights and Forecast - by Application
- 5.1.1. Online Sales
- 5.1.2. Offline Sales
- 5.2. Market Analysis, Insights and Forecast - by Types
- 5.2.1. Power Adapter
- 5.2.2. Voltage Converter
- 5.3. Market Analysis, Insights and Forecast - by Region
- 5.3.1. North America
- 5.3.2. South America
- 5.3.3. Europe
- 5.3.4. Middle East & Africa
- 5.3.5. Asia Pacific
- 5.1. Market Analysis, Insights and Forecast - by Application
- 6. Global Travel Converters and Adapters Analysis, Insights and Forecast, 2021-2033
- 6.1. Market Analysis, Insights and Forecast - by Application
- 6.1.1. Online Sales
- 6.1.2. Offline Sales
- 6.2. Market Analysis, Insights and Forecast - by Types
- 6.2.1. Power Adapter
- 6.2.2. Voltage Converter
- 6.1. Market Analysis, Insights and Forecast - by Application
- 7. North America Travel Converters and Adapters Analysis, Insights and Forecast, 2020-2032
- 7.1. Market Analysis, Insights and Forecast - by Application
- 7.1.1. Online Sales
- 7.1.2. Offline Sales
- 7.2. Market Analysis, Insights and Forecast - by Types
- 7.2.1. Power Adapter
- 7.2.2. Voltage Converter
- 7.1. Market Analysis, Insights and Forecast - by Application
- 8. South America Travel Converters and Adapters Analysis, Insights and Forecast, 2020-2032
- 8.1. Market Analysis, Insights and Forecast - by Application
- 8.1.1. Online Sales
- 8.1.2. Offline Sales
- 8.2. Market Analysis, Insights and Forecast - by Types
- 8.2.1. Power Adapter
- 8.2.2. Voltage Converter
- 8.1. Market Analysis, Insights and Forecast - by Application
- 9. Europe Travel Converters and Adapters Analysis, Insights and Forecast, 2020-2032
- 9.1. Market Analysis, Insights and Forecast - by Application
- 9.1.1. Online Sales
- 9.1.2. Offline Sales
- 9.2. Market Analysis, Insights and Forecast - by Types
- 9.2.1. Power Adapter
- 9.2.2. Voltage Converter
- 9.1. Market Analysis, Insights and Forecast - by Application
- 10. Middle East & Africa Travel Converters and Adapters Analysis, Insights and Forecast, 2020-2032
- 10.1. Market Analysis, Insights and Forecast - by Application
- 10.1.1. Online Sales
- 10.1.2. Offline Sales
- 10.2. Market Analysis, Insights and Forecast - by Types
- 10.2.1. Power Adapter
- 10.2.2. Voltage Converter
- 10.1. Market Analysis, Insights and Forecast - by Application
- 11. Asia Pacific Travel Converters and Adapters Analysis, Insights and Forecast, 2020-2032
- 11.1. Market Analysis, Insights and Forecast - by Application
- 11.1.1. Online Sales
- 11.1.2. Offline Sales
- 11.2. Market Analysis, Insights and Forecast - by Types
- 11.2.1. Power Adapter
- 11.2.2. Voltage Converter
- 11.1. Market Analysis, Insights and Forecast - by Application
- 12. Competitive Analysis
- 12.1. Company Profiles
- 12.1.1 BESTEK
- 12.1.1.1. Company Overview
- 12.1.1.2. Products
- 12.1.1.3. Company Financials
- 12.1.1.4. SWOT Analysis
- 12.1.2 OREI
- 12.1.2.1. Company Overview
- 12.1.2.2. Products
- 12.1.2.3. Company Financials
- 12.1.2.4. SWOT Analysis
- 12.1.3 Ceptics
- 12.1.3.1. Company Overview
- 12.1.3.2. Products
- 12.1.3.3. Company Financials
- 12.1.3.4. SWOT Analysis
- 12.1.4 Conair
- 12.1.4.1. Company Overview
- 12.1.4.2. Products
- 12.1.4.3. Company Financials
- 12.1.4.4. SWOT Analysis
- 12.1.5 Skross
- 12.1.5.1. Company Overview
- 12.1.5.2. Products
- 12.1.5.3. Company Financials
- 12.1.5.4. SWOT Analysis
- 12.1.6 EPICKA
- 12.1.6.1. Company Overview
- 12.1.6.2. Products
- 12.1.6.3. Company Financials
- 12.1.6.4. SWOT Analysis
- 12.1.7 TESSAN
- 12.1.7.1. Company Overview
- 12.1.7.2. Products
- 12.1.7.3. Company Financials
- 12.1.7.4. SWOT Analysis
- 12.1.8 Yuadon
- 12.1.8.1. Company Overview
- 12.1.8.2. Products
- 12.1.8.3. Company Financials
- 12.1.8.4. SWOT Analysis
- 12.1.9 AHOKU
- 12.1.9.1. Company Overview
- 12.1.9.2. Products
- 12.1.9.3. Company Financials
- 12.1.9.4. SWOT Analysis
- 12.1.10 DROK
- 12.1.10.1. Company Overview
- 12.1.10.2. Products
- 12.1.10.3. Company Financials
- 12.1.10.4. SWOT Analysis
- 12.1.1 BESTEK
- 12.2. Market Entropy
- 12.2.1 Company's Key Areas Served
- 12.2.2 Recent Developments
- 12.3. Company Market Share Analysis 2025
- 12.3.1 Top 5 Companies Market Share Analysis
- 12.3.2 Top 3 Companies Market Share Analysis
- 12.4. List of Potential Customers
- 13. Research Methodology
List of Figures
- Figure 1: Global Travel Converters and Adapters Revenue Breakdown (million, %) by Region 2025 & 2033
- Figure 2: North America Travel Converters and Adapters Revenue (million), by Application 2025 & 2033
- Figure 3: North America Travel Converters and Adapters Revenue Share (%), by Application 2025 & 2033
- Figure 4: North America Travel Converters and Adapters Revenue (million), by Types 2025 & 2033
- Figure 5: North America Travel Converters and Adapters Revenue Share (%), by Types 2025 & 2033
- Figure 6: North America Travel Converters and Adapters Revenue (million), by Country 2025 & 2033
- Figure 7: North America Travel Converters and Adapters Revenue Share (%), by Country 2025 & 2033
- Figure 8: South America Travel Converters and Adapters Revenue (million), by Application 2025 & 2033
- Figure 9: South America Travel Converters and Adapters Revenue Share (%), by Application 2025 & 2033
- Figure 10: South America Travel Converters and Adapters Revenue (million), by Types 2025 & 2033
- Figure 11: South America Travel Converters and Adapters Revenue Share (%), by Types 2025 & 2033
- Figure 12: South America Travel Converters and Adapters Revenue (million), by Country 2025 & 2033
- Figure 13: South America Travel Converters and Adapters Revenue Share (%), by Country 2025 & 2033
- Figure 14: Europe Travel Converters and Adapters Revenue (million), by Application 2025 & 2033
- Figure 15: Europe Travel Converters and Adapters Revenue Share (%), by Application 2025 & 2033
- Figure 16: Europe Travel Converters and Adapters Revenue (million), by Types 2025 & 2033
- Figure 17: Europe Travel Converters and Adapters Revenue Share (%), by Types 2025 & 2033
- Figure 18: Europe Travel Converters and Adapters Revenue (million), by Country 2025 & 2033
- Figure 19: Europe Travel Converters and Adapters Revenue Share (%), by Country 2025 & 2033
- Figure 20: Middle East & Africa Travel Converters and Adapters Revenue (million), by Application 2025 & 2033
- Figure 21: Middle East & Africa Travel Converters and Adapters Revenue Share (%), by Application 2025 & 2033
- Figure 22: Middle East & Africa Travel Converters and Adapters Revenue (million), by Types 2025 & 2033
- Figure 23: Middle East & Africa Travel Converters and Adapters Revenue Share (%), by Types 2025 & 2033
- Figure 24: Middle East & Africa Travel Converters and Adapters Revenue (million), by Country 2025 & 2033
- Figure 25: Middle East & Africa Travel Converters and Adapters Revenue Share (%), by Country 2025 & 2033
- Figure 26: Asia Pacific Travel Converters and Adapters Revenue (million), by Application 2025 & 2033
- Figure 27: Asia Pacific Travel Converters and Adapters Revenue Share (%), by Application 2025 & 2033
- Figure 28: Asia Pacific Travel Converters and Adapters Revenue (million), by Types 2025 & 2033
- Figure 29: Asia Pacific Travel Converters and Adapters Revenue Share (%), by Types 2025 & 2033
- Figure 30: Asia Pacific Travel Converters and Adapters Revenue (million), by Country 2025 & 2033
- Figure 31: Asia Pacific Travel Converters and Adapters Revenue Share (%), by Country 2025 & 2033
List of Tables
- Table 1: Global Travel Converters and Adapters Revenue million Forecast, by Application 2020 & 2033
- Table 2: Global Travel Converters and Adapters Revenue million Forecast, by Types 2020 & 2033
- Table 3: Global Travel Converters and Adapters Revenue million Forecast, by Region 2020 & 2033
- Table 4: Global Travel Converters and Adapters Revenue million Forecast, by Application 2020 & 2033
- Table 5: Global Travel Converters and Adapters Revenue million Forecast, by Types 2020 & 2033
- Table 6: Global Travel Converters and Adapters Revenue million Forecast, by Country 2020 & 2033
- Table 7: United States Travel Converters and Adapters Revenue (million) Forecast, by Application 2020 & 2033
- Table 8: Canada Travel Converters and Adapters Revenue (million) Forecast, by Application 2020 & 2033
- Table 9: Mexico Travel Converters and Adapters Revenue (million) Forecast, by Application 2020 & 2033
- Table 10: Global Travel Converters and Adapters Revenue million Forecast, by Application 2020 & 2033
- Table 11: Global Travel Converters and Adapters Revenue million Forecast, by Types 2020 & 2033
- Table 12: Global Travel Converters and Adapters Revenue million Forecast, by Country 2020 & 2033
- Table 13: Brazil Travel Converters and Adapters Revenue (million) Forecast, by Application 2020 & 2033
- Table 14: Argentina Travel Converters and Adapters Revenue (million) Forecast, by Application 2020 & 2033
- Table 15: Rest of South America Travel Converters and Adapters Revenue (million) Forecast, by Application 2020 & 2033
- Table 16: Global Travel Converters and Adapters Revenue million Forecast, by Application 2020 & 2033
- Table 17: Global Travel Converters and Adapters Revenue million Forecast, by Types 2020 & 2033
- Table 18: Global Travel Converters and Adapters Revenue million Forecast, by Country 2020 & 2033
- Table 19: United Kingdom Travel Converters and Adapters Revenue (million) Forecast, by Application 2020 & 2033
- Table 20: Germany Travel Converters and Adapters Revenue (million) Forecast, by Application 2020 & 2033
- Table 21: France Travel Converters and Adapters Revenue (million) Forecast, by Application 2020 & 2033
- Table 22: Italy Travel Converters and Adapters Revenue (million) Forecast, by Application 2020 & 2033
- Table 23: Spain Travel Converters and Adapters Revenue (million) Forecast, by Application 2020 & 2033
- Table 24: Russia Travel Converters and Adapters Revenue (million) Forecast, by Application 2020 & 2033
- Table 25: Benelux Travel Converters and Adapters Revenue (million) Forecast, by Application 2020 & 2033
- Table 26: Nordics Travel Converters and Adapters Revenue (million) Forecast, by Application 2020 & 2033
- Table 27: Rest of Europe Travel Converters and Adapters Revenue (million) Forecast, by Application 2020 & 2033
- Table 28: Global Travel Converters and Adapters Revenue million Forecast, by Application 2020 & 2033
- Table 29: Global Travel Converters and Adapters Revenue million Forecast, by Types 2020 & 2033
- Table 30: Global Travel Converters and Adapters Revenue million Forecast, by Country 2020 & 2033
- Table 31: Turkey Travel Converters and Adapters Revenue (million) Forecast, by Application 2020 & 2033
- Table 32: Israel Travel Converters and Adapters Revenue (million) Forecast, by Application 2020 & 2033
- Table 33: GCC Travel Converters and Adapters Revenue (million) Forecast, by Application 2020 & 2033
- Table 34: North Africa Travel Converters and Adapters Revenue (million) Forecast, by Application 2020 & 2033
- Table 35: South Africa Travel Converters and Adapters Revenue (million) Forecast, by Application 2020 & 2033
- Table 36: Rest of Middle East & Africa Travel Converters and Adapters Revenue (million) Forecast, by Application 2020 & 2033
- Table 37: Global Travel Converters and Adapters Revenue million Forecast, by Application 2020 & 2033
- Table 38: Global Travel Converters and Adapters Revenue million Forecast, by Types 2020 & 2033
- Table 39: Global Travel Converters and Adapters Revenue million Forecast, by Country 2020 & 2033
- Table 40: China Travel Converters and Adapters Revenue (million) Forecast, by Application 2020 & 2033
- Table 41: India Travel Converters and Adapters Revenue (million) Forecast, by Application 2020 & 2033
- Table 42: Japan Travel Converters and Adapters Revenue (million) Forecast, by Application 2020 & 2033
- Table 43: South Korea Travel Converters and Adapters Revenue (million) Forecast, by Application 2020 & 2033
- Table 44: ASEAN Travel Converters and Adapters Revenue (million) Forecast, by Application 2020 & 2033
- Table 45: Oceania Travel Converters and Adapters Revenue (million) Forecast, by Application 2020 & 2033
- Table 46: Rest of Asia Pacific Travel Converters and Adapters Revenue (million) Forecast, by Application 2020 & 2033
Frequently Asked Questions
1. What is the projected Compound Annual Growth Rate (CAGR) of the Travel Converters and Adapters?
The projected CAGR is approximately XX%.
2. Which companies are prominent players in the Travel Converters and Adapters?
Key companies in the market include BESTEK, OREI, Ceptics, Conair, Skross, EPICKA, TESSAN, Yuadon, AHOKU, DROK.
3. What are the main segments of the Travel Converters and Adapters?
The market segments include Application, Types.
4. Can you provide details about the market size?
The market size is estimated to be USD XXX million as of 2022.
5. What are some drivers contributing to market growth?
N/A
6. What are the notable trends driving market growth?
N/A
7. Are there any restraints impacting market growth?
N/A
8. Can you provide examples of recent developments in the market?
N/A
9. What pricing options are available for accessing the report?
Pricing options include single-user, multi-user, and enterprise licenses priced at USD 2900.00, USD 4350.00, and USD 5800.00 respectively.
10. Is the market size provided in terms of value or volume?
The market size is provided in terms of value, measured in million.
11. Are there any specific market keywords associated with the report?
Yes, the market keyword associated with the report is "Travel Converters and Adapters," which aids in identifying and referencing the specific market segment covered.
12. How do I determine which pricing option suits my needs best?
The pricing options vary based on user requirements and access needs. Individual users may opt for single-user licenses, while businesses requiring broader access may choose multi-user or enterprise licenses for cost-effective access to the report.
13. Are there any additional resources or data provided in the Travel Converters and Adapters report?
While the report offers comprehensive insights, it's advisable to review the specific contents or supplementary materials provided to ascertain if additional resources or data are available.
14. How can I stay updated on further developments or reports in the Travel Converters and Adapters?
To stay informed about further developments, trends, and reports in the Travel Converters and Adapters, consider subscribing to industry newsletters, following relevant companies and organizations, or regularly checking reputable industry news sources and publications.
Methodology
Step 1 - Identification of Relevant Samples Size from Population Database


Step 2 - Approaches for Defining Global Market Size (Value, Volume* & Price*)

Note*: In applicable scenarios
Step 3 - Data Sources
Primary Research
- Web Analytics
- Survey Reports
- Research Institute
- Latest Research Reports
- Opinion Leaders
Secondary Research
- Annual Reports
- White Paper
- Latest Press Release
- Industry Association
- Paid Database
- Investor Presentations

Step 4 - Data Triangulation
Involves using different sources of information in order to increase the validity of a study
These sources are likely to be stakeholders in a program - participants, other researchers, program staff, other community members, and so on.
Then we put all data in single framework & apply various statistical tools to find out the dynamic on the market.
During the analysis stage, feedback from the stakeholder groups would be compared to determine areas of agreement as well as areas of divergence