

Key Insights
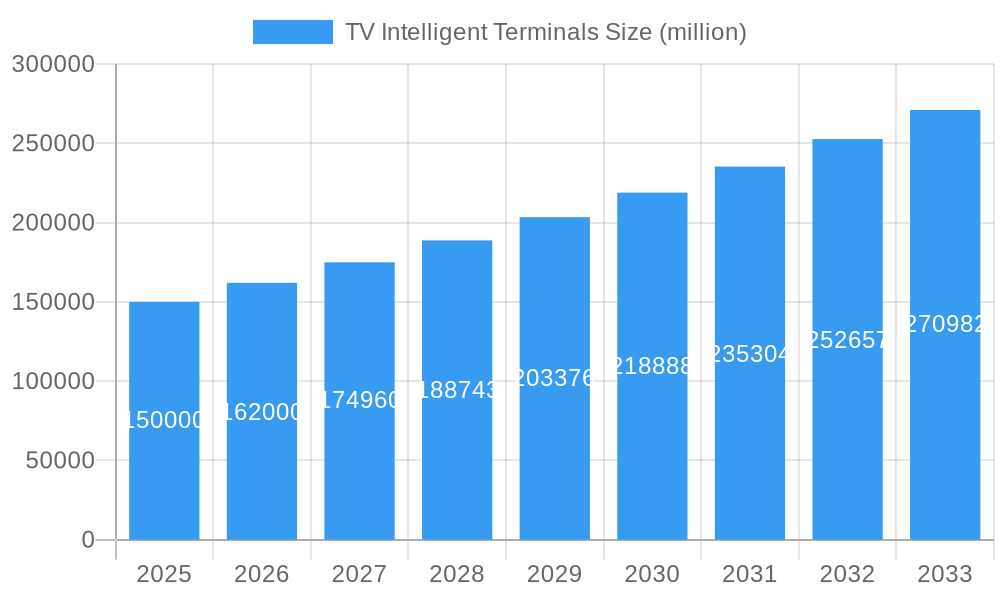
The global market for TV Intelligent Terminals is experiencing robust growth, driven by increasing consumer demand for smart features, enhanced connectivity, and improved user experiences. The market, estimated at $150 billion in 2025, is projected to exhibit a Compound Annual Growth Rate (CAGR) of 8% from 2025 to 2033, reaching an estimated $270 billion by 2033. This growth is fueled by several key factors including the proliferation of streaming services, the adoption of higher resolutions like 8K and advancements in display technologies such as OLED and QLED. Furthermore, the integration of smart home ecosystems and voice assistants further enhances user engagement and drives demand. Major players like Samsung, LG, and TCL are at the forefront of innovation, constantly introducing new models with improved features and competitive pricing strategies to maintain their market share. The increasing affordability of smart TVs is making them accessible to a wider consumer base, particularly in developing economies, further contributing to market expansion.
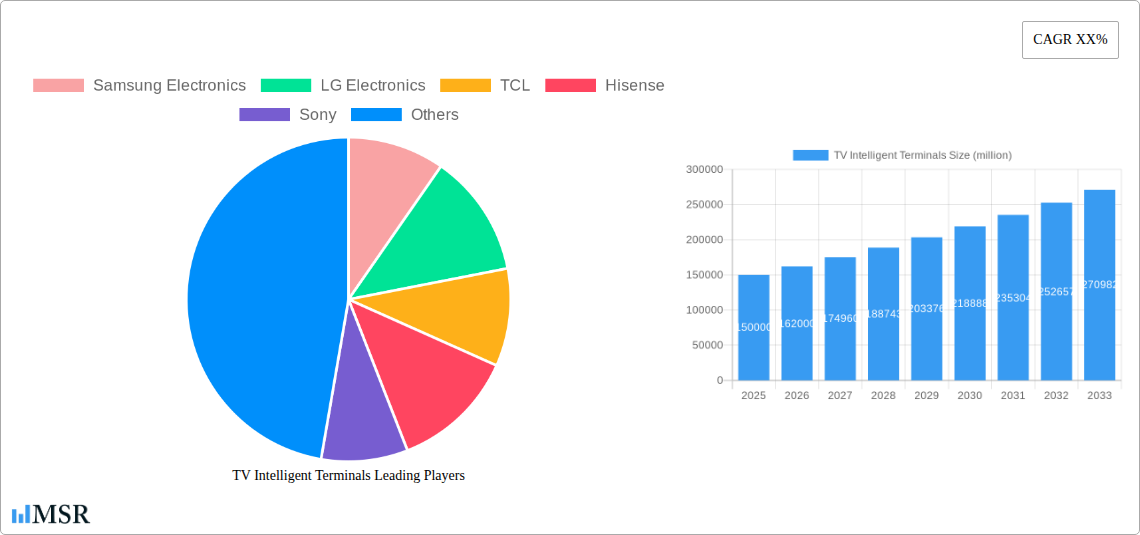
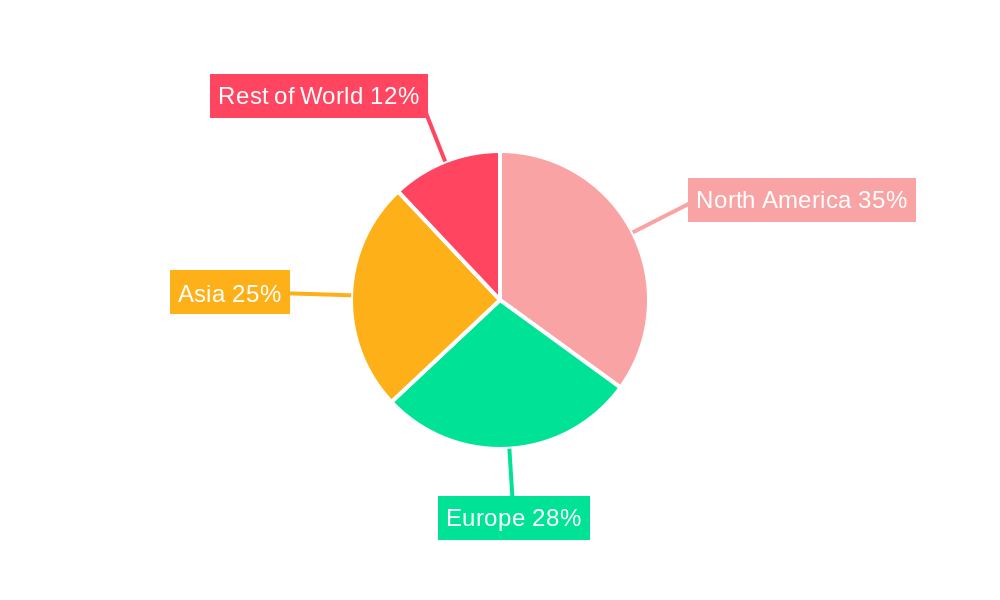
TV Intelligent Terminals Market Size (In Billion)
However, the market faces certain restraints. Supply chain disruptions, particularly concerning crucial components like semiconductors, can impact production and pricing. The increasing competition from emerging players also necessitates continuous innovation and efficient cost management. Furthermore, concerns surrounding data privacy and security in connected devices need to be addressed to maintain consumer confidence. Market segmentation reveals a strong preference for larger screen sizes and premium features, particularly in developed regions. Regional variations in consumer preferences and purchasing power influence market growth, with North America and Europe currently leading in adoption but significant growth potential existing in Asia and other emerging markets. The continued focus on innovation, strategic partnerships, and addressing potential challenges will be crucial for companies to capitalize on the growth opportunities presented by this dynamic market.
TV Intelligent Terminals Company Market Share
Unlocking the Potential of the TV Intelligent Terminals Market: A Comprehensive Report (2019-2033)
This comprehensive report provides a detailed analysis of the global TV Intelligent Terminals market, offering invaluable insights for industry stakeholders, investors, and strategists. Covering the period from 2019 to 2033, with a focus on 2025, this study unveils the market's dynamics, key players, emerging trends, and future growth prospects. The global market for TV Intelligent Terminals is projected to reach xx million units by 2033, representing a significant CAGR of xx% from 2025 to 2033.
TV Intelligent Terminals Market Concentration & Dynamics
This section examines the competitive landscape, encompassing market share, M&A activity, innovation ecosystems, regulatory influences, and end-user trends. The global TV Intelligent Terminals market exhibits a moderately concentrated structure, with key players like Samsung Electronics, LG Electronics, TCL, and Hisense holding significant market shares in 2025.
- Market Share (2025): Samsung Electronics (xx%), LG Electronics (xx%), TCL (xx%), Hisense (xx%), Others (xx%).
- M&A Activity (2019-2024): A total of xx major M&A deals were recorded, primarily focused on expanding technology portfolios and geographic reach. The majority of acquisitions involved smaller technology companies specializing in AI and software integration within the TV ecosystem.
- Innovation Ecosystems: Significant investments in R&D by leading players are driving innovations in areas such as AI-powered features (voice assistants, personalized recommendations), improved display technologies (8K, OLED, mini-LED), and enhanced connectivity (5G, IoT integration).
- Regulatory Frameworks: Government regulations concerning data privacy, energy efficiency, and broadcasting standards influence the development and deployment of TV Intelligent Terminals. These regulations vary across different regions, creating complexities for manufacturers.
- Substitute Products: Competition arises from alternative entertainment platforms, such as streaming services and gaming consoles, demanding continual innovation and value proposition enhancements from TV Intelligent Terminal manufacturers.
- End-User Trends: Consumer demand for larger screens, higher resolutions, advanced smart features, and seamless integration with other smart home devices shapes the evolution of the TV Intelligent Terminal market.
TV Intelligent Terminals Industry Insights & Trends
This section delves into market growth drivers, technological advancements, and evolving consumer behaviors. The market is propelled by increasing disposable incomes, rapid urbanization, and rising adoption of streaming services. The integration of artificial intelligence and the Internet of Things are major catalysts for growth.
The market size reached xx million units in 2025, driven by several key factors: the expansion of high-speed internet access globally; growing demand for premium features like 8K resolution displays and HDR technology; increasing adoption of voice-controlled interfaces; and the rise of connected home ecosystems. Technological disruptions, including the development of advanced display technologies (micro-LED, QD-OLED), and the integration of next-generation AI capabilities, are shaping the market landscape. Consumer behavior shifts toward personalized content consumption and preference for integrated entertainment solutions are also key market influencers.
Key Markets & Segments Leading TV Intelligent Terminals
North America and Asia-Pacific are currently the leading regions in terms of TV Intelligent Terminal adoption. China's massive consumer base and robust domestic manufacturers position it as a key market, while North America demonstrates strong demand for premium features and high-resolution displays.
- Drivers for North America: High disposable incomes, early adoption of new technologies, and well-developed infrastructure.
- Drivers for Asia-Pacific (particularly China): Huge population, rapid economic growth, increasing urbanisation, and expanding middle class.
- Dominance Analysis: The dominance of these regions is attributable to several factors including higher per capita income levels, higher broadband penetration, and consumer preference for high-quality large-screen entertainment.
Specific segments exhibiting strong growth include large-screen TVs (75 inches and above), premium models with advanced features, and TVs with integrated smart home functionalities.
TV Intelligent Terminals Product Developments
Recent innovations focus on enhancing user experience with advanced features like improved AI-powered voice assistants, superior picture quality through advancements in display technology (e.g., Mini-LED, OLED), and sophisticated gaming capabilities. The integration of IoT devices creates more interconnected home entertainment systems. These advancements provide competitive advantages for manufacturers and create compelling value propositions for consumers.
Challenges in the TV Intelligent Terminals Market
The market faces challenges such as increasing manufacturing costs associated with advanced components, fluctuations in raw material prices, and intense competition from established players and new entrants. Supply chain disruptions and trade conflicts represent additional external risks. Regulatory compliance and data privacy concerns require significant investments and careful planning.
Forces Driving TV Intelligent Terminals Growth
Technological advancements, such as enhanced display technologies (8K, OLED, QLED), AI integration, and seamless connectivity with smart home devices, drive market growth. Growing consumer demand for high-quality entertainment experiences in conjunction with rising disposable incomes, especially in developing economies, significantly fuels market expansion. Favorable government policies and regulatory incentives in specific regions also contribute to market growth.
Long-Term Growth Catalysts in TV Intelligent Terminals
Long-term growth is expected from continued technological innovation, strategic partnerships, and market expansion into emerging economies. The adoption of 8K resolution, foldable displays, and improved gaming capabilities will shape future demand. Expanding into new markets and developing cost-effective manufacturing processes will sustain long-term growth.
Emerging Opportunities in TV Intelligent Terminals
Emerging opportunities include expanding into new markets with unmet needs, such as Africa and parts of South America; leveraging the growth of 5G technology to enhance connectivity and streaming capabilities; developing personalized content recommendations and AI-powered user interfaces; and creating more energy-efficient products in response to increasing environmental awareness.
Leading Players in the TV Intelligent Terminals Sector
- Samsung Electronics
- LG Electronics
- TCL
- Hisense
- Sony
- Skyworth
- Foxconn (Sharp)
- Xiaomi
- Vizio
- Haier
- Panasonic
- Chonghong
- Konka
- TOSHIBA
- Yinhe Electronics
Key Milestones in TV Intelligent Terminals Industry
- 2020: Launch of the first commercially available 8K TVs by multiple manufacturers.
- 2021: Increased adoption of Mini-LED and OLED technologies. Significant increase in smart TV penetration rates globally.
- 2022: Launch of TVs with integrated 5G connectivity. Emphasis on integrating AI and voice control features.
- 2023: Growth of streaming services, impacting TV sales and increasing demand for smart features.
- 2024: Increased focus on gaming features within TVs, attracting gamers as a new segment.
Strategic Outlook for TV Intelligent Terminals Market
The future of the TV Intelligent Terminals market is promising, driven by continuous technological advancements, evolving consumer preferences, and expansion into new markets. Strategic opportunities lie in developing innovative products and services that deliver seamless entertainment experiences, integrate effectively with smart homes, and cater to evolving consumer demands. Focusing on superior picture quality, enhanced AI integration, and creating immersive gaming experiences will be critical for success.
TV Intelligent Terminals Segmentation
-
1. Application
- 1.1. Family
- 1.2. Public
-
2. Types
- 2.1. 32 Inch
- 2.2. 40 Inch
- 2.3. 42 Inch
- 2.4. 50-55 Inch
- 2.5. ≥60 Inch
TV Intelligent Terminals Segmentation By Geography
-
1. North America
- 1.1. United States
- 1.2. Canada
- 1.3. Mexico
-
2. South America
- 2.1. Brazil
- 2.2. Argentina
- 2.3. Rest of South America
-
3. Europe
- 3.1. United Kingdom
- 3.2. Germany
- 3.3. France
- 3.4. Italy
- 3.5. Spain
- 3.6. Russia
- 3.7. Benelux
- 3.8. Nordics
- 3.9. Rest of Europe
-
4. Middle East & Africa
- 4.1. Turkey
- 4.2. Israel
- 4.3. GCC
- 4.4. North Africa
- 4.5. South Africa
- 4.6. Rest of Middle East & Africa
-
5. Asia Pacific
- 5.1. China
- 5.2. India
- 5.3. Japan
- 5.4. South Korea
- 5.5. ASEAN
- 5.6. Oceania
- 5.7. Rest of Asia Pacific
TV Intelligent Terminals Regional Market Share
Geographic Coverage of TV Intelligent Terminals
TV Intelligent Terminals REPORT HIGHLIGHTS
| Aspects | Details |
|---|---|
| Study Period | 2020-2034 |
| Base Year | 2025 |
| Estimated Year | 2026 |
| Forecast Period | 2026-2034 |
| Historical Period | 2020-2025 |
| Growth Rate | CAGR of XX% from 2020-2034 |
| Segmentation |
|
Table of Contents
- 1. Introduction
- 1.1. Research Scope
- 1.2. Market Segmentation
- 1.3. Research Objective
- 1.4. Definitions and Assumptions
- 2. Executive Summary
- 2.1. Market Snapshot
- 3. Market Dynamics
- 3.1. Market Drivers
- 3.2. Market Restrains
- 3.3. Market Trends
- 3.4. Market Opportunities
- 4. Market Factor Analysis
- 4.1. Porters Five Forces
- 4.1.1. Bargaining Power of Suppliers
- 4.1.2. Bargaining Power of Buyers
- 4.1.3. Threat of New Entrants
- 4.1.4. Threat of Substitutes
- 4.1.5. Competitive Rivalry
- 4.2. PESTEL analysis
- 4.3. BCG Analysis
- 4.3.1. Stars (High Growth, High Market Share)
- 4.3.2. Cash Cows (Low Growth, High Market Share)
- 4.3.3. Question Mark (High Growth, Low Market Share)
- 4.3.4. Dogs (Low Growth, Low Market Share)
- 4.4. Ansoff Matrix Analysis
- 4.5. Supply Chain Analysis
- 4.6. Regulatory Landscape
- 4.7. Current Market Potential and Opportunity Assessment (TAM–SAM–SOM Framework)
- 4.8. MSR Analyst Note
- 4.1. Porters Five Forces
- 5. Market Analysis, Insights and Forecast 2021-2033
- 5.1. Market Analysis, Insights and Forecast - by Application
- 5.1.1. Family
- 5.1.2. Public
- 5.2. Market Analysis, Insights and Forecast - by Types
- 5.2.1. 32 Inch
- 5.2.2. 40 Inch
- 5.2.3. 42 Inch
- 5.2.4. 50-55 Inch
- 5.2.5. ≥60 Inch
- 5.3. Market Analysis, Insights and Forecast - by Region
- 5.3.1. North America
- 5.3.2. South America
- 5.3.3. Europe
- 5.3.4. Middle East & Africa
- 5.3.5. Asia Pacific
- 5.1. Market Analysis, Insights and Forecast - by Application
- 6. Global TV Intelligent Terminals Analysis, Insights and Forecast, 2021-2033
- 6.1. Market Analysis, Insights and Forecast - by Application
- 6.1.1. Family
- 6.1.2. Public
- 6.2. Market Analysis, Insights and Forecast - by Types
- 6.2.1. 32 Inch
- 6.2.2. 40 Inch
- 6.2.3. 42 Inch
- 6.2.4. 50-55 Inch
- 6.2.5. ≥60 Inch
- 6.1. Market Analysis, Insights and Forecast - by Application
- 7. North America TV Intelligent Terminals Analysis, Insights and Forecast, 2020-2032
- 7.1. Market Analysis, Insights and Forecast - by Application
- 7.1.1. Family
- 7.1.2. Public
- 7.2. Market Analysis, Insights and Forecast - by Types
- 7.2.1. 32 Inch
- 7.2.2. 40 Inch
- 7.2.3. 42 Inch
- 7.2.4. 50-55 Inch
- 7.2.5. ≥60 Inch
- 7.1. Market Analysis, Insights and Forecast - by Application
- 8. South America TV Intelligent Terminals Analysis, Insights and Forecast, 2020-2032
- 8.1. Market Analysis, Insights and Forecast - by Application
- 8.1.1. Family
- 8.1.2. Public
- 8.2. Market Analysis, Insights and Forecast - by Types
- 8.2.1. 32 Inch
- 8.2.2. 40 Inch
- 8.2.3. 42 Inch
- 8.2.4. 50-55 Inch
- 8.2.5. ≥60 Inch
- 8.1. Market Analysis, Insights and Forecast - by Application
- 9. Europe TV Intelligent Terminals Analysis, Insights and Forecast, 2020-2032
- 9.1. Market Analysis, Insights and Forecast - by Application
- 9.1.1. Family
- 9.1.2. Public
- 9.2. Market Analysis, Insights and Forecast - by Types
- 9.2.1. 32 Inch
- 9.2.2. 40 Inch
- 9.2.3. 42 Inch
- 9.2.4. 50-55 Inch
- 9.2.5. ≥60 Inch
- 9.1. Market Analysis, Insights and Forecast - by Application
- 10. Middle East & Africa TV Intelligent Terminals Analysis, Insights and Forecast, 2020-2032
- 10.1. Market Analysis, Insights and Forecast - by Application
- 10.1.1. Family
- 10.1.2. Public
- 10.2. Market Analysis, Insights and Forecast - by Types
- 10.2.1. 32 Inch
- 10.2.2. 40 Inch
- 10.2.3. 42 Inch
- 10.2.4. 50-55 Inch
- 10.2.5. ≥60 Inch
- 10.1. Market Analysis, Insights and Forecast - by Application
- 11. Asia Pacific TV Intelligent Terminals Analysis, Insights and Forecast, 2020-2032
- 11.1. Market Analysis, Insights and Forecast - by Application
- 11.1.1. Family
- 11.1.2. Public
- 11.2. Market Analysis, Insights and Forecast - by Types
- 11.2.1. 32 Inch
- 11.2.2. 40 Inch
- 11.2.3. 42 Inch
- 11.2.4. 50-55 Inch
- 11.2.5. ≥60 Inch
- 11.1. Market Analysis, Insights and Forecast - by Application
- 12. Competitive Analysis
- 12.1. Company Profiles
- 12.1.1 Samsung Electronics
- 12.1.1.1. Company Overview
- 12.1.1.2. Products
- 12.1.1.3. Company Financials
- 12.1.1.4. SWOT Analysis
- 12.1.2 LG Electronics
- 12.1.2.1. Company Overview
- 12.1.2.2. Products
- 12.1.2.3. Company Financials
- 12.1.2.4. SWOT Analysis
- 12.1.3 TCL
- 12.1.3.1. Company Overview
- 12.1.3.2. Products
- 12.1.3.3. Company Financials
- 12.1.3.4. SWOT Analysis
- 12.1.4 Hisense
- 12.1.4.1. Company Overview
- 12.1.4.2. Products
- 12.1.4.3. Company Financials
- 12.1.4.4. SWOT Analysis
- 12.1.5 Sony
- 12.1.5.1. Company Overview
- 12.1.5.2. Products
- 12.1.5.3. Company Financials
- 12.1.5.4. SWOT Analysis
- 12.1.6 Skyworth
- 12.1.6.1. Company Overview
- 12.1.6.2. Products
- 12.1.6.3. Company Financials
- 12.1.6.4. SWOT Analysis
- 12.1.7 Foxconn (Sharp)
- 12.1.7.1. Company Overview
- 12.1.7.2. Products
- 12.1.7.3. Company Financials
- 12.1.7.4. SWOT Analysis
- 12.1.8 Xiaomi
- 12.1.8.1. Company Overview
- 12.1.8.2. Products
- 12.1.8.3. Company Financials
- 12.1.8.4. SWOT Analysis
- 12.1.9 Vizio
- 12.1.9.1. Company Overview
- 12.1.9.2. Products
- 12.1.9.3. Company Financials
- 12.1.9.4. SWOT Analysis
- 12.1.10 Haier
- 12.1.10.1. Company Overview
- 12.1.10.2. Products
- 12.1.10.3. Company Financials
- 12.1.10.4. SWOT Analysis
- 12.1.11 Panasonic
- 12.1.11.1. Company Overview
- 12.1.11.2. Products
- 12.1.11.3. Company Financials
- 12.1.11.4. SWOT Analysis
- 12.1.12 Chonghong
- 12.1.12.1. Company Overview
- 12.1.12.2. Products
- 12.1.12.3. Company Financials
- 12.1.12.4. SWOT Analysis
- 12.1.13 Konka
- 12.1.13.1. Company Overview
- 12.1.13.2. Products
- 12.1.13.3. Company Financials
- 12.1.13.4. SWOT Analysis
- 12.1.14 TOSHIBA
- 12.1.14.1. Company Overview
- 12.1.14.2. Products
- 12.1.14.3. Company Financials
- 12.1.14.4. SWOT Analysis
- 12.1.15 Yinhe Electronics
- 12.1.15.1. Company Overview
- 12.1.15.2. Products
- 12.1.15.3. Company Financials
- 12.1.15.4. SWOT Analysis
- 12.1.1 Samsung Electronics
- 12.2. Market Entropy
- 12.2.1 Company's Key Areas Served
- 12.2.2 Recent Developments
- 12.3. Company Market Share Analysis 2025
- 12.3.1 Top 5 Companies Market Share Analysis
- 12.3.2 Top 3 Companies Market Share Analysis
- 12.4. List of Potential Customers
- 13. Research Methodology
List of Figures
- Figure 1: Global TV Intelligent Terminals Revenue Breakdown (million, %) by Region 2025 & 2033
- Figure 2: Global TV Intelligent Terminals Volume Breakdown (K, %) by Region 2025 & 2033
- Figure 3: North America TV Intelligent Terminals Revenue (million), by Application 2025 & 2033
- Figure 4: North America TV Intelligent Terminals Volume (K), by Application 2025 & 2033
- Figure 5: North America TV Intelligent Terminals Revenue Share (%), by Application 2025 & 2033
- Figure 6: North America TV Intelligent Terminals Volume Share (%), by Application 2025 & 2033
- Figure 7: North America TV Intelligent Terminals Revenue (million), by Types 2025 & 2033
- Figure 8: North America TV Intelligent Terminals Volume (K), by Types 2025 & 2033
- Figure 9: North America TV Intelligent Terminals Revenue Share (%), by Types 2025 & 2033
- Figure 10: North America TV Intelligent Terminals Volume Share (%), by Types 2025 & 2033
- Figure 11: North America TV Intelligent Terminals Revenue (million), by Country 2025 & 2033
- Figure 12: North America TV Intelligent Terminals Volume (K), by Country 2025 & 2033
- Figure 13: North America TV Intelligent Terminals Revenue Share (%), by Country 2025 & 2033
- Figure 14: North America TV Intelligent Terminals Volume Share (%), by Country 2025 & 2033
- Figure 15: South America TV Intelligent Terminals Revenue (million), by Application 2025 & 2033
- Figure 16: South America TV Intelligent Terminals Volume (K), by Application 2025 & 2033
- Figure 17: South America TV Intelligent Terminals Revenue Share (%), by Application 2025 & 2033
- Figure 18: South America TV Intelligent Terminals Volume Share (%), by Application 2025 & 2033
- Figure 19: South America TV Intelligent Terminals Revenue (million), by Types 2025 & 2033
- Figure 20: South America TV Intelligent Terminals Volume (K), by Types 2025 & 2033
- Figure 21: South America TV Intelligent Terminals Revenue Share (%), by Types 2025 & 2033
- Figure 22: South America TV Intelligent Terminals Volume Share (%), by Types 2025 & 2033
- Figure 23: South America TV Intelligent Terminals Revenue (million), by Country 2025 & 2033
- Figure 24: South America TV Intelligent Terminals Volume (K), by Country 2025 & 2033
- Figure 25: South America TV Intelligent Terminals Revenue Share (%), by Country 2025 & 2033
- Figure 26: South America TV Intelligent Terminals Volume Share (%), by Country 2025 & 2033
- Figure 27: Europe TV Intelligent Terminals Revenue (million), by Application 2025 & 2033
- Figure 28: Europe TV Intelligent Terminals Volume (K), by Application 2025 & 2033
- Figure 29: Europe TV Intelligent Terminals Revenue Share (%), by Application 2025 & 2033
- Figure 30: Europe TV Intelligent Terminals Volume Share (%), by Application 2025 & 2033
- Figure 31: Europe TV Intelligent Terminals Revenue (million), by Types 2025 & 2033
- Figure 32: Europe TV Intelligent Terminals Volume (K), by Types 2025 & 2033
- Figure 33: Europe TV Intelligent Terminals Revenue Share (%), by Types 2025 & 2033
- Figure 34: Europe TV Intelligent Terminals Volume Share (%), by Types 2025 & 2033
- Figure 35: Europe TV Intelligent Terminals Revenue (million), by Country 2025 & 2033
- Figure 36: Europe TV Intelligent Terminals Volume (K), by Country 2025 & 2033
- Figure 37: Europe TV Intelligent Terminals Revenue Share (%), by Country 2025 & 2033
- Figure 38: Europe TV Intelligent Terminals Volume Share (%), by Country 2025 & 2033
- Figure 39: Middle East & Africa TV Intelligent Terminals Revenue (million), by Application 2025 & 2033
- Figure 40: Middle East & Africa TV Intelligent Terminals Volume (K), by Application 2025 & 2033
- Figure 41: Middle East & Africa TV Intelligent Terminals Revenue Share (%), by Application 2025 & 2033
- Figure 42: Middle East & Africa TV Intelligent Terminals Volume Share (%), by Application 2025 & 2033
- Figure 43: Middle East & Africa TV Intelligent Terminals Revenue (million), by Types 2025 & 2033
- Figure 44: Middle East & Africa TV Intelligent Terminals Volume (K), by Types 2025 & 2033
- Figure 45: Middle East & Africa TV Intelligent Terminals Revenue Share (%), by Types 2025 & 2033
- Figure 46: Middle East & Africa TV Intelligent Terminals Volume Share (%), by Types 2025 & 2033
- Figure 47: Middle East & Africa TV Intelligent Terminals Revenue (million), by Country 2025 & 2033
- Figure 48: Middle East & Africa TV Intelligent Terminals Volume (K), by Country 2025 & 2033
- Figure 49: Middle East & Africa TV Intelligent Terminals Revenue Share (%), by Country 2025 & 2033
- Figure 50: Middle East & Africa TV Intelligent Terminals Volume Share (%), by Country 2025 & 2033
- Figure 51: Asia Pacific TV Intelligent Terminals Revenue (million), by Application 2025 & 2033
- Figure 52: Asia Pacific TV Intelligent Terminals Volume (K), by Application 2025 & 2033
- Figure 53: Asia Pacific TV Intelligent Terminals Revenue Share (%), by Application 2025 & 2033
- Figure 54: Asia Pacific TV Intelligent Terminals Volume Share (%), by Application 2025 & 2033
- Figure 55: Asia Pacific TV Intelligent Terminals Revenue (million), by Types 2025 & 2033
- Figure 56: Asia Pacific TV Intelligent Terminals Volume (K), by Types 2025 & 2033
- Figure 57: Asia Pacific TV Intelligent Terminals Revenue Share (%), by Types 2025 & 2033
- Figure 58: Asia Pacific TV Intelligent Terminals Volume Share (%), by Types 2025 & 2033
- Figure 59: Asia Pacific TV Intelligent Terminals Revenue (million), by Country 2025 & 2033
- Figure 60: Asia Pacific TV Intelligent Terminals Volume (K), by Country 2025 & 2033
- Figure 61: Asia Pacific TV Intelligent Terminals Revenue Share (%), by Country 2025 & 2033
- Figure 62: Asia Pacific TV Intelligent Terminals Volume Share (%), by Country 2025 & 2033
List of Tables
- Table 1: Global TV Intelligent Terminals Revenue million Forecast, by Application 2020 & 2033
- Table 2: Global TV Intelligent Terminals Volume K Forecast, by Application 2020 & 2033
- Table 3: Global TV Intelligent Terminals Revenue million Forecast, by Types 2020 & 2033
- Table 4: Global TV Intelligent Terminals Volume K Forecast, by Types 2020 & 2033
- Table 5: Global TV Intelligent Terminals Revenue million Forecast, by Region 2020 & 2033
- Table 6: Global TV Intelligent Terminals Volume K Forecast, by Region 2020 & 2033
- Table 7: Global TV Intelligent Terminals Revenue million Forecast, by Application 2020 & 2033
- Table 8: Global TV Intelligent Terminals Volume K Forecast, by Application 2020 & 2033
- Table 9: Global TV Intelligent Terminals Revenue million Forecast, by Types 2020 & 2033
- Table 10: Global TV Intelligent Terminals Volume K Forecast, by Types 2020 & 2033
- Table 11: Global TV Intelligent Terminals Revenue million Forecast, by Country 2020 & 2033
- Table 12: Global TV Intelligent Terminals Volume K Forecast, by Country 2020 & 2033
- Table 13: United States TV Intelligent Terminals Revenue (million) Forecast, by Application 2020 & 2033
- Table 14: United States TV Intelligent Terminals Volume (K) Forecast, by Application 2020 & 2033
- Table 15: Canada TV Intelligent Terminals Revenue (million) Forecast, by Application 2020 & 2033
- Table 16: Canada TV Intelligent Terminals Volume (K) Forecast, by Application 2020 & 2033
- Table 17: Mexico TV Intelligent Terminals Revenue (million) Forecast, by Application 2020 & 2033
- Table 18: Mexico TV Intelligent Terminals Volume (K) Forecast, by Application 2020 & 2033
- Table 19: Global TV Intelligent Terminals Revenue million Forecast, by Application 2020 & 2033
- Table 20: Global TV Intelligent Terminals Volume K Forecast, by Application 2020 & 2033
- Table 21: Global TV Intelligent Terminals Revenue million Forecast, by Types 2020 & 2033
- Table 22: Global TV Intelligent Terminals Volume K Forecast, by Types 2020 & 2033
- Table 23: Global TV Intelligent Terminals Revenue million Forecast, by Country 2020 & 2033
- Table 24: Global TV Intelligent Terminals Volume K Forecast, by Country 2020 & 2033
- Table 25: Brazil TV Intelligent Terminals Revenue (million) Forecast, by Application 2020 & 2033
- Table 26: Brazil TV Intelligent Terminals Volume (K) Forecast, by Application 2020 & 2033
- Table 27: Argentina TV Intelligent Terminals Revenue (million) Forecast, by Application 2020 & 2033
- Table 28: Argentina TV Intelligent Terminals Volume (K) Forecast, by Application 2020 & 2033
- Table 29: Rest of South America TV Intelligent Terminals Revenue (million) Forecast, by Application 2020 & 2033
- Table 30: Rest of South America TV Intelligent Terminals Volume (K) Forecast, by Application 2020 & 2033
- Table 31: Global TV Intelligent Terminals Revenue million Forecast, by Application 2020 & 2033
- Table 32: Global TV Intelligent Terminals Volume K Forecast, by Application 2020 & 2033
- Table 33: Global TV Intelligent Terminals Revenue million Forecast, by Types 2020 & 2033
- Table 34: Global TV Intelligent Terminals Volume K Forecast, by Types 2020 & 2033
- Table 35: Global TV Intelligent Terminals Revenue million Forecast, by Country 2020 & 2033
- Table 36: Global TV Intelligent Terminals Volume K Forecast, by Country 2020 & 2033
- Table 37: United Kingdom TV Intelligent Terminals Revenue (million) Forecast, by Application 2020 & 2033
- Table 38: United Kingdom TV Intelligent Terminals Volume (K) Forecast, by Application 2020 & 2033
- Table 39: Germany TV Intelligent Terminals Revenue (million) Forecast, by Application 2020 & 2033
- Table 40: Germany TV Intelligent Terminals Volume (K) Forecast, by Application 2020 & 2033
- Table 41: France TV Intelligent Terminals Revenue (million) Forecast, by Application 2020 & 2033
- Table 42: France TV Intelligent Terminals Volume (K) Forecast, by Application 2020 & 2033
- Table 43: Italy TV Intelligent Terminals Revenue (million) Forecast, by Application 2020 & 2033
- Table 44: Italy TV Intelligent Terminals Volume (K) Forecast, by Application 2020 & 2033
- Table 45: Spain TV Intelligent Terminals Revenue (million) Forecast, by Application 2020 & 2033
- Table 46: Spain TV Intelligent Terminals Volume (K) Forecast, by Application 2020 & 2033
- Table 47: Russia TV Intelligent Terminals Revenue (million) Forecast, by Application 2020 & 2033
- Table 48: Russia TV Intelligent Terminals Volume (K) Forecast, by Application 2020 & 2033
- Table 49: Benelux TV Intelligent Terminals Revenue (million) Forecast, by Application 2020 & 2033
- Table 50: Benelux TV Intelligent Terminals Volume (K) Forecast, by Application 2020 & 2033
- Table 51: Nordics TV Intelligent Terminals Revenue (million) Forecast, by Application 2020 & 2033
- Table 52: Nordics TV Intelligent Terminals Volume (K) Forecast, by Application 2020 & 2033
- Table 53: Rest of Europe TV Intelligent Terminals Revenue (million) Forecast, by Application 2020 & 2033
- Table 54: Rest of Europe TV Intelligent Terminals Volume (K) Forecast, by Application 2020 & 2033
- Table 55: Global TV Intelligent Terminals Revenue million Forecast, by Application 2020 & 2033
- Table 56: Global TV Intelligent Terminals Volume K Forecast, by Application 2020 & 2033
- Table 57: Global TV Intelligent Terminals Revenue million Forecast, by Types 2020 & 2033
- Table 58: Global TV Intelligent Terminals Volume K Forecast, by Types 2020 & 2033
- Table 59: Global TV Intelligent Terminals Revenue million Forecast, by Country 2020 & 2033
- Table 60: Global TV Intelligent Terminals Volume K Forecast, by Country 2020 & 2033
- Table 61: Turkey TV Intelligent Terminals Revenue (million) Forecast, by Application 2020 & 2033
- Table 62: Turkey TV Intelligent Terminals Volume (K) Forecast, by Application 2020 & 2033
- Table 63: Israel TV Intelligent Terminals Revenue (million) Forecast, by Application 2020 & 2033
- Table 64: Israel TV Intelligent Terminals Volume (K) Forecast, by Application 2020 & 2033
- Table 65: GCC TV Intelligent Terminals Revenue (million) Forecast, by Application 2020 & 2033
- Table 66: GCC TV Intelligent Terminals Volume (K) Forecast, by Application 2020 & 2033
- Table 67: North Africa TV Intelligent Terminals Revenue (million) Forecast, by Application 2020 & 2033
- Table 68: North Africa TV Intelligent Terminals Volume (K) Forecast, by Application 2020 & 2033
- Table 69: South Africa TV Intelligent Terminals Revenue (million) Forecast, by Application 2020 & 2033
- Table 70: South Africa TV Intelligent Terminals Volume (K) Forecast, by Application 2020 & 2033
- Table 71: Rest of Middle East & Africa TV Intelligent Terminals Revenue (million) Forecast, by Application 2020 & 2033
- Table 72: Rest of Middle East & Africa TV Intelligent Terminals Volume (K) Forecast, by Application 2020 & 2033
- Table 73: Global TV Intelligent Terminals Revenue million Forecast, by Application 2020 & 2033
- Table 74: Global TV Intelligent Terminals Volume K Forecast, by Application 2020 & 2033
- Table 75: Global TV Intelligent Terminals Revenue million Forecast, by Types 2020 & 2033
- Table 76: Global TV Intelligent Terminals Volume K Forecast, by Types 2020 & 2033
- Table 77: Global TV Intelligent Terminals Revenue million Forecast, by Country 2020 & 2033
- Table 78: Global TV Intelligent Terminals Volume K Forecast, by Country 2020 & 2033
- Table 79: China TV Intelligent Terminals Revenue (million) Forecast, by Application 2020 & 2033
- Table 80: China TV Intelligent Terminals Volume (K) Forecast, by Application 2020 & 2033
- Table 81: India TV Intelligent Terminals Revenue (million) Forecast, by Application 2020 & 2033
- Table 82: India TV Intelligent Terminals Volume (K) Forecast, by Application 2020 & 2033
- Table 83: Japan TV Intelligent Terminals Revenue (million) Forecast, by Application 2020 & 2033
- Table 84: Japan TV Intelligent Terminals Volume (K) Forecast, by Application 2020 & 2033
- Table 85: South Korea TV Intelligent Terminals Revenue (million) Forecast, by Application 2020 & 2033
- Table 86: South Korea TV Intelligent Terminals Volume (K) Forecast, by Application 2020 & 2033
- Table 87: ASEAN TV Intelligent Terminals Revenue (million) Forecast, by Application 2020 & 2033
- Table 88: ASEAN TV Intelligent Terminals Volume (K) Forecast, by Application 2020 & 2033
- Table 89: Oceania TV Intelligent Terminals Revenue (million) Forecast, by Application 2020 & 2033
- Table 90: Oceania TV Intelligent Terminals Volume (K) Forecast, by Application 2020 & 2033
- Table 91: Rest of Asia Pacific TV Intelligent Terminals Revenue (million) Forecast, by Application 2020 & 2033
- Table 92: Rest of Asia Pacific TV Intelligent Terminals Volume (K) Forecast, by Application 2020 & 2033
Frequently Asked Questions
1. What is the projected Compound Annual Growth Rate (CAGR) of the TV Intelligent Terminals?
The projected CAGR is approximately XX%.
2. Which companies are prominent players in the TV Intelligent Terminals?
Key companies in the market include Samsung Electronics, LG Electronics, TCL, Hisense, Sony, Skyworth, Foxconn (Sharp), Xiaomi, Vizio, Haier, Panasonic, Chonghong, Konka, TOSHIBA, Yinhe Electronics.
3. What are the main segments of the TV Intelligent Terminals?
The market segments include Application, Types.
4. Can you provide details about the market size?
The market size is estimated to be USD XXX million as of 2022.
5. What are some drivers contributing to market growth?
N/A
6. What are the notable trends driving market growth?
N/A
7. Are there any restraints impacting market growth?
N/A
8. Can you provide examples of recent developments in the market?
N/A
9. What pricing options are available for accessing the report?
Pricing options include single-user, multi-user, and enterprise licenses priced at USD 3950.00, USD 5925.00, and USD 7900.00 respectively.
10. Is the market size provided in terms of value or volume?
The market size is provided in terms of value, measured in million and volume, measured in K.
11. Are there any specific market keywords associated with the report?
Yes, the market keyword associated with the report is "TV Intelligent Terminals," which aids in identifying and referencing the specific market segment covered.
12. How do I determine which pricing option suits my needs best?
The pricing options vary based on user requirements and access needs. Individual users may opt for single-user licenses, while businesses requiring broader access may choose multi-user or enterprise licenses for cost-effective access to the report.
13. Are there any additional resources or data provided in the TV Intelligent Terminals report?
While the report offers comprehensive insights, it's advisable to review the specific contents or supplementary materials provided to ascertain if additional resources or data are available.
14. How can I stay updated on further developments or reports in the TV Intelligent Terminals?
To stay informed about further developments, trends, and reports in the TV Intelligent Terminals, consider subscribing to industry newsletters, following relevant companies and organizations, or regularly checking reputable industry news sources and publications.
Methodology
Step 1 - Identification of Relevant Samples Size from Population Database


Step 2 - Approaches for Defining Global Market Size (Value, Volume* & Price*)

Note*: In applicable scenarios
Step 3 - Data Sources
Primary Research
- Web Analytics
- Survey Reports
- Research Institute
- Latest Research Reports
- Opinion Leaders
Secondary Research
- Annual Reports
- White Paper
- Latest Press Release
- Industry Association
- Paid Database
- Investor Presentations

Step 4 - Data Triangulation
Involves using different sources of information in order to increase the validity of a study
These sources are likely to be stakeholders in a program - participants, other researchers, program staff, other community members, and so on.
Then we put all data in single framework & apply various statistical tools to find out the dynamic on the market.
During the analysis stage, feedback from the stakeholder groups would be compared to determine areas of agreement as well as areas of divergence