

Key Insights
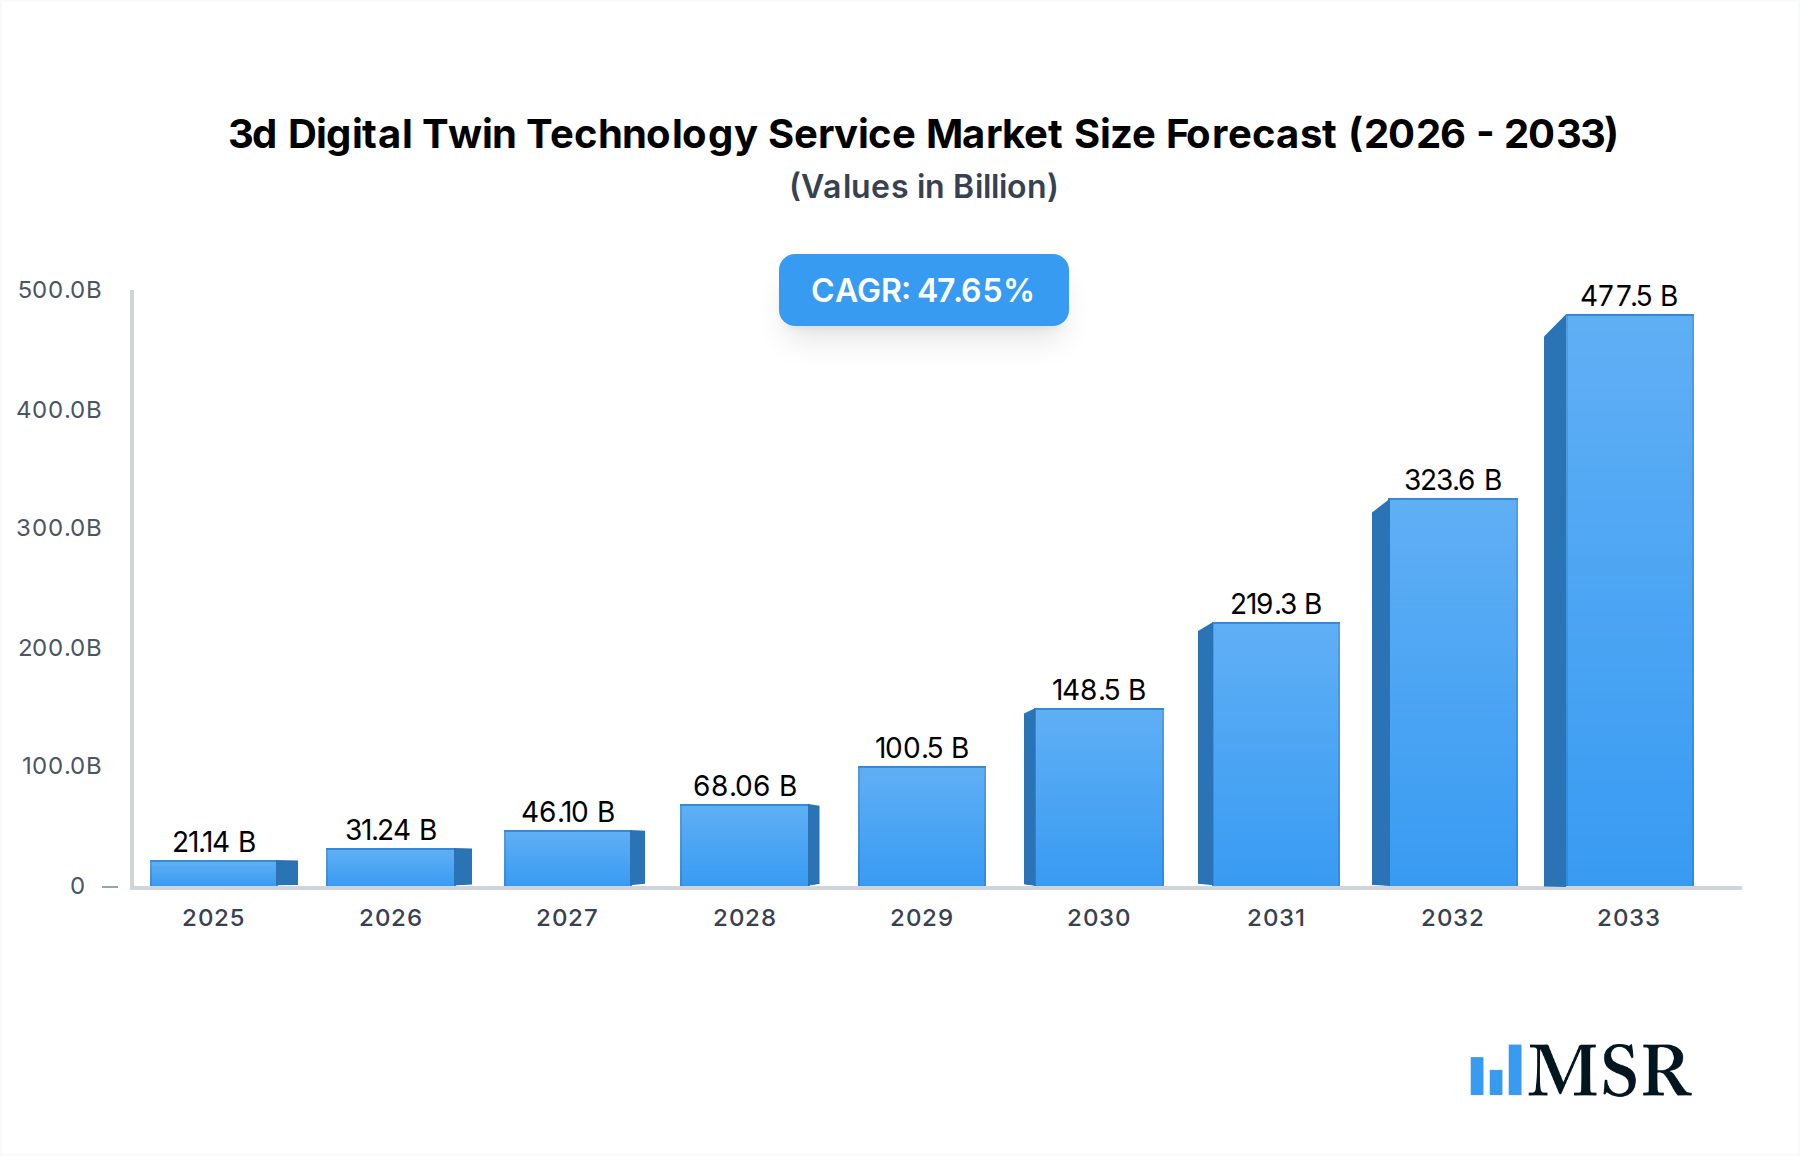
The 3D Digital Twin Technology Service market is experiencing explosive growth, projected to reach a market size of USD 21.14 billion in 2025, driven by an exceptional CAGR of 47.9%. This remarkable expansion is fueled by the increasing adoption of digital twins across a wide array of industries, fundamentally transforming how products are designed, manufactured, operated, and maintained. The technology’s ability to create virtual replicas of physical assets, processes, and systems allows for real-time monitoring, simulation, and predictive analysis, leading to significant improvements in efficiency, cost reduction, and innovation. Key sectors like Automobile Manufacturing, Aircraft Production, and Building Construction are at the forefront of this adoption, leveraging 3D digital twins for design validation, performance optimization, and proactive maintenance.

3d Digital Twin Technology Service Market Size (In Billion)
The burgeoning demand for Product Digital Twins, Process Digital Twins, and System Digital Twins underscores the versatility and pervasive influence of this technology. While the market is characterized by strong growth drivers such as enhanced operational efficiency, reduced downtime, and accelerated product development cycles, certain restraints like the initial investment costs and the need for skilled personnel in implementing and managing digital twin solutions may pose challenges. However, the overwhelming benefits and the continuous technological advancements in areas like AI, IoT, and cloud computing are expected to pave the way for sustained and robust market expansion. Geographically, North America and Europe are expected to lead the market in the near term, with significant contributions from Asia Pacific, driven by rapid industrialization and smart manufacturing initiatives. The competitive landscape is dominated by major technology providers and software companies, who are actively investing in R&D and strategic partnerships to capitalize on this burgeoning market opportunity.
3d Digital Twin Technology Service Company Market Share
This comprehensive report delves into the burgeoning 3D Digital Twin Technology Service Market, analyzing its intricate dynamics, key growth drivers, emerging trends, and competitive landscape. With a forecast period extending from 2025–2033, this study provides invaluable insights for industry stakeholders, investors, and technology providers navigating this rapidly evolving sector. The report encompasses a thorough examination of the market's historical trajectory from 2019–2024, using 2025 as the base and estimated year for current market valuations.
3D Digital Twin Technology Service Market Concentration & Dynamics
The 3D Digital Twin Technology Service Market exhibits a dynamic concentration, characterized by a robust innovation ecosystem driven by leading players such as GE Digital, Dassault Systèmes, Siemens Digital Industries Software, and IBM. These companies are at the forefront of developing advanced product digital twins, process digital twins, and system digital twins to enhance efficiency across sectors like automobile manufacturing, aircraft production, and manufacturing. The regulatory framework is progressively adapting to the advancements in digital twin technology, fostering greater adoption and standardization. Substitute products, while present, often lack the comprehensive, real-time simulation capabilities offered by true digital twins. End-user trends underscore a growing demand for predictive maintenance, optimized operations, and enhanced product lifecycle management. Mergers and acquisitions (M&A) activity is a significant indicator of market consolidation and strategic expansion, with an estimated XX M&A deals recorded during the historical period. The market share distribution reflects a competitive yet collaborative environment, with key players continually investing in research and development to maintain their edge. The market is projected to reach a valuation of over $XXX billion by 2025, with a substantial compound annual growth rate (CAGR).
3D Digital Twin Technology Service Industry Insights & Trends
The 3D Digital Twin Technology Service Industry is on an unprecedented growth trajectory, projected to expand significantly from an estimated $XXX billion in 2025 to over $XXX billion by 2033, demonstrating a compelling CAGR of XX%. This remarkable expansion is fueled by a confluence of powerful market growth drivers, including the escalating need for operational efficiency, cost reduction, and enhanced decision-making across diverse industrial verticals. Technological disruptions are at the heart of this surge, with advancements in Artificial Intelligence (AI), Machine Learning (ML), Internet of Things (IoT), and cloud computing enabling the creation and deployment of increasingly sophisticated and accurate digital twins. The ability to simulate complex scenarios, predict potential failures, and optimize performance in real-time offers unparalleled value. Evolving consumer behaviors, particularly the demand for highly customized products and seamless user experiences, are also indirectly driving the adoption of digital twin technology. Companies are leveraging digital twins to accelerate product development cycles, improve quality control, and provide superior after-sales services. The integration of digital twins is transforming traditional manufacturing processes, enabling smart factories and highly automated production lines. In the automobile manufacturing sector, for instance, digital twins are instrumental in designing, testing, and optimizing vehicle performance and safety. Similarly, in aircraft production, these technologies are crucial for simulating flight conditions, maintaining complex machinery, and ensuring passenger safety. The railcar design and building construction industries are witnessing a paradigm shift with digital twins enabling better planning, construction, and long-term asset management. Furthermore, the power utilities sector is benefiting from digital twins for grid optimization, predictive maintenance of infrastructure, and improved resource allocation. The expanding scope of product digital twins, process digital twins, and system digital twins reflects the versatility and adaptability of this technology to address specific industry challenges. The market's growth is further propelled by the increasing adoption of the "as-a-service" model, making advanced digital twin capabilities more accessible to a wider range of businesses.
Key Markets & Segments Leading 3D Digital Twin Technology Service
The 3D Digital Twin Technology Service Market is experiencing robust growth across multiple key markets and segments, with the Manufacturing sector emerging as a dominant force, driven by its inherent complexity and the critical need for operational optimization. Within Manufacturing, Automobile Manufacturing stands out as a primary adopter, leveraging digital twins for design simulation, virtual prototyping, and real-time production monitoring to enhance efficiency and reduce lead times. The sector's reliance on intricate supply chains and the pursuit of next-generation vehicle technologies further solidify its leadership.
- Drivers of Dominance in Manufacturing:
- Industry 4.0 Adoption: The widespread embrace of Industry 4.0 principles, emphasizing automation, data exchange, and interconnectedness, directly correlates with the adoption of digital twin solutions.
- Predictive Maintenance: The imperative to minimize downtime and maintenance costs is a significant catalyst, with digital twins enabling the proactive identification and resolution of potential equipment failures.
- Product Lifecycle Management (PLM): Digital twins offer a holistic view of a product's lifecycle, from design to end-of-life, facilitating better decision-making and resource management.
- Supply Chain Visibility: Enhanced transparency and optimization of complex global supply chains are crucial, and digital twins provide the necessary tools for real-time tracking and analysis.
Aircraft Production also represents a significant and rapidly growing segment, where the stakes for accuracy and reliability are exceptionally high. The ability to simulate extreme flight conditions, analyze aerodynamic performance, and meticulously manage the complex assembly of aircraft components makes digital twin technology indispensable.
- Drivers of Dominance in Aircraft Production:
- Safety and Reliability: The paramount importance of flight safety necessitates rigorous testing and simulation, which digital twins excel at providing.
- Complex System Integration: Modern aircraft comprise an intricate network of interconnected systems, and digital twins are vital for managing their integration and performance.
- Regulatory Compliance: Stringent aviation regulations demand comprehensive validation and verification processes, which are significantly streamlined by digital twin technology.
Beyond these manufacturing giants, Building Construction is increasingly recognizing the transformative potential of digital twins. From initial design and structural analysis to construction management and ongoing facility maintenance, digital twins are revolutionizing the built environment, promising greater efficiency, reduced waste, and improved building performance over their lifespan. The Power Utilities sector is another critical area where digital twins are making significant inroads, enabling grid optimization, predictive maintenance of critical infrastructure, and the efficient integration of renewable energy sources. The sheer scale and complexity of power grids necessitate advanced simulation and monitoring capabilities that digital twins provide.
The dominance is further segmented by the Type of digital twin:
- Product Digital Twins: Leading the charge, these are essential for designing, testing, and optimizing individual products.
- Process Digital Twins: Crucial for simulating and optimizing manufacturing workflows and operational procedures.
- System Digital Twins: Enabling the holistic simulation and management of complex interconnected systems.
The United States and Germany are identified as leading geographical markets, driven by strong industrial bases, significant R&D investments, and early adoption of advanced technologies. China and other emerging economies are rapidly closing the gap, fueled by substantial government initiatives and a burgeoning manufacturing sector. The overall market is characterized by a synergistic growth pattern where advancements in one segment often catalyze progress in others, creating a self-reinforcing cycle of innovation and adoption.
3D Digital Twin Technology Service Product Developments
Recent product developments in the 3D Digital Twin Technology Service sector are characterized by a rapid evolution towards more integrated, intelligent, and accessible solutions. Companies are focusing on enhancing the fidelity of digital twins, incorporating advanced simulation capabilities powered by AI and ML for more accurate predictions and optimizations. Cloud-native platforms are gaining prominence, offering scalable deployment and collaborative features for distributed teams. Innovations in IoT integration are enabling real-time data ingestion, transforming static models into dynamic, living representations of physical assets. Furthermore, the development of user-friendly interfaces and low-code/no-code development environments is democratizing access to digital twin technology, making it viable for a broader range of industries and applications beyond large enterprises. These advancements are directly translating into improved market relevance, enabling businesses to achieve tangible benefits in areas such as predictive maintenance, optimized operations, and accelerated product development cycles. The competitive edge is increasingly being defined by the speed of deployment, the depth of simulation, and the seamless integration with existing enterprise systems.
Challenges in the 3D Digital Twin Technology Service Market
Despite its immense potential, the 3D Digital Twin Technology Service Market faces several significant challenges that can hinder widespread adoption and growth. The initial investment cost for implementing comprehensive digital twin solutions, including hardware, software, and skilled personnel, can be substantial, posing a barrier for small and medium-sized enterprises (SMEs). Data integration and interoperability remain complex issues, as disparate legacy systems and data silos often make it difficult to create a unified and accurate digital twin. Ensuring data security and privacy is paramount, given the sensitive nature of the information captured and processed by digital twins. Lack of skilled workforce with the expertise in digital twin development, deployment, and data analysis is another critical constraint. Standardization and regulatory frameworks are still evolving, leading to fragmentation and potential compatibility issues across different platforms and solutions. Quantifiable impacts of these challenges can include extended project timelines, increased implementation costs, and slower return on investment.
Forces Driving 3D Digital Twin Technology Service Growth
The 3D Digital Twin Technology Service Market is propelled by a powerful combination of technological, economic, and strategic forces. The relentless advancement of enabling technologies such as Artificial Intelligence (AI), Machine Learning (ML), Internet of Things (IoT), and cloud computing provides the foundational capabilities for creating sophisticated and accurate digital twins. Economically, the demand for enhanced operational efficiency, reduced maintenance costs, and optimized resource allocation across industries is a primary growth driver. Companies are recognizing digital twins as a critical tool for achieving competitive advantages through improved productivity and minimized downtime. Strategically, the growing emphasis on sustainable operations and the circular economy is also fostering the adoption of digital twins for lifecycle management and resource optimization. Furthermore, increasing investments in digital transformation initiatives by governments and corporations worldwide are creating a fertile ground for the proliferation of digital twin technology. The ability of digital twins to provide predictive insights and enable data-driven decision-making is proving to be an invaluable asset in today's complex business environment.
Challenges in the 3D Digital Twin Technology Service Market
The long-term growth catalysts for the 3D Digital Twin Technology Service Market are deeply rooted in continuous innovation and strategic market expansion. Key among these are advancements in AI and ML algorithms, which will enable digital twins to become more autonomous and predictive, moving beyond mere simulation to intelligent self-optimization. The development of open standards and interoperability frameworks will be crucial for fostering wider ecosystem collaboration and reducing integration complexities, thereby accelerating adoption. Strategic partnerships between technology providers, industry giants, and research institutions will drive the development of specialized digital twin solutions tailored to specific industry needs, further unlocking new market segments. Market expansions into emerging economies, coupled with the development of more cost-effective and scalable solutions, will democratize access to this transformative technology, ensuring its widespread integration across the global industrial landscape. The ongoing evolution of data analytics and visualization tools will also play a significant role in enhancing the value proposition of digital twins, making their insights more actionable and user-friendly.
Emerging Opportunities in 3D Digital Twin Technology Service
Emerging opportunities in the 3D Digital Twin Technology Service Market are vast and poised for significant growth. The increasing adoption of digital twins in the Healthcare sector for personalized medicine, surgical planning, and hospital management represents a substantial new frontier. The Smart Cities initiative globally offers a massive opportunity for developing and deploying city-scale digital twins to optimize urban planning, traffic management, and public services. The integration of digital twins with Augmented Reality (AR) and Virtual Reality (VR) technologies is creating immersive experiences for training, remote assistance, and collaborative design, opening up new application areas. Furthermore, the growing focus on sustainability and the circular economy presents an opportunity for digital twins to play a pivotal role in tracking and optimizing the lifecycle of products and materials, reducing waste and promoting resource efficiency. The development of industry-specific digital twin marketplaces and platforms will also foster innovation and provide tailored solutions to diverse business needs.
Leading Players in the 3D Digital Twin Technology Service Sector
- GE Digital
- Dassault Systèmes
- Siemens Digital Industries Software
- Matterport
- SAP
- PTC
- Akselos
- Oracle
- ScaleOut
- Sphera
- Lanner
- IBM
- Accenture
- Capgemini
- Deloitte
- Wipro
Key Milestones in 3D Digital Twin Technology Service Industry
- 2019: Increased adoption of IoT platforms for real-time data integration, enhancing digital twin accuracy.
- 2020: Significant advancements in AI and ML algorithms for predictive analytics within digital twins.
- 2021: Growing focus on cloud-based digital twin solutions for scalability and accessibility.
- 2022: Expansion of digital twin applications into new sectors like healthcare and smart cities.
- 2023: Emergence of industry-specific digital twin platforms and consortia.
- 2024: Increased M&A activity as larger players acquire specialized digital twin technology companies.
Strategic Outlook for 3D Digital Twin Technology Service Market
The strategic outlook for the 3D Digital Twin Technology Service Market is overwhelmingly positive, with significant growth accelerators expected to drive future expansion. The continued integration of AI and ML will lead to more sophisticated predictive capabilities and autonomous optimization. The development of interoperable platforms and open standards will foster greater collaboration and accelerate the adoption cycle across industries. Strategic partnerships, particularly between technology providers and end-users, will be crucial for developing tailored solutions that address specific industry challenges and unlock new market potential. The growing emphasis on sustainability and digital transformation initiatives worldwide will further bolster demand. The market is poised to witness an expansion in services, with a greater focus on end-to-end solutions encompassing implementation, data management, and ongoing optimization. The increasing accessibility of these technologies, driven by cloud-based models and more intuitive interfaces, will democratize their use, making them indispensable tools for businesses seeking to innovate, optimize, and thrive in the digital era.
3d Digital Twin Technology Service Segmentation
-
1. Application
- 1.1. Automobile Manufacturing
- 1.2. Aircraft Production
- 1.3. Railcar Design
- 1.4. Building Construction
- 1.5. Manufacturing
- 1.6. Power Utilities
- 1.7. Others
-
2. Type
- 2.1. Product Digital Twins
- 2.2. Process Digital Twins
- 2.3. System Digital Twins
- 2.4. Others
3d Digital Twin Technology Service Segmentation By Geography
-
1. North America
- 1.1. United States
- 1.2. Canada
- 1.3. Mexico
-
2. South America
- 2.1. Brazil
- 2.2. Argentina
- 2.3. Rest of South America
-
3. Europe
- 3.1. United Kingdom
- 3.2. Germany
- 3.3. France
- 3.4. Italy
- 3.5. Spain
- 3.6. Russia
- 3.7. Benelux
- 3.8. Nordics
- 3.9. Rest of Europe
-
4. Middle East & Africa
- 4.1. Turkey
- 4.2. Israel
- 4.3. GCC
- 4.4. North Africa
- 4.5. South Africa
- 4.6. Rest of Middle East & Africa
-
5. Asia Pacific
- 5.1. China
- 5.2. India
- 5.3. Japan
- 5.4. South Korea
- 5.5. ASEAN
- 5.6. Oceania
- 5.7. Rest of Asia Pacific
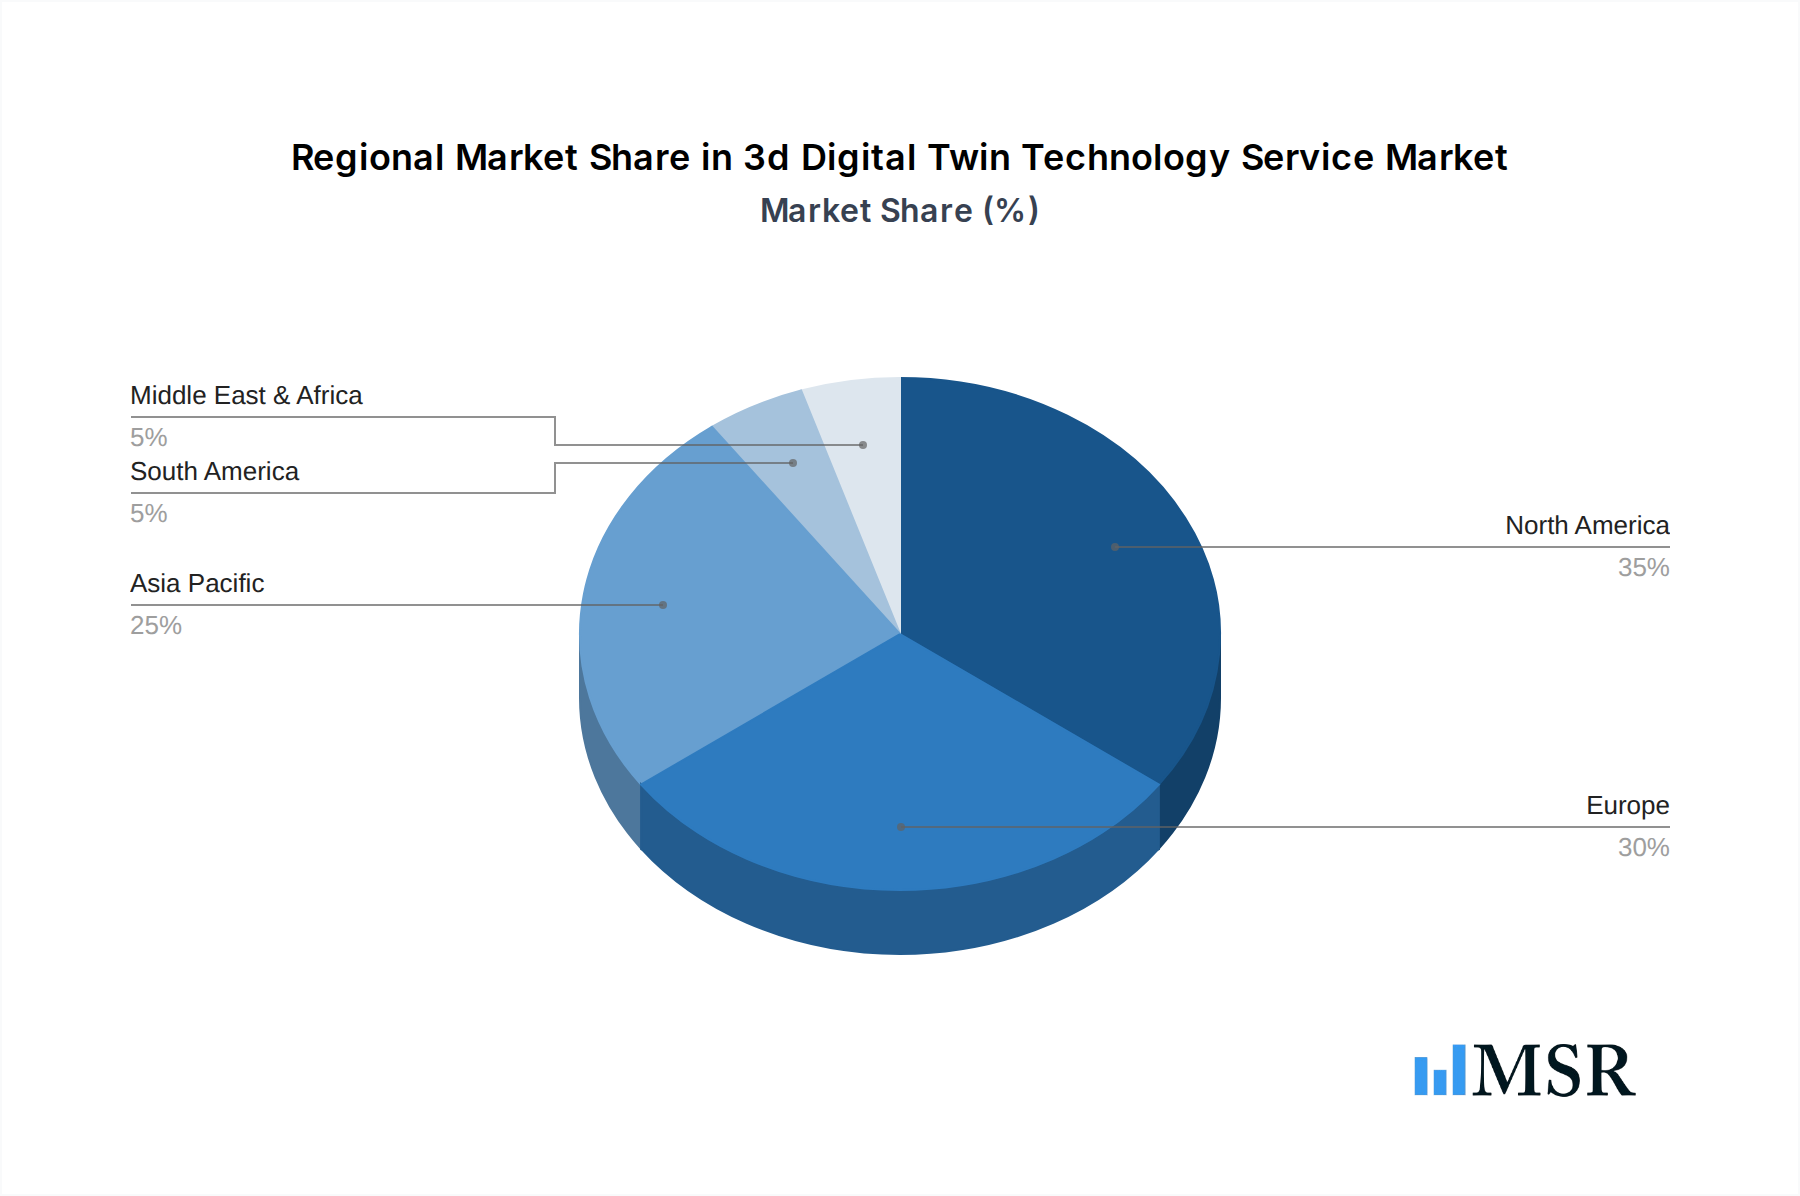
3d Digital Twin Technology Service Regional Market Share
Geographic Coverage of 3d Digital Twin Technology Service
3d Digital Twin Technology Service REPORT HIGHLIGHTS
| Aspects | Details |
|---|---|
| Study Period | 2020-2034 |
| Base Year | 2025 |
| Estimated Year | 2026 |
| Forecast Period | 2026-2034 |
| Historical Period | 2020-2025 |
| Growth Rate | CAGR of 47.9% from 2020-2034 |
| Segmentation |
|
Table of Contents
- 1. Introduction
- 1.1. Research Scope
- 1.2. Market Segmentation
- 1.3. Research Objective
- 1.4. Definitions and Assumptions
- 2. Executive Summary
- 2.1. Market Snapshot
- 3. Market Dynamics
- 3.1. Market Drivers
- 3.2. Market Restrains
- 3.3. Market Trends
- 3.4. Market Opportunities
- 4. Market Factor Analysis
- 4.1. Porters Five Forces
- 4.1.1. Bargaining Power of Suppliers
- 4.1.2. Bargaining Power of Buyers
- 4.1.3. Threat of New Entrants
- 4.1.4. Threat of Substitutes
- 4.1.5. Competitive Rivalry
- 4.2. PESTEL analysis
- 4.3. BCG Analysis
- 4.3.1. Stars (High Growth, High Market Share)
- 4.3.2. Cash Cows (Low Growth, High Market Share)
- 4.3.3. Question Mark (High Growth, Low Market Share)
- 4.3.4. Dogs (Low Growth, Low Market Share)
- 4.4. Ansoff Matrix Analysis
- 4.5. Supply Chain Analysis
- 4.6. Regulatory Landscape
- 4.7. Current Market Potential and Opportunity Assessment (TAM–SAM–SOM Framework)
- 4.8. MSR Analyst Note
- 4.1. Porters Five Forces
- 5. Market Analysis, Insights and Forecast 2021-2033
- 5.1. Market Analysis, Insights and Forecast - by Application
- 5.1.1. Automobile Manufacturing
- 5.1.2. Aircraft Production
- 5.1.3. Railcar Design
- 5.1.4. Building Construction
- 5.1.5. Manufacturing
- 5.1.6. Power Utilities
- 5.1.7. Others
- 5.2. Market Analysis, Insights and Forecast - by Type
- 5.2.1. Product Digital Twins
- 5.2.2. Process Digital Twins
- 5.2.3. System Digital Twins
- 5.2.4. Others
- 5.3. Market Analysis, Insights and Forecast - by Region
- 5.3.1. North America
- 5.3.2. South America
- 5.3.3. Europe
- 5.3.4. Middle East & Africa
- 5.3.5. Asia Pacific
- 5.1. Market Analysis, Insights and Forecast - by Application
- 6. Global 3d Digital Twin Technology Service Analysis, Insights and Forecast, 2021-2033
- 6.1. Market Analysis, Insights and Forecast - by Application
- 6.1.1. Automobile Manufacturing
- 6.1.2. Aircraft Production
- 6.1.3. Railcar Design
- 6.1.4. Building Construction
- 6.1.5. Manufacturing
- 6.1.6. Power Utilities
- 6.1.7. Others
- 6.2. Market Analysis, Insights and Forecast - by Type
- 6.2.1. Product Digital Twins
- 6.2.2. Process Digital Twins
- 6.2.3. System Digital Twins
- 6.2.4. Others
- 6.1. Market Analysis, Insights and Forecast - by Application
- 7. North America 3d Digital Twin Technology Service Analysis, Insights and Forecast, 2020-2032
- 7.1. Market Analysis, Insights and Forecast - by Application
- 7.1.1. Automobile Manufacturing
- 7.1.2. Aircraft Production
- 7.1.3. Railcar Design
- 7.1.4. Building Construction
- 7.1.5. Manufacturing
- 7.1.6. Power Utilities
- 7.1.7. Others
- 7.2. Market Analysis, Insights and Forecast - by Type
- 7.2.1. Product Digital Twins
- 7.2.2. Process Digital Twins
- 7.2.3. System Digital Twins
- 7.2.4. Others
- 7.1. Market Analysis, Insights and Forecast - by Application
- 8. South America 3d Digital Twin Technology Service Analysis, Insights and Forecast, 2020-2032
- 8.1. Market Analysis, Insights and Forecast - by Application
- 8.1.1. Automobile Manufacturing
- 8.1.2. Aircraft Production
- 8.1.3. Railcar Design
- 8.1.4. Building Construction
- 8.1.5. Manufacturing
- 8.1.6. Power Utilities
- 8.1.7. Others
- 8.2. Market Analysis, Insights and Forecast - by Type
- 8.2.1. Product Digital Twins
- 8.2.2. Process Digital Twins
- 8.2.3. System Digital Twins
- 8.2.4. Others
- 8.1. Market Analysis, Insights and Forecast - by Application
- 9. Europe 3d Digital Twin Technology Service Analysis, Insights and Forecast, 2020-2032
- 9.1. Market Analysis, Insights and Forecast - by Application
- 9.1.1. Automobile Manufacturing
- 9.1.2. Aircraft Production
- 9.1.3. Railcar Design
- 9.1.4. Building Construction
- 9.1.5. Manufacturing
- 9.1.6. Power Utilities
- 9.1.7. Others
- 9.2. Market Analysis, Insights and Forecast - by Type
- 9.2.1. Product Digital Twins
- 9.2.2. Process Digital Twins
- 9.2.3. System Digital Twins
- 9.2.4. Others
- 9.1. Market Analysis, Insights and Forecast - by Application
- 10. Middle East & Africa 3d Digital Twin Technology Service Analysis, Insights and Forecast, 2020-2032
- 10.1. Market Analysis, Insights and Forecast - by Application
- 10.1.1. Automobile Manufacturing
- 10.1.2. Aircraft Production
- 10.1.3. Railcar Design
- 10.1.4. Building Construction
- 10.1.5. Manufacturing
- 10.1.6. Power Utilities
- 10.1.7. Others
- 10.2. Market Analysis, Insights and Forecast - by Type
- 10.2.1. Product Digital Twins
- 10.2.2. Process Digital Twins
- 10.2.3. System Digital Twins
- 10.2.4. Others
- 10.1. Market Analysis, Insights and Forecast - by Application
- 11. Asia Pacific 3d Digital Twin Technology Service Analysis, Insights and Forecast, 2020-2032
- 11.1. Market Analysis, Insights and Forecast - by Application
- 11.1.1. Automobile Manufacturing
- 11.1.2. Aircraft Production
- 11.1.3. Railcar Design
- 11.1.4. Building Construction
- 11.1.5. Manufacturing
- 11.1.6. Power Utilities
- 11.1.7. Others
- 11.2. Market Analysis, Insights and Forecast - by Type
- 11.2.1. Product Digital Twins
- 11.2.2. Process Digital Twins
- 11.2.3. System Digital Twins
- 11.2.4. Others
- 11.1. Market Analysis, Insights and Forecast - by Application
- 12. Competitive Analysis
- 12.1. Company Profiles
- 12.1.1 GE Digital
- 12.1.1.1. Company Overview
- 12.1.1.2. Products
- 12.1.1.3. Company Financials
- 12.1.1.4. SWOT Analysis
- 12.1.2 Dassault Systèmes
- 12.1.2.1. Company Overview
- 12.1.2.2. Products
- 12.1.2.3. Company Financials
- 12.1.2.4. SWOT Analysis
- 12.1.3 Siemens Digital Industries Software
- 12.1.3.1. Company Overview
- 12.1.3.2. Products
- 12.1.3.3. Company Financials
- 12.1.3.4. SWOT Analysis
- 12.1.4 Matterport
- 12.1.4.1. Company Overview
- 12.1.4.2. Products
- 12.1.4.3. Company Financials
- 12.1.4.4. SWOT Analysis
- 12.1.5 SAP
- 12.1.5.1. Company Overview
- 12.1.5.2. Products
- 12.1.5.3. Company Financials
- 12.1.5.4. SWOT Analysis
- 12.1.6 PTC
- 12.1.6.1. Company Overview
- 12.1.6.2. Products
- 12.1.6.3. Company Financials
- 12.1.6.4. SWOT Analysis
- 12.1.7 Akselos
- 12.1.7.1. Company Overview
- 12.1.7.2. Products
- 12.1.7.3. Company Financials
- 12.1.7.4. SWOT Analysis
- 12.1.8 Oracle
- 12.1.8.1. Company Overview
- 12.1.8.2. Products
- 12.1.8.3. Company Financials
- 12.1.8.4. SWOT Analysis
- 12.1.9 ScaleOut
- 12.1.9.1. Company Overview
- 12.1.9.2. Products
- 12.1.9.3. Company Financials
- 12.1.9.4. SWOT Analysis
- 12.1.10 Sphera
- 12.1.10.1. Company Overview
- 12.1.10.2. Products
- 12.1.10.3. Company Financials
- 12.1.10.4. SWOT Analysis
- 12.1.11 Lanner
- 12.1.11.1. Company Overview
- 12.1.11.2. Products
- 12.1.11.3. Company Financials
- 12.1.11.4. SWOT Analysis
- 12.1.12 IBM
- 12.1.12.1. Company Overview
- 12.1.12.2. Products
- 12.1.12.3. Company Financials
- 12.1.12.4. SWOT Analysis
- 12.1.13 Accenture
- 12.1.13.1. Company Overview
- 12.1.13.2. Products
- 12.1.13.3. Company Financials
- 12.1.13.4. SWOT Analysis
- 12.1.14 Capgemini
- 12.1.14.1. Company Overview
- 12.1.14.2. Products
- 12.1.14.3. Company Financials
- 12.1.14.4. SWOT Analysis
- 12.1.15 Deloitte
- 12.1.15.1. Company Overview
- 12.1.15.2. Products
- 12.1.15.3. Company Financials
- 12.1.15.4. SWOT Analysis
- 12.1.16 Wipro
- 12.1.16.1. Company Overview
- 12.1.16.2. Products
- 12.1.16.3. Company Financials
- 12.1.16.4. SWOT Analysis
- 12.1.1 GE Digital
- 12.2. Market Entropy
- 12.2.1 Company's Key Areas Served
- 12.2.2 Recent Developments
- 12.3. Company Market Share Analysis 2025
- 12.3.1 Top 5 Companies Market Share Analysis
- 12.3.2 Top 3 Companies Market Share Analysis
- 12.4. List of Potential Customers
- 13. Research Methodology
List of Figures
- Figure 1: Global 3d Digital Twin Technology Service Revenue Breakdown (undefined, %) by Region 2025 & 2033
- Figure 2: North America 3d Digital Twin Technology Service Revenue (undefined), by Application 2025 & 2033
- Figure 3: North America 3d Digital Twin Technology Service Revenue Share (%), by Application 2025 & 2033
- Figure 4: North America 3d Digital Twin Technology Service Revenue (undefined), by Type 2025 & 2033
- Figure 5: North America 3d Digital Twin Technology Service Revenue Share (%), by Type 2025 & 2033
- Figure 6: North America 3d Digital Twin Technology Service Revenue (undefined), by Country 2025 & 2033
- Figure 7: North America 3d Digital Twin Technology Service Revenue Share (%), by Country 2025 & 2033
- Figure 8: South America 3d Digital Twin Technology Service Revenue (undefined), by Application 2025 & 2033
- Figure 9: South America 3d Digital Twin Technology Service Revenue Share (%), by Application 2025 & 2033
- Figure 10: South America 3d Digital Twin Technology Service Revenue (undefined), by Type 2025 & 2033
- Figure 11: South America 3d Digital Twin Technology Service Revenue Share (%), by Type 2025 & 2033
- Figure 12: South America 3d Digital Twin Technology Service Revenue (undefined), by Country 2025 & 2033
- Figure 13: South America 3d Digital Twin Technology Service Revenue Share (%), by Country 2025 & 2033
- Figure 14: Europe 3d Digital Twin Technology Service Revenue (undefined), by Application 2025 & 2033
- Figure 15: Europe 3d Digital Twin Technology Service Revenue Share (%), by Application 2025 & 2033
- Figure 16: Europe 3d Digital Twin Technology Service Revenue (undefined), by Type 2025 & 2033
- Figure 17: Europe 3d Digital Twin Technology Service Revenue Share (%), by Type 2025 & 2033
- Figure 18: Europe 3d Digital Twin Technology Service Revenue (undefined), by Country 2025 & 2033
- Figure 19: Europe 3d Digital Twin Technology Service Revenue Share (%), by Country 2025 & 2033
- Figure 20: Middle East & Africa 3d Digital Twin Technology Service Revenue (undefined), by Application 2025 & 2033
- Figure 21: Middle East & Africa 3d Digital Twin Technology Service Revenue Share (%), by Application 2025 & 2033
- Figure 22: Middle East & Africa 3d Digital Twin Technology Service Revenue (undefined), by Type 2025 & 2033
- Figure 23: Middle East & Africa 3d Digital Twin Technology Service Revenue Share (%), by Type 2025 & 2033
- Figure 24: Middle East & Africa 3d Digital Twin Technology Service Revenue (undefined), by Country 2025 & 2033
- Figure 25: Middle East & Africa 3d Digital Twin Technology Service Revenue Share (%), by Country 2025 & 2033
- Figure 26: Asia Pacific 3d Digital Twin Technology Service Revenue (undefined), by Application 2025 & 2033
- Figure 27: Asia Pacific 3d Digital Twin Technology Service Revenue Share (%), by Application 2025 & 2033
- Figure 28: Asia Pacific 3d Digital Twin Technology Service Revenue (undefined), by Type 2025 & 2033
- Figure 29: Asia Pacific 3d Digital Twin Technology Service Revenue Share (%), by Type 2025 & 2033
- Figure 30: Asia Pacific 3d Digital Twin Technology Service Revenue (undefined), by Country 2025 & 2033
- Figure 31: Asia Pacific 3d Digital Twin Technology Service Revenue Share (%), by Country 2025 & 2033
List of Tables
- Table 1: Global 3d Digital Twin Technology Service Revenue undefined Forecast, by Application 2020 & 2033
- Table 2: Global 3d Digital Twin Technology Service Revenue undefined Forecast, by Type 2020 & 2033
- Table 3: Global 3d Digital Twin Technology Service Revenue undefined Forecast, by Region 2020 & 2033
- Table 4: Global 3d Digital Twin Technology Service Revenue undefined Forecast, by Application 2020 & 2033
- Table 5: Global 3d Digital Twin Technology Service Revenue undefined Forecast, by Type 2020 & 2033
- Table 6: Global 3d Digital Twin Technology Service Revenue undefined Forecast, by Country 2020 & 2033
- Table 7: United States 3d Digital Twin Technology Service Revenue (undefined) Forecast, by Application 2020 & 2033
- Table 8: Canada 3d Digital Twin Technology Service Revenue (undefined) Forecast, by Application 2020 & 2033
- Table 9: Mexico 3d Digital Twin Technology Service Revenue (undefined) Forecast, by Application 2020 & 2033
- Table 10: Global 3d Digital Twin Technology Service Revenue undefined Forecast, by Application 2020 & 2033
- Table 11: Global 3d Digital Twin Technology Service Revenue undefined Forecast, by Type 2020 & 2033
- Table 12: Global 3d Digital Twin Technology Service Revenue undefined Forecast, by Country 2020 & 2033
- Table 13: Brazil 3d Digital Twin Technology Service Revenue (undefined) Forecast, by Application 2020 & 2033
- Table 14: Argentina 3d Digital Twin Technology Service Revenue (undefined) Forecast, by Application 2020 & 2033
- Table 15: Rest of South America 3d Digital Twin Technology Service Revenue (undefined) Forecast, by Application 2020 & 2033
- Table 16: Global 3d Digital Twin Technology Service Revenue undefined Forecast, by Application 2020 & 2033
- Table 17: Global 3d Digital Twin Technology Service Revenue undefined Forecast, by Type 2020 & 2033
- Table 18: Global 3d Digital Twin Technology Service Revenue undefined Forecast, by Country 2020 & 2033
- Table 19: United Kingdom 3d Digital Twin Technology Service Revenue (undefined) Forecast, by Application 2020 & 2033
- Table 20: Germany 3d Digital Twin Technology Service Revenue (undefined) Forecast, by Application 2020 & 2033
- Table 21: France 3d Digital Twin Technology Service Revenue (undefined) Forecast, by Application 2020 & 2033
- Table 22: Italy 3d Digital Twin Technology Service Revenue (undefined) Forecast, by Application 2020 & 2033
- Table 23: Spain 3d Digital Twin Technology Service Revenue (undefined) Forecast, by Application 2020 & 2033
- Table 24: Russia 3d Digital Twin Technology Service Revenue (undefined) Forecast, by Application 2020 & 2033
- Table 25: Benelux 3d Digital Twin Technology Service Revenue (undefined) Forecast, by Application 2020 & 2033
- Table 26: Nordics 3d Digital Twin Technology Service Revenue (undefined) Forecast, by Application 2020 & 2033
- Table 27: Rest of Europe 3d Digital Twin Technology Service Revenue (undefined) Forecast, by Application 2020 & 2033
- Table 28: Global 3d Digital Twin Technology Service Revenue undefined Forecast, by Application 2020 & 2033
- Table 29: Global 3d Digital Twin Technology Service Revenue undefined Forecast, by Type 2020 & 2033
- Table 30: Global 3d Digital Twin Technology Service Revenue undefined Forecast, by Country 2020 & 2033
- Table 31: Turkey 3d Digital Twin Technology Service Revenue (undefined) Forecast, by Application 2020 & 2033
- Table 32: Israel 3d Digital Twin Technology Service Revenue (undefined) Forecast, by Application 2020 & 2033
- Table 33: GCC 3d Digital Twin Technology Service Revenue (undefined) Forecast, by Application 2020 & 2033
- Table 34: North Africa 3d Digital Twin Technology Service Revenue (undefined) Forecast, by Application 2020 & 2033
- Table 35: South Africa 3d Digital Twin Technology Service Revenue (undefined) Forecast, by Application 2020 & 2033
- Table 36: Rest of Middle East & Africa 3d Digital Twin Technology Service Revenue (undefined) Forecast, by Application 2020 & 2033
- Table 37: Global 3d Digital Twin Technology Service Revenue undefined Forecast, by Application 2020 & 2033
- Table 38: Global 3d Digital Twin Technology Service Revenue undefined Forecast, by Type 2020 & 2033
- Table 39: Global 3d Digital Twin Technology Service Revenue undefined Forecast, by Country 2020 & 2033
- Table 40: China 3d Digital Twin Technology Service Revenue (undefined) Forecast, by Application 2020 & 2033
- Table 41: India 3d Digital Twin Technology Service Revenue (undefined) Forecast, by Application 2020 & 2033
- Table 42: Japan 3d Digital Twin Technology Service Revenue (undefined) Forecast, by Application 2020 & 2033
- Table 43: South Korea 3d Digital Twin Technology Service Revenue (undefined) Forecast, by Application 2020 & 2033
- Table 44: ASEAN 3d Digital Twin Technology Service Revenue (undefined) Forecast, by Application 2020 & 2033
- Table 45: Oceania 3d Digital Twin Technology Service Revenue (undefined) Forecast, by Application 2020 & 2033
- Table 46: Rest of Asia Pacific 3d Digital Twin Technology Service Revenue (undefined) Forecast, by Application 2020 & 2033
Frequently Asked Questions
1. What is the projected Compound Annual Growth Rate (CAGR) of the 3d Digital Twin Technology Service?
The projected CAGR is approximately 47.9%.
2. Which companies are prominent players in the 3d Digital Twin Technology Service?
Key companies in the market include GE Digital, Dassault Systèmes, Siemens Digital Industries Software, Matterport, SAP, PTC, Akselos, Oracle, ScaleOut, Sphera, Lanner, IBM, Accenture, Capgemini, Deloitte, Wipro.
3. What are the main segments of the 3d Digital Twin Technology Service?
The market segments include Application, Type.
4. Can you provide details about the market size?
The market size is estimated to be USD XXX N/A as of 2022.
5. What are some drivers contributing to market growth?
N/A
6. What are the notable trends driving market growth?
N/A
7. Are there any restraints impacting market growth?
N/A
8. Can you provide examples of recent developments in the market?
N/A
9. What pricing options are available for accessing the report?
Pricing options include single-user, multi-user, and enterprise licenses priced at USD 3950.00, USD 5925.00, and USD 7900.00 respectively.
10. Is the market size provided in terms of value or volume?
The market size is provided in terms of value, measured in N/A.
11. Are there any specific market keywords associated with the report?
Yes, the market keyword associated with the report is "3d Digital Twin Technology Service," which aids in identifying and referencing the specific market segment covered.
12. How do I determine which pricing option suits my needs best?
The pricing options vary based on user requirements and access needs. Individual users may opt for single-user licenses, while businesses requiring broader access may choose multi-user or enterprise licenses for cost-effective access to the report.
13. Are there any additional resources or data provided in the 3d Digital Twin Technology Service report?
While the report offers comprehensive insights, it's advisable to review the specific contents or supplementary materials provided to ascertain if additional resources or data are available.
14. How can I stay updated on further developments or reports in the 3d Digital Twin Technology Service?
To stay informed about further developments, trends, and reports in the 3d Digital Twin Technology Service, consider subscribing to industry newsletters, following relevant companies and organizations, or regularly checking reputable industry news sources and publications.
Methodology
Step 1 - Identification of Relevant Samples Size from Population Database


Step 2 - Approaches for Defining Global Market Size (Value, Volume* & Price*)

Note*: In applicable scenarios
Step 3 - Data Sources
Primary Research
- Web Analytics
- Survey Reports
- Research Institute
- Latest Research Reports
- Opinion Leaders
Secondary Research
- Annual Reports
- White Paper
- Latest Press Release
- Industry Association
- Paid Database
- Investor Presentations

Step 4 - Data Triangulation
Involves using different sources of information in order to increase the validity of a study
These sources are likely to be stakeholders in a program - participants, other researchers, program staff, other community members, and so on.
Then we put all data in single framework & apply various statistical tools to find out the dynamic on the market.
During the analysis stage, feedback from the stakeholder groups would be compared to determine areas of agreement as well as areas of divergence