

Key Insights
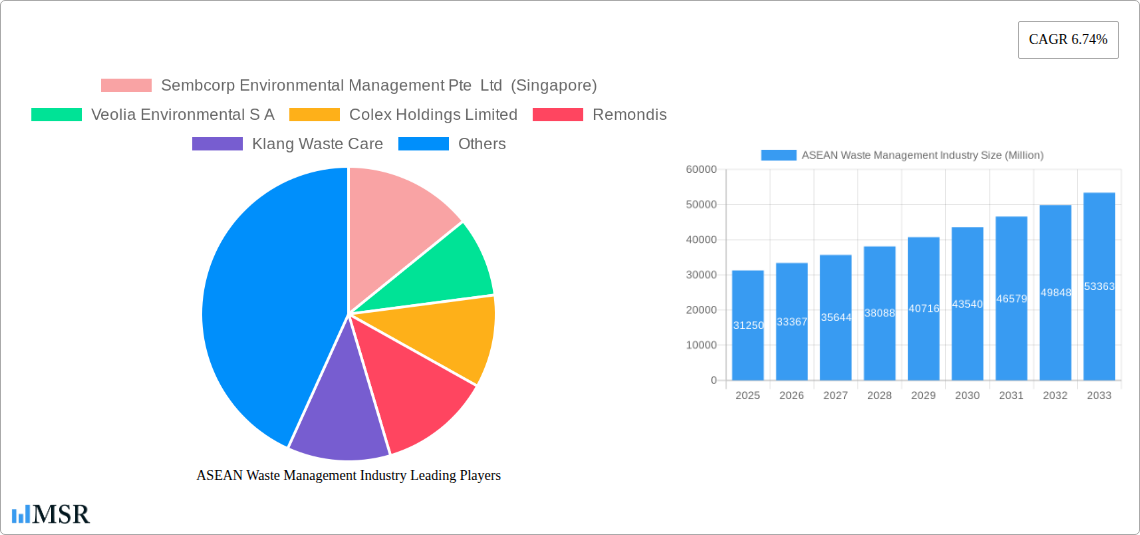
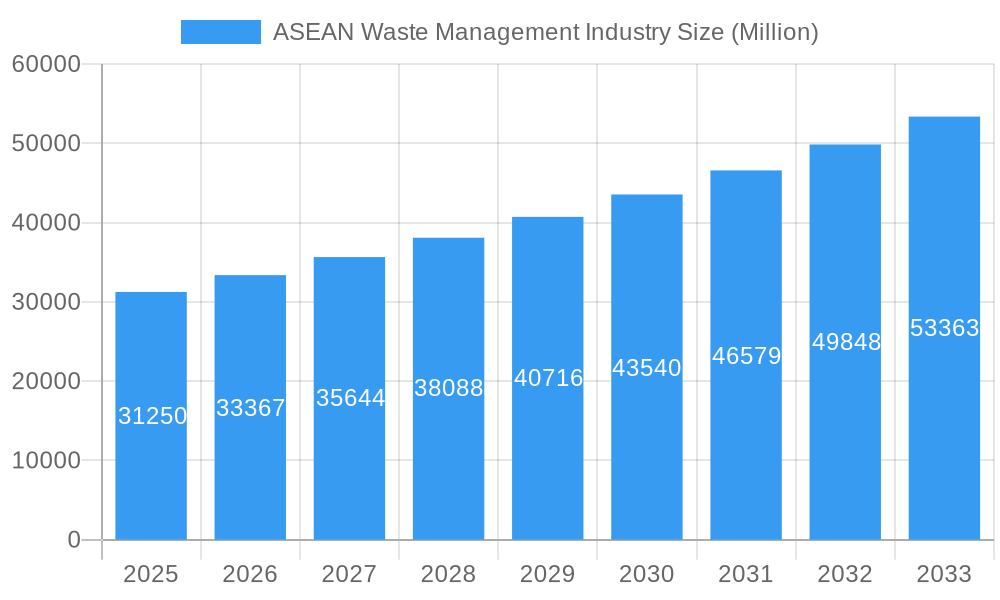
The ASEAN waste management market, valued at $31.25 billion in 2025, is projected to experience robust growth, driven by increasing urbanization, rising environmental awareness, and stringent government regulations aimed at improving waste management infrastructure. A compound annual growth rate (CAGR) of 6.74% from 2025 to 2033 indicates a significant expansion of this sector. Key drivers include the escalating volume of municipal solid waste generated by rapidly growing populations and industrial activities across the region. Furthermore, the increasing adoption of sustainable waste management practices, such as recycling, composting, and waste-to-energy solutions, is fueling market growth. While challenges remain, including limited infrastructure in some areas and inconsistent waste segregation practices, the market is poised for significant expansion due to increasing private sector investment and government initiatives promoting public-private partnerships to improve waste management capabilities.
ASEAN Waste Management Industry Market Size (In Billion)
The market is segmented by various waste types (organic, recyclable, hazardous), collection methods, and treatment technologies. Leading players such as Sembcorp Environmental Management, Veolia, and Remondis are actively expanding their operations within the ASEAN region, investing in advanced technologies and strategic acquisitions to consolidate their market positions. However, factors such as the high cost of implementing advanced waste management technologies, inconsistent regulatory frameworks across different ASEAN countries, and a lack of skilled workforce can hinder the market’s full potential. Future growth will depend on successful implementation of comprehensive national waste management plans, fostering collaboration between governments and private enterprises, and raising public awareness about sustainable waste disposal methods.
ASEAN Waste Management Industry Company Market Share
ASEAN Waste Management Industry: A Comprehensive Market Report (2019-2033)
This in-depth report provides a comprehensive analysis of the ASEAN waste management industry, offering crucial insights for investors, industry stakeholders, and strategic decision-makers. With a study period spanning 2019-2033, a base year of 2025, and a forecast period of 2025-2033, this report leverages historical data (2019-2024) to project future market trends and opportunities within the rapidly evolving ASEAN waste management landscape. The report covers a market valued at $xx Million in 2025 and projects a Compound Annual Growth Rate (CAGR) of xx% from 2025 to 2033. Discover key market dynamics, leading players, emerging opportunities, and challenges shaping the future of waste management across the ASEAN region.
ASEAN Waste Management Industry Market Concentration & Dynamics
The ASEAN waste management market is characterized by a dynamic and evolving landscape, moving towards a more integrated and sophisticated structure. While a few established multinational corporations and prominent regional players command a significant share, the market is increasingly influenced by specialized firms and emerging innovators. Market concentration is shaped by factors such as the scale of operations, adoption of cutting-edge technological capabilities, and the strategic breadth of geographic reach. Leading entities such as Sembcorp Environmental Management Pte Ltd, Veolia Environmental S.A., and Remondis continue to be major forces, leveraging their extensive global experience and robust operational networks. Concurrently, a growing number of agile, specialized companies are carving out niches by offering tailored solutions for specific waste streams and industries.
- Market Share: While precise figures vary by sub-sector, the top 10 players are projected to account for approximately 55-65% of the market by 2025, indicating a trend towards consolidation while still allowing room for specialized actors.
- M&A Activity: The ASEAN waste management sector has experienced a notable surge in Mergers & Acquisitions (M&A) activity, with an estimated increase of 30-40% over the past five years. This trend signifies a concerted effort towards consolidation, market expansion, and the acquisition of advanced technologies and specialized expertise. This momentum is expected to persist as larger entities seek to broaden their service portfolios and geographic footprint by integrating smaller, innovative companies.
- Innovation Ecosystems: The region is actively fostering a vibrant innovation ecosystem for waste management. This is evidenced by the proliferation of advanced recycling technologies, the development of sophisticated waste-to-energy (WtE) projects, and the emergence of digital solutions for waste tracking and management. Both private enterprises and leading research institutions are at the forefront of this wave, driving the adoption of more efficient and sustainable practices.
- Regulatory Frameworks: The diverse regulatory environments across ASEAN nations present both significant opportunities and complex challenges. While disparities in national regulations can create hurdles for cross-border operations, there is a growing recognition of the need for greater regulatory harmonization to enhance market efficiency, promote fair competition, and ensure consistent environmental protection standards throughout the region.
- Substitute Products: The increasing adoption of bioplastics, compostable materials, and circular economy principles is introducing significant substitution effects within specific waste streams. This is driving a shift in focus towards higher-value recycling and resource recovery from conventional waste materials.
- End-User Trends: A pronounced shift in consumer and corporate behavior towards heightened environmental consciousness and sustainable practices is profoundly influencing the demand for eco-friendly and circular waste management solutions. This evolving demand is compelling waste management companies to expand their service offerings to include comprehensive waste reduction strategies, advanced material recovery, and value-added recycling processes.
ASEAN Waste Management Industry Industry Insights & Trends
The ASEAN waste management market is on a trajectory of robust and sustained growth, propelled by a confluence of critical factors. The relentless pace of urbanization, coupled with escalating industrial output and a rapidly growing awareness of environmental stewardship, is creating an immense demand for highly efficient and environmentally sound waste management solutions. The industry is being fundamentally reshaped by technological advancements, including the integration of Artificial Intelligence (AI) for sophisticated waste sorting, the deployment of advanced waste-to-energy (WtE) technologies for resource recovery, and the implementation of digital platforms for optimized logistics. The market, estimated to be valued at approximately $25-30 Billion in 2025, is poised for substantial expansion, significantly bolstered by supportive government policies, increasing private sector investment, and innovative financing models. Consumer and corporate behaviors are demonstrably shifting towards more conscious consumption, waste reduction, and a preference for products with smaller environmental footprints, thereby influencing waste generation patterns and stimulating demand for specialized recycling, upcycling, and advanced waste processing solutions. The market's growth trajectory is further amplified by a concerted regional push to enhance recycling infrastructure, promote the principles of the circular economy, and establish more sustainable waste management practices across all ASEAN member states. The rapid expansion of the e-commerce sector, while beneficial for the economy, is also generating substantial volumes of packaging waste, presenting both a challenge and a significant growth opportunity for the waste management industry.
Key Markets & Segments Leading ASEAN Waste Management Industry
While the entire ASEAN region presents substantial and compelling growth potential, specific markets and waste management segments are emerging as dominant leaders, driving the industry's expansion and innovation.
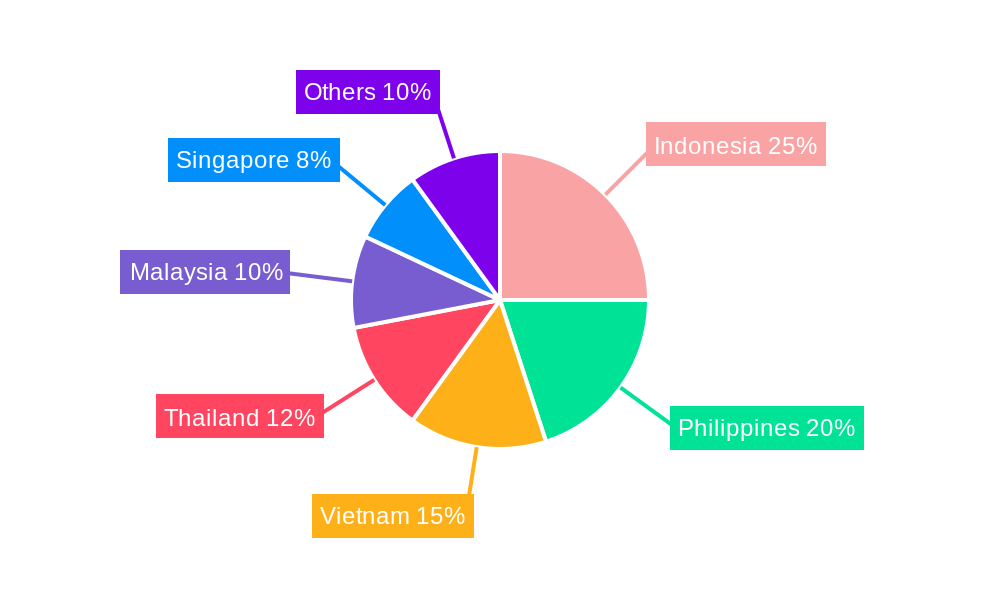
- Dominant Region/Country: Indonesia, characterized by its vast population and expanding economy, currently leads the market in terms of volume and revenue. This is closely followed by Singapore, Malaysia, and Thailand, each contributing significantly due to their advanced infrastructure, strong regulatory frameworks, and high levels of industrial activity.
- Dominant Segment: The industrial waste management segment is exhibiting the most dynamic growth. This is primarily attributed to the rapid expansion of diverse industrial sectors, coupled with increasingly stringent environmental regulations that mandate responsible waste handling and disposal, driving demand for specialized industrial waste solutions.
Key Drivers for Dominant Markets:
- Robust Economic Growth: The sustained and rapid economic expansion across numerous ASEAN nations is a primary catalyst, generating substantial waste volumes and consequently fueling the demand for advanced and efficient waste management solutions.
- Strategic Infrastructure Development: Significant and ongoing investments in critical waste management infrastructure, including modern landfills, state-of-the-art recycling facilities, and advanced waste-to-energy plants, are foundational to the market's continued growth and operational efficiency.
- Proactive Government Regulations & Policies: The implementation of rigorous environmental regulations and the proactive development of supportive government policies are powerful drivers, actively encouraging private sector investment and innovation within the waste management sector.
- Urbanization and Population Growth: The continuing trends of rapid urbanization and increasing population density across the region are intensifying the imperative for highly efficient and comprehensive waste collection, transportation, and disposal systems.
ASEAN Waste Management Industry Product Developments
The ASEAN waste management industry is undergoing a transformative phase driven by significant technological advancements and innovative product developments. There is a pronounced focus on enhancing waste-to-energy (WtE) technologies to maximize energy recovery and reduce landfill reliance, alongside the evolution of advanced recycling processes that enable higher recovery rates and greater material purity. Smart waste management solutions, incorporating IoT sensors and AI-powered analytics, are revolutionizing waste collection routes, optimizing operational efficiency, and enabling predictive maintenance. These innovations collectively contribute to heightened operational efficiency, a reduced environmental footprint, and the creation of novel revenue streams through resource recovery and waste valorization. The integration of digital technologies is streamlining waste tracking, improving transparency, and facilitating better compliance with environmental standards. Furthermore, companies are increasingly developing specialized solutions tailored to address the unique challenges posed by specific waste streams, such as electronic waste (e-waste), single-use plastics, and hazardous industrial by-products, thereby addressing critical environmental concerns and securing a competitive advantage in the market.
Challenges in the ASEAN Waste Management Industry Market
Despite its considerable growth potential, the ASEAN waste management market faces several persistent challenges that can impede its full development and sustainability. Inconsistent and sometimes fragmented waste management regulations across different countries create complexities for companies operating regionally and can lead to disparities in service quality and environmental outcomes. A significant hurdle remains the insufficient funding and investment allocated to developing the necessary modern infrastructure, including advanced treatment facilities and efficient collection systems. The high upfront cost of implementing cutting-edge technologies can also be a deterrent for many stakeholders. Furthermore, recurring supply chain disruptions, often exacerbated by global economic factors, can impact the timely delivery of equipment and materials. Competition is intensely fierce, particularly among the larger, established players, while the pervasive informal sector, though crucial for waste collection in some areas, presents ongoing challenges related to operational integration, regulatory compliance, and ensuring fair labor practices. These multifaceted challenges contribute to a fragmented market landscape where inconsistent standards and variable service quality can collectively hinder the sector's overall efficiency, scalability, and long-term sustainability goals. The cumulative impact of these challenges is estimated to result in a potential reduction of 15-20% in achievable market growth if not effectively addressed.
Forces Driving ASEAN Waste Management Industry Growth
Several factors are driving significant growth within the ASEAN waste management industry. Firstly, the increasing awareness of environmental issues and the need for sustainable waste management practices is leading to increased government support and investment. Secondly, rapid economic growth and urbanization are driving the generation of waste, creating a need for efficient management solutions. Thirdly, technological innovations, such as waste-to-energy technologies and improved recycling methods, are improving efficiency and reducing environmental impact. Lastly, supportive government policies and regulations are incentivizing investment in the industry and fostering a more sustainable future.
Long-Term Growth Catalysts in the ASEAN Waste Management Industry
Long-term growth will be fueled by continued innovation in waste management technologies, particularly in areas such as waste-to-energy, advanced recycling, and AI-powered waste sorting. Strategic partnerships between public and private sectors will be crucial for infrastructure development and capacity building. Expansion into new markets, such as those with growing economies and underdeveloped waste management systems, will also contribute to sustained growth. These factors will collectively drive long-term expansion and create new opportunities for businesses within this critical sector.
Emerging Opportunities in ASEAN Waste Management Industry
Significant opportunities exist in the development and deployment of advanced recycling technologies, particularly for plastics and e-waste. The circular economy model is gaining traction, creating opportunities for businesses focused on waste reuse and resource recovery. The growing demand for sustainable and eco-friendly waste management solutions presents opportunities for firms that can offer innovative and environmentally conscious services. The expansion into rural areas and underserved communities represents a significant opportunity for growth and expansion of service access.
Leading Players in the ASEAN Waste Management Industry Sector
- Sembcorp Environmental Management Pte Ltd (Singapore)
- Veolia Environmental S A
- Colex Holdings Limited
- Remondis
- Klang Waste Care
- Starpal Pte Ltd
- Blue Planet Environmental Solutions
- Greenway Environmental
- PT Prasadha Pamunah Limbah Industri - PPLI
- Boon Poh Refuse Disposal Pte Ltd
- Suez Environment
- Earth Recycling Services Ltd
- ALBA Group Asia
- Se Cure Waste Management
Key Milestones in ASEAN Waste Management Industry Industry
- June 2022: PT Prasadha Pamunah Waste Industries (PPLI) established a representative office in the Wijayakusuma Industrial Area, Indonesia, signifying expansion into a key market.
- December 2022: The Rebottle initiative, a partnership between Singapore Polytechnic and SembWaste, launched a project to increase PET bottle recycling in Singapore, demonstrating innovation in recycling technologies and a commitment to sustainability.
Strategic Outlook for ASEAN Waste Management Industry Market
The ASEAN waste management market is poised for significant growth, driven by several factors. Continued investments in infrastructure, technological innovation, supportive government policies, and increasing environmental awareness will all contribute to this expansion. Strategic partnerships between public and private entities will be crucial to the successful development of sustainable and efficient waste management solutions throughout the region. The future holds immense potential for companies that can adapt to evolving market dynamics and provide innovative solutions addressing the region's waste management challenges.
ASEAN Waste Management Industry Segmentation
-
1. Waste type
- 1.1. Industrial waste
- 1.2. Municipal solid waste
- 1.3. E-waste
- 1.4. Other Waste types
-
2. Disposal methods
- 2.1. Collection
- 2.2. Landfill
- 2.3. Others
-
3. Geography
- 3.1. Indonesia
- 3.2. Thailand
- 3.3. Malaysia
- 3.4. Singapore
- 3.5. Rest of ASEAN
ASEAN Waste Management Industry Segmentation By Geography
- 1. Indonesia
- 2. Thailand
- 3. Malaysia
- 4. Singapore
- 5. Rest of ASEAN
ASEAN Waste Management Industry Regional Market Share
Geographic Coverage of ASEAN Waste Management Industry
ASEAN Waste Management Industry REPORT HIGHLIGHTS
| Aspects | Details |
|---|---|
| Study Period | 2020-2034 |
| Base Year | 2025 |
| Estimated Year | 2026 |
| Forecast Period | 2026-2034 |
| Historical Period | 2020-2025 |
| Growth Rate | CAGR of 6.74% from 2020-2034 |
| Segmentation |
|
Table of Contents
- 1. Introduction
- 1.1. Research Scope
- 1.2. Market Segmentation
- 1.3. Research Objective
- 1.4. Definitions and Assumptions
- 2. Executive Summary
- 2.1. Market Snapshot
- 3. Market Dynamics
- 3.1. Market Drivers
- 3.2. Market Restrains
- 3.3. Market Trends
- 3.4. Market Opportunities
- 4. Market Factor Analysis
- 4.1. Porters Five Forces
- 4.1.1. Bargaining Power of Suppliers
- 4.1.2. Bargaining Power of Buyers
- 4.1.3. Threat of New Entrants
- 4.1.4. Threat of Substitutes
- 4.1.5. Competitive Rivalry
- 4.2. PESTEL analysis
- 4.3. BCG Analysis
- 4.3.1. Stars (High Growth, High Market Share)
- 4.3.2. Cash Cows (Low Growth, High Market Share)
- 4.3.3. Question Mark (High Growth, Low Market Share)
- 4.3.4. Dogs (Low Growth, Low Market Share)
- 4.4. Ansoff Matrix Analysis
- 4.5. Supply Chain Analysis
- 4.6. Regulatory Landscape
- 4.7. Current Market Potential and Opportunity Assessment (TAM–SAM–SOM Framework)
- 4.8. MSR Analyst Note
- 4.1. Porters Five Forces
- 5. Market Analysis, Insights and Forecast 2021-2033
- 5.1. Market Analysis, Insights and Forecast - by Waste type
- 5.1.1. Industrial waste
- 5.1.2. Municipal solid waste
- 5.1.3. E-waste
- 5.1.4. Other Waste types
- 5.2. Market Analysis, Insights and Forecast - by Disposal methods
- 5.2.1. Collection
- 5.2.2. Landfill
- 5.2.3. Others
- 5.3. Market Analysis, Insights and Forecast - by Geography
- 5.3.1. Indonesia
- 5.3.2. Thailand
- 5.3.3. Malaysia
- 5.3.4. Singapore
- 5.3.5. Rest of ASEAN
- 5.4. Market Analysis, Insights and Forecast - by Region
- 5.4.1. Indonesia
- 5.4.2. Thailand
- 5.4.3. Malaysia
- 5.4.4. Singapore
- 5.4.5. Rest of ASEAN
- 5.1. Market Analysis, Insights and Forecast - by Waste type
- 6. Global ASEAN Waste Management Industry Analysis, Insights and Forecast, 2021-2033
- 6.1. Market Analysis, Insights and Forecast - by Waste type
- 6.1.1. Industrial waste
- 6.1.2. Municipal solid waste
- 6.1.3. E-waste
- 6.1.4. Other Waste types
- 6.2. Market Analysis, Insights and Forecast - by Disposal methods
- 6.2.1. Collection
- 6.2.2. Landfill
- 6.2.3. Others
- 6.3. Market Analysis, Insights and Forecast - by Geography
- 6.3.1. Indonesia
- 6.3.2. Thailand
- 6.3.3. Malaysia
- 6.3.4. Singapore
- 6.3.5. Rest of ASEAN
- 6.1. Market Analysis, Insights and Forecast - by Waste type
- 7. Indonesia ASEAN Waste Management Industry Analysis, Insights and Forecast, 2020-2032
- 7.1. Market Analysis, Insights and Forecast - by Waste type
- 7.1.1. Industrial waste
- 7.1.2. Municipal solid waste
- 7.1.3. E-waste
- 7.1.4. Other Waste types
- 7.2. Market Analysis, Insights and Forecast - by Disposal methods
- 7.2.1. Collection
- 7.2.2. Landfill
- 7.2.3. Others
- 7.3. Market Analysis, Insights and Forecast - by Geography
- 7.3.1. Indonesia
- 7.3.2. Thailand
- 7.3.3. Malaysia
- 7.3.4. Singapore
- 7.3.5. Rest of ASEAN
- 7.1. Market Analysis, Insights and Forecast - by Waste type
- 8. Thailand ASEAN Waste Management Industry Analysis, Insights and Forecast, 2020-2032
- 8.1. Market Analysis, Insights and Forecast - by Waste type
- 8.1.1. Industrial waste
- 8.1.2. Municipal solid waste
- 8.1.3. E-waste
- 8.1.4. Other Waste types
- 8.2. Market Analysis, Insights and Forecast - by Disposal methods
- 8.2.1. Collection
- 8.2.2. Landfill
- 8.2.3. Others
- 8.3. Market Analysis, Insights and Forecast - by Geography
- 8.3.1. Indonesia
- 8.3.2. Thailand
- 8.3.3. Malaysia
- 8.3.4. Singapore
- 8.3.5. Rest of ASEAN
- 8.1. Market Analysis, Insights and Forecast - by Waste type
- 9. Malaysia ASEAN Waste Management Industry Analysis, Insights and Forecast, 2020-2032
- 9.1. Market Analysis, Insights and Forecast - by Waste type
- 9.1.1. Industrial waste
- 9.1.2. Municipal solid waste
- 9.1.3. E-waste
- 9.1.4. Other Waste types
- 9.2. Market Analysis, Insights and Forecast - by Disposal methods
- 9.2.1. Collection
- 9.2.2. Landfill
- 9.2.3. Others
- 9.3. Market Analysis, Insights and Forecast - by Geography
- 9.3.1. Indonesia
- 9.3.2. Thailand
- 9.3.3. Malaysia
- 9.3.4. Singapore
- 9.3.5. Rest of ASEAN
- 9.1. Market Analysis, Insights and Forecast - by Waste type
- 10. Singapore ASEAN Waste Management Industry Analysis, Insights and Forecast, 2020-2032
- 10.1. Market Analysis, Insights and Forecast - by Waste type
- 10.1.1. Industrial waste
- 10.1.2. Municipal solid waste
- 10.1.3. E-waste
- 10.1.4. Other Waste types
- 10.2. Market Analysis, Insights and Forecast - by Disposal methods
- 10.2.1. Collection
- 10.2.2. Landfill
- 10.2.3. Others
- 10.3. Market Analysis, Insights and Forecast - by Geography
- 10.3.1. Indonesia
- 10.3.2. Thailand
- 10.3.3. Malaysia
- 10.3.4. Singapore
- 10.3.5. Rest of ASEAN
- 10.1. Market Analysis, Insights and Forecast - by Waste type
- 11. Rest of ASEAN ASEAN Waste Management Industry Analysis, Insights and Forecast, 2020-2032
- 11.1. Market Analysis, Insights and Forecast - by Waste type
- 11.1.1. Industrial waste
- 11.1.2. Municipal solid waste
- 11.1.3. E-waste
- 11.1.4. Other Waste types
- 11.2. Market Analysis, Insights and Forecast - by Disposal methods
- 11.2.1. Collection
- 11.2.2. Landfill
- 11.2.3. Others
- 11.3. Market Analysis, Insights and Forecast - by Geography
- 11.3.1. Indonesia
- 11.3.2. Thailand
- 11.3.3. Malaysia
- 11.3.4. Singapore
- 11.3.5. Rest of ASEAN
- 11.1. Market Analysis, Insights and Forecast - by Waste type
- 12. Competitive Analysis
- 12.1. Company Profiles
- 12.1.1 Sembcorp Environmental Management Pte Ltd (Singapore)
- 12.1.1.1. Company Overview
- 12.1.1.2. Products
- 12.1.1.3. Company Financials
- 12.1.1.4. SWOT Analysis
- 12.1.2 Veolia Environmental S A
- 12.1.2.1. Company Overview
- 12.1.2.2. Products
- 12.1.2.3. Company Financials
- 12.1.2.4. SWOT Analysis
- 12.1.3 Colex Holdings Limited
- 12.1.3.1. Company Overview
- 12.1.3.2. Products
- 12.1.3.3. Company Financials
- 12.1.3.4. SWOT Analysis
- 12.1.4 Remondis
- 12.1.4.1. Company Overview
- 12.1.4.2. Products
- 12.1.4.3. Company Financials
- 12.1.4.4. SWOT Analysis
- 12.1.5 Klang Waste Care
- 12.1.5.1. Company Overview
- 12.1.5.2. Products
- 12.1.5.3. Company Financials
- 12.1.5.4. SWOT Analysis
- 12.1.6 Starpal Pte Ltd
- 12.1.6.1. Company Overview
- 12.1.6.2. Products
- 12.1.6.3. Company Financials
- 12.1.6.4. SWOT Analysis
- 12.1.7 Blue Planet Environmental Solutions
- 12.1.7.1. Company Overview
- 12.1.7.2. Products
- 12.1.7.3. Company Financials
- 12.1.7.4. SWOT Analysis
- 12.1.8 Greenway Environmental
- 12.1.8.1. Company Overview
- 12.1.8.2. Products
- 12.1.8.3. Company Financials
- 12.1.8.4. SWOT Analysis
- 12.1.9 PT Prasadha Pamunah Limbah Industri - PPLI
- 12.1.9.1. Company Overview
- 12.1.9.2. Products
- 12.1.9.3. Company Financials
- 12.1.9.4. SWOT Analysis
- 12.1.10 Boon Poh Refuse Disposal Pte Ltd
- 12.1.10.1. Company Overview
- 12.1.10.2. Products
- 12.1.10.3. Company Financials
- 12.1.10.4. SWOT Analysis
- 12.1.11 Suez Environment
- 12.1.11.1. Company Overview
- 12.1.11.2. Products
- 12.1.11.3. Company Financials
- 12.1.11.4. SWOT Analysis
- 12.1.12 Earth Recycling Services Ltd
- 12.1.12.1. Company Overview
- 12.1.12.2. Products
- 12.1.12.3. Company Financials
- 12.1.12.4. SWOT Analysis
- 12.1.13 ALBA Group Asia
- 12.1.13.1. Company Overview
- 12.1.13.2. Products
- 12.1.13.3. Company Financials
- 12.1.13.4. SWOT Analysis
- 12.1.14 Se Cure Waste Management**List Not Exhaustive
- 12.1.14.1. Company Overview
- 12.1.14.2. Products
- 12.1.14.3. Company Financials
- 12.1.14.4. SWOT Analysis
- 12.1.1 Sembcorp Environmental Management Pte Ltd (Singapore)
- 12.2. Market Entropy
- 12.2.1 Company's Key Areas Served
- 12.2.2 Recent Developments
- 12.3. Company Market Share Analysis 2025
- 12.3.1 Top 5 Companies Market Share Analysis
- 12.3.2 Top 3 Companies Market Share Analysis
- 12.4. List of Potential Customers
- 13. Research Methodology
List of Figures
- Figure 1: Global ASEAN Waste Management Industry Revenue Breakdown (Million, %) by Region 2025 & 2033
- Figure 2: Global ASEAN Waste Management Industry Volume Breakdown (Billion, %) by Region 2025 & 2033
- Figure 3: Indonesia ASEAN Waste Management Industry Revenue (Million), by Waste type 2025 & 2033
- Figure 4: Indonesia ASEAN Waste Management Industry Volume (Billion), by Waste type 2025 & 2033
- Figure 5: Indonesia ASEAN Waste Management Industry Revenue Share (%), by Waste type 2025 & 2033
- Figure 6: Indonesia ASEAN Waste Management Industry Volume Share (%), by Waste type 2025 & 2033
- Figure 7: Indonesia ASEAN Waste Management Industry Revenue (Million), by Disposal methods 2025 & 2033
- Figure 8: Indonesia ASEAN Waste Management Industry Volume (Billion), by Disposal methods 2025 & 2033
- Figure 9: Indonesia ASEAN Waste Management Industry Revenue Share (%), by Disposal methods 2025 & 2033
- Figure 10: Indonesia ASEAN Waste Management Industry Volume Share (%), by Disposal methods 2025 & 2033
- Figure 11: Indonesia ASEAN Waste Management Industry Revenue (Million), by Geography 2025 & 2033
- Figure 12: Indonesia ASEAN Waste Management Industry Volume (Billion), by Geography 2025 & 2033
- Figure 13: Indonesia ASEAN Waste Management Industry Revenue Share (%), by Geography 2025 & 2033
- Figure 14: Indonesia ASEAN Waste Management Industry Volume Share (%), by Geography 2025 & 2033
- Figure 15: Indonesia ASEAN Waste Management Industry Revenue (Million), by Country 2025 & 2033
- Figure 16: Indonesia ASEAN Waste Management Industry Volume (Billion), by Country 2025 & 2033
- Figure 17: Indonesia ASEAN Waste Management Industry Revenue Share (%), by Country 2025 & 2033
- Figure 18: Indonesia ASEAN Waste Management Industry Volume Share (%), by Country 2025 & 2033
- Figure 19: Thailand ASEAN Waste Management Industry Revenue (Million), by Waste type 2025 & 2033
- Figure 20: Thailand ASEAN Waste Management Industry Volume (Billion), by Waste type 2025 & 2033
- Figure 21: Thailand ASEAN Waste Management Industry Revenue Share (%), by Waste type 2025 & 2033
- Figure 22: Thailand ASEAN Waste Management Industry Volume Share (%), by Waste type 2025 & 2033
- Figure 23: Thailand ASEAN Waste Management Industry Revenue (Million), by Disposal methods 2025 & 2033
- Figure 24: Thailand ASEAN Waste Management Industry Volume (Billion), by Disposal methods 2025 & 2033
- Figure 25: Thailand ASEAN Waste Management Industry Revenue Share (%), by Disposal methods 2025 & 2033
- Figure 26: Thailand ASEAN Waste Management Industry Volume Share (%), by Disposal methods 2025 & 2033
- Figure 27: Thailand ASEAN Waste Management Industry Revenue (Million), by Geography 2025 & 2033
- Figure 28: Thailand ASEAN Waste Management Industry Volume (Billion), by Geography 2025 & 2033
- Figure 29: Thailand ASEAN Waste Management Industry Revenue Share (%), by Geography 2025 & 2033
- Figure 30: Thailand ASEAN Waste Management Industry Volume Share (%), by Geography 2025 & 2033
- Figure 31: Thailand ASEAN Waste Management Industry Revenue (Million), by Country 2025 & 2033
- Figure 32: Thailand ASEAN Waste Management Industry Volume (Billion), by Country 2025 & 2033
- Figure 33: Thailand ASEAN Waste Management Industry Revenue Share (%), by Country 2025 & 2033
- Figure 34: Thailand ASEAN Waste Management Industry Volume Share (%), by Country 2025 & 2033
- Figure 35: Malaysia ASEAN Waste Management Industry Revenue (Million), by Waste type 2025 & 2033
- Figure 36: Malaysia ASEAN Waste Management Industry Volume (Billion), by Waste type 2025 & 2033
- Figure 37: Malaysia ASEAN Waste Management Industry Revenue Share (%), by Waste type 2025 & 2033
- Figure 38: Malaysia ASEAN Waste Management Industry Volume Share (%), by Waste type 2025 & 2033
- Figure 39: Malaysia ASEAN Waste Management Industry Revenue (Million), by Disposal methods 2025 & 2033
- Figure 40: Malaysia ASEAN Waste Management Industry Volume (Billion), by Disposal methods 2025 & 2033
- Figure 41: Malaysia ASEAN Waste Management Industry Revenue Share (%), by Disposal methods 2025 & 2033
- Figure 42: Malaysia ASEAN Waste Management Industry Volume Share (%), by Disposal methods 2025 & 2033
- Figure 43: Malaysia ASEAN Waste Management Industry Revenue (Million), by Geography 2025 & 2033
- Figure 44: Malaysia ASEAN Waste Management Industry Volume (Billion), by Geography 2025 & 2033
- Figure 45: Malaysia ASEAN Waste Management Industry Revenue Share (%), by Geography 2025 & 2033
- Figure 46: Malaysia ASEAN Waste Management Industry Volume Share (%), by Geography 2025 & 2033
- Figure 47: Malaysia ASEAN Waste Management Industry Revenue (Million), by Country 2025 & 2033
- Figure 48: Malaysia ASEAN Waste Management Industry Volume (Billion), by Country 2025 & 2033
- Figure 49: Malaysia ASEAN Waste Management Industry Revenue Share (%), by Country 2025 & 2033
- Figure 50: Malaysia ASEAN Waste Management Industry Volume Share (%), by Country 2025 & 2033
- Figure 51: Singapore ASEAN Waste Management Industry Revenue (Million), by Waste type 2025 & 2033
- Figure 52: Singapore ASEAN Waste Management Industry Volume (Billion), by Waste type 2025 & 2033
- Figure 53: Singapore ASEAN Waste Management Industry Revenue Share (%), by Waste type 2025 & 2033
- Figure 54: Singapore ASEAN Waste Management Industry Volume Share (%), by Waste type 2025 & 2033
- Figure 55: Singapore ASEAN Waste Management Industry Revenue (Million), by Disposal methods 2025 & 2033
- Figure 56: Singapore ASEAN Waste Management Industry Volume (Billion), by Disposal methods 2025 & 2033
- Figure 57: Singapore ASEAN Waste Management Industry Revenue Share (%), by Disposal methods 2025 & 2033
- Figure 58: Singapore ASEAN Waste Management Industry Volume Share (%), by Disposal methods 2025 & 2033
- Figure 59: Singapore ASEAN Waste Management Industry Revenue (Million), by Geography 2025 & 2033
- Figure 60: Singapore ASEAN Waste Management Industry Volume (Billion), by Geography 2025 & 2033
- Figure 61: Singapore ASEAN Waste Management Industry Revenue Share (%), by Geography 2025 & 2033
- Figure 62: Singapore ASEAN Waste Management Industry Volume Share (%), by Geography 2025 & 2033
- Figure 63: Singapore ASEAN Waste Management Industry Revenue (Million), by Country 2025 & 2033
- Figure 64: Singapore ASEAN Waste Management Industry Volume (Billion), by Country 2025 & 2033
- Figure 65: Singapore ASEAN Waste Management Industry Revenue Share (%), by Country 2025 & 2033
- Figure 66: Singapore ASEAN Waste Management Industry Volume Share (%), by Country 2025 & 2033
- Figure 67: Rest of ASEAN ASEAN Waste Management Industry Revenue (Million), by Waste type 2025 & 2033
- Figure 68: Rest of ASEAN ASEAN Waste Management Industry Volume (Billion), by Waste type 2025 & 2033
- Figure 69: Rest of ASEAN ASEAN Waste Management Industry Revenue Share (%), by Waste type 2025 & 2033
- Figure 70: Rest of ASEAN ASEAN Waste Management Industry Volume Share (%), by Waste type 2025 & 2033
- Figure 71: Rest of ASEAN ASEAN Waste Management Industry Revenue (Million), by Disposal methods 2025 & 2033
- Figure 72: Rest of ASEAN ASEAN Waste Management Industry Volume (Billion), by Disposal methods 2025 & 2033
- Figure 73: Rest of ASEAN ASEAN Waste Management Industry Revenue Share (%), by Disposal methods 2025 & 2033
- Figure 74: Rest of ASEAN ASEAN Waste Management Industry Volume Share (%), by Disposal methods 2025 & 2033
- Figure 75: Rest of ASEAN ASEAN Waste Management Industry Revenue (Million), by Geography 2025 & 2033
- Figure 76: Rest of ASEAN ASEAN Waste Management Industry Volume (Billion), by Geography 2025 & 2033
- Figure 77: Rest of ASEAN ASEAN Waste Management Industry Revenue Share (%), by Geography 2025 & 2033
- Figure 78: Rest of ASEAN ASEAN Waste Management Industry Volume Share (%), by Geography 2025 & 2033
- Figure 79: Rest of ASEAN ASEAN Waste Management Industry Revenue (Million), by Country 2025 & 2033
- Figure 80: Rest of ASEAN ASEAN Waste Management Industry Volume (Billion), by Country 2025 & 2033
- Figure 81: Rest of ASEAN ASEAN Waste Management Industry Revenue Share (%), by Country 2025 & 2033
- Figure 82: Rest of ASEAN ASEAN Waste Management Industry Volume Share (%), by Country 2025 & 2033
List of Tables
- Table 1: Global ASEAN Waste Management Industry Revenue Million Forecast, by Waste type 2020 & 2033
- Table 2: Global ASEAN Waste Management Industry Volume Billion Forecast, by Waste type 2020 & 2033
- Table 3: Global ASEAN Waste Management Industry Revenue Million Forecast, by Disposal methods 2020 & 2033
- Table 4: Global ASEAN Waste Management Industry Volume Billion Forecast, by Disposal methods 2020 & 2033
- Table 5: Global ASEAN Waste Management Industry Revenue Million Forecast, by Geography 2020 & 2033
- Table 6: Global ASEAN Waste Management Industry Volume Billion Forecast, by Geography 2020 & 2033
- Table 7: Global ASEAN Waste Management Industry Revenue Million Forecast, by Region 2020 & 2033
- Table 8: Global ASEAN Waste Management Industry Volume Billion Forecast, by Region 2020 & 2033
- Table 9: Global ASEAN Waste Management Industry Revenue Million Forecast, by Waste type 2020 & 2033
- Table 10: Global ASEAN Waste Management Industry Volume Billion Forecast, by Waste type 2020 & 2033
- Table 11: Global ASEAN Waste Management Industry Revenue Million Forecast, by Disposal methods 2020 & 2033
- Table 12: Global ASEAN Waste Management Industry Volume Billion Forecast, by Disposal methods 2020 & 2033
- Table 13: Global ASEAN Waste Management Industry Revenue Million Forecast, by Geography 2020 & 2033
- Table 14: Global ASEAN Waste Management Industry Volume Billion Forecast, by Geography 2020 & 2033
- Table 15: Global ASEAN Waste Management Industry Revenue Million Forecast, by Country 2020 & 2033
- Table 16: Global ASEAN Waste Management Industry Volume Billion Forecast, by Country 2020 & 2033
- Table 17: Global ASEAN Waste Management Industry Revenue Million Forecast, by Waste type 2020 & 2033
- Table 18: Global ASEAN Waste Management Industry Volume Billion Forecast, by Waste type 2020 & 2033
- Table 19: Global ASEAN Waste Management Industry Revenue Million Forecast, by Disposal methods 2020 & 2033
- Table 20: Global ASEAN Waste Management Industry Volume Billion Forecast, by Disposal methods 2020 & 2033
- Table 21: Global ASEAN Waste Management Industry Revenue Million Forecast, by Geography 2020 & 2033
- Table 22: Global ASEAN Waste Management Industry Volume Billion Forecast, by Geography 2020 & 2033
- Table 23: Global ASEAN Waste Management Industry Revenue Million Forecast, by Country 2020 & 2033
- Table 24: Global ASEAN Waste Management Industry Volume Billion Forecast, by Country 2020 & 2033
- Table 25: Global ASEAN Waste Management Industry Revenue Million Forecast, by Waste type 2020 & 2033
- Table 26: Global ASEAN Waste Management Industry Volume Billion Forecast, by Waste type 2020 & 2033
- Table 27: Global ASEAN Waste Management Industry Revenue Million Forecast, by Disposal methods 2020 & 2033
- Table 28: Global ASEAN Waste Management Industry Volume Billion Forecast, by Disposal methods 2020 & 2033
- Table 29: Global ASEAN Waste Management Industry Revenue Million Forecast, by Geography 2020 & 2033
- Table 30: Global ASEAN Waste Management Industry Volume Billion Forecast, by Geography 2020 & 2033
- Table 31: Global ASEAN Waste Management Industry Revenue Million Forecast, by Country 2020 & 2033
- Table 32: Global ASEAN Waste Management Industry Volume Billion Forecast, by Country 2020 & 2033
- Table 33: Global ASEAN Waste Management Industry Revenue Million Forecast, by Waste type 2020 & 2033
- Table 34: Global ASEAN Waste Management Industry Volume Billion Forecast, by Waste type 2020 & 2033
- Table 35: Global ASEAN Waste Management Industry Revenue Million Forecast, by Disposal methods 2020 & 2033
- Table 36: Global ASEAN Waste Management Industry Volume Billion Forecast, by Disposal methods 2020 & 2033
- Table 37: Global ASEAN Waste Management Industry Revenue Million Forecast, by Geography 2020 & 2033
- Table 38: Global ASEAN Waste Management Industry Volume Billion Forecast, by Geography 2020 & 2033
- Table 39: Global ASEAN Waste Management Industry Revenue Million Forecast, by Country 2020 & 2033
- Table 40: Global ASEAN Waste Management Industry Volume Billion Forecast, by Country 2020 & 2033
- Table 41: Global ASEAN Waste Management Industry Revenue Million Forecast, by Waste type 2020 & 2033
- Table 42: Global ASEAN Waste Management Industry Volume Billion Forecast, by Waste type 2020 & 2033
- Table 43: Global ASEAN Waste Management Industry Revenue Million Forecast, by Disposal methods 2020 & 2033
- Table 44: Global ASEAN Waste Management Industry Volume Billion Forecast, by Disposal methods 2020 & 2033
- Table 45: Global ASEAN Waste Management Industry Revenue Million Forecast, by Geography 2020 & 2033
- Table 46: Global ASEAN Waste Management Industry Volume Billion Forecast, by Geography 2020 & 2033
- Table 47: Global ASEAN Waste Management Industry Revenue Million Forecast, by Country 2020 & 2033
- Table 48: Global ASEAN Waste Management Industry Volume Billion Forecast, by Country 2020 & 2033
Frequently Asked Questions
1. What is the projected Compound Annual Growth Rate (CAGR) of the ASEAN Waste Management Industry?
The projected CAGR is approximately 6.74%.
2. Which companies are prominent players in the ASEAN Waste Management Industry?
Key companies in the market include Sembcorp Environmental Management Pte Ltd (Singapore), Veolia Environmental S A, Colex Holdings Limited, Remondis, Klang Waste Care, Starpal Pte Ltd, Blue Planet Environmental Solutions, Greenway Environmental, PT Prasadha Pamunah Limbah Industri - PPLI, Boon Poh Refuse Disposal Pte Ltd, Suez Environment, Earth Recycling Services Ltd, ALBA Group Asia, Se Cure Waste Management**List Not Exhaustive.
3. What are the main segments of the ASEAN Waste Management Industry?
The market segments include Waste type, Disposal methods, Geography.
4. Can you provide details about the market size?
The market size is estimated to be USD 31.25 Million as of 2022.
5. What are some drivers contributing to market growth?
N/A
6. What are the notable trends driving market growth?
Indonesia Advances Zero-Plastic Waste Ambitions with Public-Private Partnership to Build Waste Management Capacity and Capability.
7. Are there any restraints impacting market growth?
N/A
8. Can you provide examples of recent developments in the market?
December 2022: A cooperative venture called Rebottle between Singapore Polytechnic (SP) and SembWaste, a fully owned subsidiary of Sembcorp Industries (Sembcorp) intends to increase the amount of PET bottles that are recycled in Singapore, beginning with the Punggol Shore area.June 2022: The introduction of a representative office in the Wijayakusuma Industrial Area was conducted on Thursday, June 30, 2022, making it a significant day in the history of PT Prasadha Pamunah Waste Industries (PPLI). The Wijayakusuma Industrial Estate's management, PT KIW, has leased space to the newly established PT PPLI representative office (Persero). Selling land for industrial usage, renting Ready-to-Use Factory Buildings (BPSP), and leasing space for offices are all part of PT KIW's primary business. The PT PPLI-DESI representative office will be opened with the intention of being a dependable partner for businesses, the Indonesian government, and other stakeholders, and contributing to Indonesia's economic and environmental growth.
9. What pricing options are available for accessing the report?
Pricing options include single-user, multi-user, and enterprise licenses priced at USD 4750, USD 5250, and USD 8750 respectively.
10. Is the market size provided in terms of value or volume?
The market size is provided in terms of value, measured in Million and volume, measured in Billion.
11. Are there any specific market keywords associated with the report?
Yes, the market keyword associated with the report is "ASEAN Waste Management Industry," which aids in identifying and referencing the specific market segment covered.
12. How do I determine which pricing option suits my needs best?
The pricing options vary based on user requirements and access needs. Individual users may opt for single-user licenses, while businesses requiring broader access may choose multi-user or enterprise licenses for cost-effective access to the report.
13. Are there any additional resources or data provided in the ASEAN Waste Management Industry report?
While the report offers comprehensive insights, it's advisable to review the specific contents or supplementary materials provided to ascertain if additional resources or data are available.
14. How can I stay updated on further developments or reports in the ASEAN Waste Management Industry?
To stay informed about further developments, trends, and reports in the ASEAN Waste Management Industry, consider subscribing to industry newsletters, following relevant companies and organizations, or regularly checking reputable industry news sources and publications.
Methodology
Step 1 - Identification of Relevant Samples Size from Population Database


Step 2 - Approaches for Defining Global Market Size (Value, Volume* & Price*)

Note*: In applicable scenarios
Step 3 - Data Sources
Primary Research
- Web Analytics
- Survey Reports
- Research Institute
- Latest Research Reports
- Opinion Leaders
Secondary Research
- Annual Reports
- White Paper
- Latest Press Release
- Industry Association
- Paid Database
- Investor Presentations

Step 4 - Data Triangulation
Involves using different sources of information in order to increase the validity of a study
These sources are likely to be stakeholders in a program - participants, other researchers, program staff, other community members, and so on.
Then we put all data in single framework & apply various statistical tools to find out the dynamic on the market.
During the analysis stage, feedback from the stakeholder groups would be compared to determine areas of agreement as well as areas of divergence