

Key Insights
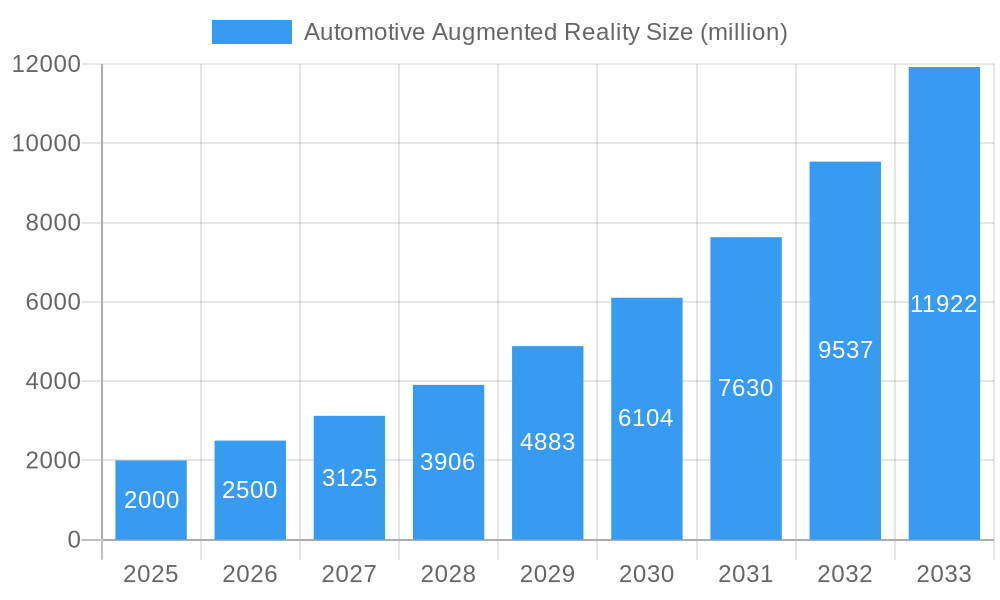
The automotive augmented reality (AR) market is poised for significant expansion, propelled by the escalating demand for advanced driver-assistance systems (ADAS) and sophisticated infotainment. Key drivers include the increasing prevalence of connected vehicles, rapid advancements in AR hardware and software, and a strong emphasis on enhancing driver safety and convenience. AR integration into head-up displays (HUDs), windshields, and infotainment systems provides drivers with critical real-time information, such as navigation, speed, and hazard alerts, overlaid directly onto their view of the road. This enhances situational awareness and minimizes driver distraction, thereby improving road safety. Additionally, AR is transforming the in-car entertainment experience, offering passengers interactive and immersive content. Despite initial investment challenges, the long-term advantages of AR, including increased sales, strengthened brand reputation, and elevated safety, are fostering widespread adoption. We project the market size to reach $6.79 billion by 2025, with a Compound Annual Growth Rate (CAGR) of 17.6% during the forecast period (2025-2033). This exceptional growth underscores continuous technological innovation and rising consumer desire for advanced automotive features.
Automotive Augmented Reality Market Size (In Billion)
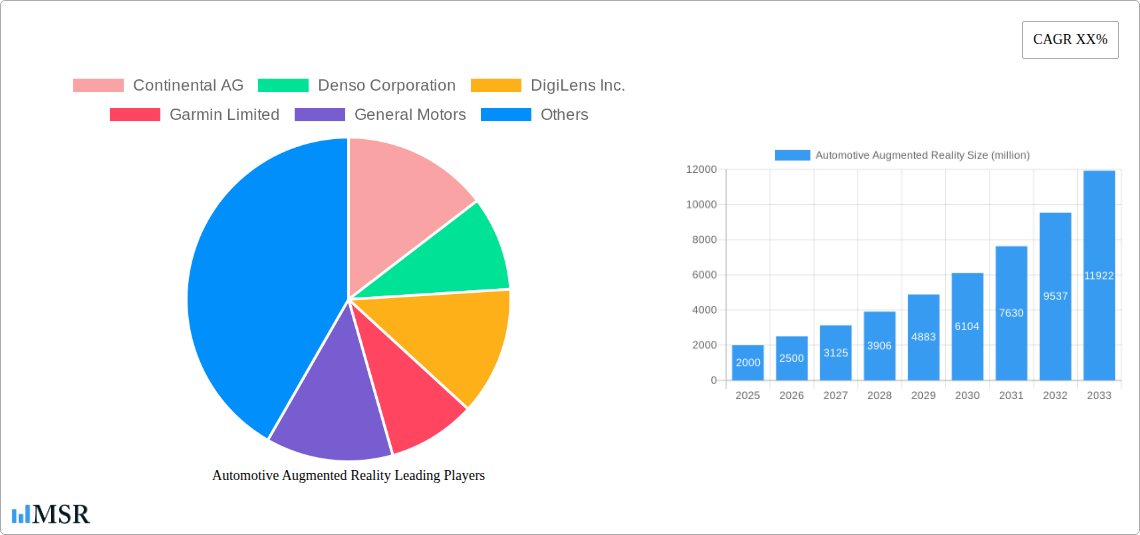
The competitive arena features established automotive suppliers, technology innovators, and vehicle manufacturers. Companies such as Continental AG, Denso Corporation, and Robert Bosch GmbH are making substantial investments in AR technology. Concurrently, technology firms like DigiLens and MicroVision are pioneering novel AR hardware and software solutions tailored for the automotive sector. Future market growth hinges on ongoing progress in display technology, enhanced processing capabilities, and the development of resilient software platforms for seamless AR integration in vehicles. Regulatory approvals and standardization initiatives will also be pivotal in shaping market dynamics. Geographically, the market is anticipated to see initial concentration in North America and Europe, with subsequent expansion into emerging economies as affordability increases.
Automotive Augmented Reality Company Market Share
Automotive Augmented Reality Market Report: 2019-2033
This comprehensive report provides an in-depth analysis of the Automotive Augmented Reality (AR) market, offering crucial insights for stakeholders seeking to navigate this rapidly evolving landscape. The study period spans 2019-2033, with a base year of 2025 and a forecast period of 2025-2033. The report projects a market size of xx million by 2025, exhibiting a CAGR of xx% during the forecast period. This report is essential for investors, automotive manufacturers, technology providers, and regulatory bodies looking to understand the market dynamics, key players, and future opportunities in Automotive AR.
Automotive Augmented Reality Market Concentration & Dynamics
The Automotive Augmented Reality market exhibits a moderately concentrated landscape, with key players like Continental AG, Denso Corporation, and Robert Bosch GmbH holding significant market share. However, the presence of several innovative startups and the increasing investments in R&D indicate a dynamic competitive environment. The market is witnessing significant M&A activity, with an estimated xx number of deals recorded during the historical period (2019-2024). These mergers and acquisitions are driven by the need to expand product portfolios, acquire technological expertise, and secure access to larger market segments.
- Market Concentration: The top 5 players account for approximately xx% of the market share in 2025.
- Innovation Ecosystems: Collaboration between automotive OEMs, Tier-1 suppliers, and technology companies fosters rapid innovation.
- Regulatory Frameworks: Governments worldwide are actively developing regulations related to the safety and security of AR systems in vehicles.
- Substitute Products: Traditional navigation systems and driver assistance systems pose some competitive pressure but AR offers unique functionalities.
- End-User Trends: Consumers increasingly demand advanced driver-assistance systems and enhanced infotainment experiences, driving AR adoption.
- M&A Activities: The number of M&A deals is expected to increase in the forecast period, particularly in the area of advanced AR hardware and software development.
Automotive Augmented Reality Industry Insights & Trends
The Automotive AR market is experiencing substantial growth, driven by several factors. The increasing demand for enhanced driver assistance systems (ADAS) features, the rising adoption of advanced driver-assistance systems, and the integration of AR into infotainment systems are key market growth drivers. Technological advancements in display technologies, sensors, and processing power are further propelling market expansion. Consumer preference for safer, more convenient, and personalized driving experiences fuels the demand for AR-enabled features in vehicles. The market size is projected to reach xx million by 2033, with a CAGR of xx% from 2025 to 2033.
Key Markets & Segments Leading Automotive Augmented Reality
The North American region is expected to hold a significant market share throughout the forecast period due to early adoption of advanced driver-assistance systems and strong consumer demand. Other key markets include Europe and Asia Pacific, showcasing robust growth potential. Within segments, the HUD (Heads-Up Display) segment is expected to dominate due to its prevalent adoption in high-end vehicles.
- North America: High vehicle ownership rates, strong technological advancements, and early adoption of ADAS contribute to market dominance.
- Europe: Stringent safety regulations and a focus on advanced driver-assistance technology are fueling market growth.
- Asia Pacific: Rapid economic growth, increasing vehicle sales, and substantial investments in automotive technology are driving market expansion.
- HUD Segment: The HUD segment is expected to dominate due to its relatively mature technology and wide adoption across vehicle classes.
Automotive Augmented Reality Product Developments
Recent product innovations include advanced AR HUD systems with improved image quality, wider fields of view, and enhanced haptic feedback. New applications are emerging, such as AR-based navigation, augmented reality driving systems, and enhanced driver alerts. These advancements offer significant competitive edges in terms of safety, convenience, and entertainment. The integration of AI algorithms further enhances the functionalities and user experience of AR systems in vehicles.
Challenges in the Automotive Augmented Reality Market
The Automotive AR market faces several challenges, including high development costs, technological complexities, and the need for robust safety and security standards. Supply chain disruptions can also impact the production and deployment of AR systems. Furthermore, competitive pressures from established automotive players and new entrants necessitate continuous innovation and adaptation to maintain a competitive edge. The estimated impact of supply chain issues on market growth is an estimated xx% in 2025.
Forces Driving Automotive Augmented Reality Growth
Several factors are driving the growth of the Automotive AR market. Technological advancements in areas such as display technology, sensor technology, and processing power are essential for enhanced performance and functionality. Government regulations promoting advanced safety features increase the demand for AR systems in vehicles. Growing consumer demand for personalized and interactive in-car experiences is another key driver.
Long-Term Growth Catalysts in Automotive Augmented Reality
Long-term growth will be fueled by continued innovation in AR hardware and software, strategic partnerships between automotive manufacturers and technology providers, and market expansion into emerging economies. The integration of AI and machine learning will enhance the capabilities and intelligence of AR systems.
Emerging Opportunities in Automotive Augmented Reality
Emerging opportunities include the integration of AR with other vehicle technologies such as autonomous driving systems, the development of AR-based entertainment and infotainment features, and the expansion into new vehicle segments like commercial vehicles. New markets and consumer preferences will drive the development of niche applications tailored to specific user needs.
Leading Players in the Automotive Augmented Reality Sector
- Continental AG
- Denso Corporation
- DigiLens Inc.
- Garmin Limited
- General Motors
- Harman International Industries Inc.
- Hyundai Motor Company
- LG Business Solutions
- MicroVision, Inc.
- Nippon Seiki Co, Ltd
- Panasonic Corporation
- Pioneer Corporation
- Robert Bosch GmbH
- Texas Instruments Inc.
- Visteon Corporation
- Volkswagen AG
- WayRay SA
- Yazaki Corporation
Key Milestones in Automotive Augmented Reality Industry
- 2020: Several major automotive manufacturers announce investments in AR technology for vehicle applications.
- 2021: Significant advancements in AR HUD technology are showcased at major automotive trade shows.
- 2022: Key partnerships are formed between automotive OEMs and technology providers to accelerate AR development.
- 2023: The first mass-produced vehicles featuring advanced AR systems are launched.
Strategic Outlook for Automotive Augmented Reality Market
The Automotive AR market holds immense future potential, driven by continuous technological advancements and growing consumer demand. Strategic opportunities exist for companies to invest in R&D, forge strategic partnerships, and expand their product portfolios to capture market share. The market is poised for significant growth, creating lucrative opportunities for both established players and new entrants.
Automotive Augmented Reality Segmentation
-
1. Application
- 1.1. Passenger Vehicle
- 1.2. Commercial Vehicle
-
2. Types
- 2.1. AR HUD Navigation
- 2.2. AR HUD ACC
- 2.3. AR HUD LDW
- 2.4. Advanced AR HUD
Automotive Augmented Reality Segmentation By Geography
-
1. North America
- 1.1. United States
- 1.2. Canada
- 1.3. Mexico
-
2. South America
- 2.1. Brazil
- 2.2. Argentina
- 2.3. Rest of South America
-
3. Europe
- 3.1. United Kingdom
- 3.2. Germany
- 3.3. France
- 3.4. Italy
- 3.5. Spain
- 3.6. Russia
- 3.7. Benelux
- 3.8. Nordics
- 3.9. Rest of Europe
-
4. Middle East & Africa
- 4.1. Turkey
- 4.2. Israel
- 4.3. GCC
- 4.4. North Africa
- 4.5. South Africa
- 4.6. Rest of Middle East & Africa
-
5. Asia Pacific
- 5.1. China
- 5.2. India
- 5.3. Japan
- 5.4. South Korea
- 5.5. ASEAN
- 5.6. Oceania
- 5.7. Rest of Asia Pacific

Automotive Augmented Reality Regional Market Share
Geographic Coverage of Automotive Augmented Reality
Automotive Augmented Reality REPORT HIGHLIGHTS
| Aspects | Details |
|---|---|
| Study Period | 2020-2034 |
| Base Year | 2025 |
| Estimated Year | 2026 |
| Forecast Period | 2026-2034 |
| Historical Period | 2020-2025 |
| Growth Rate | CAGR of 17.6% from 2020-2034 |
| Segmentation |
|
Table of Contents
- 1. Introduction
- 1.1. Research Scope
- 1.2. Market Segmentation
- 1.3. Research Objective
- 1.4. Definitions and Assumptions
- 2. Executive Summary
- 2.1. Market Snapshot
- 3. Market Dynamics
- 3.1. Market Drivers
- 3.2. Market Restrains
- 3.3. Market Trends
- 3.4. Market Opportunities
- 4. Market Factor Analysis
- 4.1. Porters Five Forces
- 4.1.1. Bargaining Power of Suppliers
- 4.1.2. Bargaining Power of Buyers
- 4.1.3. Threat of New Entrants
- 4.1.4. Threat of Substitutes
- 4.1.5. Competitive Rivalry
- 4.2. PESTEL analysis
- 4.3. BCG Analysis
- 4.3.1. Stars (High Growth, High Market Share)
- 4.3.2. Cash Cows (Low Growth, High Market Share)
- 4.3.3. Question Mark (High Growth, Low Market Share)
- 4.3.4. Dogs (Low Growth, Low Market Share)
- 4.4. Ansoff Matrix Analysis
- 4.5. Supply Chain Analysis
- 4.6. Regulatory Landscape
- 4.7. Current Market Potential and Opportunity Assessment (TAM–SAM–SOM Framework)
- 4.8. MSR Analyst Note
- 4.1. Porters Five Forces
- 5. Market Analysis, Insights and Forecast 2021-2033
- 5.1. Market Analysis, Insights and Forecast - by Application
- 5.1.1. Passenger Vehicle
- 5.1.2. Commercial Vehicle
- 5.2. Market Analysis, Insights and Forecast - by Types
- 5.2.1. AR HUD Navigation
- 5.2.2. AR HUD ACC
- 5.2.3. AR HUD LDW
- 5.2.4. Advanced AR HUD
- 5.3. Market Analysis, Insights and Forecast - by Region
- 5.3.1. North America
- 5.3.2. South America
- 5.3.3. Europe
- 5.3.4. Middle East & Africa
- 5.3.5. Asia Pacific
- 5.1. Market Analysis, Insights and Forecast - by Application
- 6. Global Automotive Augmented Reality Analysis, Insights and Forecast, 2021-2033
- 6.1. Market Analysis, Insights and Forecast - by Application
- 6.1.1. Passenger Vehicle
- 6.1.2. Commercial Vehicle
- 6.2. Market Analysis, Insights and Forecast - by Types
- 6.2.1. AR HUD Navigation
- 6.2.2. AR HUD ACC
- 6.2.3. AR HUD LDW
- 6.2.4. Advanced AR HUD
- 6.1. Market Analysis, Insights and Forecast - by Application
- 7. North America Automotive Augmented Reality Analysis, Insights and Forecast, 2020-2032
- 7.1. Market Analysis, Insights and Forecast - by Application
- 7.1.1. Passenger Vehicle
- 7.1.2. Commercial Vehicle
- 7.2. Market Analysis, Insights and Forecast - by Types
- 7.2.1. AR HUD Navigation
- 7.2.2. AR HUD ACC
- 7.2.3. AR HUD LDW
- 7.2.4. Advanced AR HUD
- 7.1. Market Analysis, Insights and Forecast - by Application
- 8. South America Automotive Augmented Reality Analysis, Insights and Forecast, 2020-2032
- 8.1. Market Analysis, Insights and Forecast - by Application
- 8.1.1. Passenger Vehicle
- 8.1.2. Commercial Vehicle
- 8.2. Market Analysis, Insights and Forecast - by Types
- 8.2.1. AR HUD Navigation
- 8.2.2. AR HUD ACC
- 8.2.3. AR HUD LDW
- 8.2.4. Advanced AR HUD
- 8.1. Market Analysis, Insights and Forecast - by Application
- 9. Europe Automotive Augmented Reality Analysis, Insights and Forecast, 2020-2032
- 9.1. Market Analysis, Insights and Forecast - by Application
- 9.1.1. Passenger Vehicle
- 9.1.2. Commercial Vehicle
- 9.2. Market Analysis, Insights and Forecast - by Types
- 9.2.1. AR HUD Navigation
- 9.2.2. AR HUD ACC
- 9.2.3. AR HUD LDW
- 9.2.4. Advanced AR HUD
- 9.1. Market Analysis, Insights and Forecast - by Application
- 10. Middle East & Africa Automotive Augmented Reality Analysis, Insights and Forecast, 2020-2032
- 10.1. Market Analysis, Insights and Forecast - by Application
- 10.1.1. Passenger Vehicle
- 10.1.2. Commercial Vehicle
- 10.2. Market Analysis, Insights and Forecast - by Types
- 10.2.1. AR HUD Navigation
- 10.2.2. AR HUD ACC
- 10.2.3. AR HUD LDW
- 10.2.4. Advanced AR HUD
- 10.1. Market Analysis, Insights and Forecast - by Application
- 11. Asia Pacific Automotive Augmented Reality Analysis, Insights and Forecast, 2020-2032
- 11.1. Market Analysis, Insights and Forecast - by Application
- 11.1.1. Passenger Vehicle
- 11.1.2. Commercial Vehicle
- 11.2. Market Analysis, Insights and Forecast - by Types
- 11.2.1. AR HUD Navigation
- 11.2.2. AR HUD ACC
- 11.2.3. AR HUD LDW
- 11.2.4. Advanced AR HUD
- 11.1. Market Analysis, Insights and Forecast - by Application
- 12. Competitive Analysis
- 12.1. Company Profiles
- 12.1.1 Continental AG
- 12.1.1.1. Company Overview
- 12.1.1.2. Products
- 12.1.1.3. Company Financials
- 12.1.1.4. SWOT Analysis
- 12.1.2 Denso Corporation
- 12.1.2.1. Company Overview
- 12.1.2.2. Products
- 12.1.2.3. Company Financials
- 12.1.2.4. SWOT Analysis
- 12.1.3 DigiLens Inc.
- 12.1.3.1. Company Overview
- 12.1.3.2. Products
- 12.1.3.3. Company Financials
- 12.1.3.4. SWOT Analysis
- 12.1.4 Garmin Limited
- 12.1.4.1. Company Overview
- 12.1.4.2. Products
- 12.1.4.3. Company Financials
- 12.1.4.4. SWOT Analysis
- 12.1.5 General Motors
- 12.1.5.1. Company Overview
- 12.1.5.2. Products
- 12.1.5.3. Company Financials
- 12.1.5.4. SWOT Analysis
- 12.1.6 Harman International Industries Inc.
- 12.1.6.1. Company Overview
- 12.1.6.2. Products
- 12.1.6.3. Company Financials
- 12.1.6.4. SWOT Analysis
- 12.1.7 Hyundai Motor Company
- 12.1.7.1. Company Overview
- 12.1.7.2. Products
- 12.1.7.3. Company Financials
- 12.1.7.4. SWOT Analysis
- 12.1.8 LG Business Solutions
- 12.1.8.1. Company Overview
- 12.1.8.2. Products
- 12.1.8.3. Company Financials
- 12.1.8.4. SWOT Analysis
- 12.1.9 MicroVision
- 12.1.9.1. Company Overview
- 12.1.9.2. Products
- 12.1.9.3. Company Financials
- 12.1.9.4. SWOT Analysis
- 12.1.10 Inc.
- 12.1.10.1. Company Overview
- 12.1.10.2. Products
- 12.1.10.3. Company Financials
- 12.1.10.4. SWOT Analysis
- 12.1.11 Nippon Seiki Co
- 12.1.11.1. Company Overview
- 12.1.11.2. Products
- 12.1.11.3. Company Financials
- 12.1.11.4. SWOT Analysis
- 12.1.12 Ltd
- 12.1.12.1. Company Overview
- 12.1.12.2. Products
- 12.1.12.3. Company Financials
- 12.1.12.4. SWOT Analysis
- 12.1.13 Panasonic Corporation
- 12.1.13.1. Company Overview
- 12.1.13.2. Products
- 12.1.13.3. Company Financials
- 12.1.13.4. SWOT Analysis
- 12.1.14 Pioneer Corporation
- 12.1.14.1. Company Overview
- 12.1.14.2. Products
- 12.1.14.3. Company Financials
- 12.1.14.4. SWOT Analysis
- 12.1.15 Robert Bosch GmbH
- 12.1.15.1. Company Overview
- 12.1.15.2. Products
- 12.1.15.3. Company Financials
- 12.1.15.4. SWOT Analysis
- 12.1.16 Texas Instruments Inc.
- 12.1.16.1. Company Overview
- 12.1.16.2. Products
- 12.1.16.3. Company Financials
- 12.1.16.4. SWOT Analysis
- 12.1.17 Visteon Corporation
- 12.1.17.1. Company Overview
- 12.1.17.2. Products
- 12.1.17.3. Company Financials
- 12.1.17.4. SWOT Analysis
- 12.1.18 Volkswagen AG
- 12.1.18.1. Company Overview
- 12.1.18.2. Products
- 12.1.18.3. Company Financials
- 12.1.18.4. SWOT Analysis
- 12.1.19 WayRay SA
- 12.1.19.1. Company Overview
- 12.1.19.2. Products
- 12.1.19.3. Company Financials
- 12.1.19.4. SWOT Analysis
- 12.1.20 Yazaki Corporation
- 12.1.20.1. Company Overview
- 12.1.20.2. Products
- 12.1.20.3. Company Financials
- 12.1.20.4. SWOT Analysis
- 12.1.1 Continental AG
- 12.2. Market Entropy
- 12.2.1 Company's Key Areas Served
- 12.2.2 Recent Developments
- 12.3. Company Market Share Analysis 2025
- 12.3.1 Top 5 Companies Market Share Analysis
- 12.3.2 Top 3 Companies Market Share Analysis
- 12.4. List of Potential Customers
- 13. Research Methodology
List of Figures
- Figure 1: Global Automotive Augmented Reality Revenue Breakdown (billion, %) by Region 2025 & 2033
- Figure 2: North America Automotive Augmented Reality Revenue (billion), by Application 2025 & 2033
- Figure 3: North America Automotive Augmented Reality Revenue Share (%), by Application 2025 & 2033
- Figure 4: North America Automotive Augmented Reality Revenue (billion), by Types 2025 & 2033
- Figure 5: North America Automotive Augmented Reality Revenue Share (%), by Types 2025 & 2033
- Figure 6: North America Automotive Augmented Reality Revenue (billion), by Country 2025 & 2033
- Figure 7: North America Automotive Augmented Reality Revenue Share (%), by Country 2025 & 2033
- Figure 8: South America Automotive Augmented Reality Revenue (billion), by Application 2025 & 2033
- Figure 9: South America Automotive Augmented Reality Revenue Share (%), by Application 2025 & 2033
- Figure 10: South America Automotive Augmented Reality Revenue (billion), by Types 2025 & 2033
- Figure 11: South America Automotive Augmented Reality Revenue Share (%), by Types 2025 & 2033
- Figure 12: South America Automotive Augmented Reality Revenue (billion), by Country 2025 & 2033
- Figure 13: South America Automotive Augmented Reality Revenue Share (%), by Country 2025 & 2033
- Figure 14: Europe Automotive Augmented Reality Revenue (billion), by Application 2025 & 2033
- Figure 15: Europe Automotive Augmented Reality Revenue Share (%), by Application 2025 & 2033
- Figure 16: Europe Automotive Augmented Reality Revenue (billion), by Types 2025 & 2033
- Figure 17: Europe Automotive Augmented Reality Revenue Share (%), by Types 2025 & 2033
- Figure 18: Europe Automotive Augmented Reality Revenue (billion), by Country 2025 & 2033
- Figure 19: Europe Automotive Augmented Reality Revenue Share (%), by Country 2025 & 2033
- Figure 20: Middle East & Africa Automotive Augmented Reality Revenue (billion), by Application 2025 & 2033
- Figure 21: Middle East & Africa Automotive Augmented Reality Revenue Share (%), by Application 2025 & 2033
- Figure 22: Middle East & Africa Automotive Augmented Reality Revenue (billion), by Types 2025 & 2033
- Figure 23: Middle East & Africa Automotive Augmented Reality Revenue Share (%), by Types 2025 & 2033
- Figure 24: Middle East & Africa Automotive Augmented Reality Revenue (billion), by Country 2025 & 2033
- Figure 25: Middle East & Africa Automotive Augmented Reality Revenue Share (%), by Country 2025 & 2033
- Figure 26: Asia Pacific Automotive Augmented Reality Revenue (billion), by Application 2025 & 2033
- Figure 27: Asia Pacific Automotive Augmented Reality Revenue Share (%), by Application 2025 & 2033
- Figure 28: Asia Pacific Automotive Augmented Reality Revenue (billion), by Types 2025 & 2033
- Figure 29: Asia Pacific Automotive Augmented Reality Revenue Share (%), by Types 2025 & 2033
- Figure 30: Asia Pacific Automotive Augmented Reality Revenue (billion), by Country 2025 & 2033
- Figure 31: Asia Pacific Automotive Augmented Reality Revenue Share (%), by Country 2025 & 2033
List of Tables
- Table 1: Global Automotive Augmented Reality Revenue billion Forecast, by Application 2020 & 2033
- Table 2: Global Automotive Augmented Reality Revenue billion Forecast, by Types 2020 & 2033
- Table 3: Global Automotive Augmented Reality Revenue billion Forecast, by Region 2020 & 2033
- Table 4: Global Automotive Augmented Reality Revenue billion Forecast, by Application 2020 & 2033
- Table 5: Global Automotive Augmented Reality Revenue billion Forecast, by Types 2020 & 2033
- Table 6: Global Automotive Augmented Reality Revenue billion Forecast, by Country 2020 & 2033
- Table 7: United States Automotive Augmented Reality Revenue (billion) Forecast, by Application 2020 & 2033
- Table 8: Canada Automotive Augmented Reality Revenue (billion) Forecast, by Application 2020 & 2033
- Table 9: Mexico Automotive Augmented Reality Revenue (billion) Forecast, by Application 2020 & 2033
- Table 10: Global Automotive Augmented Reality Revenue billion Forecast, by Application 2020 & 2033
- Table 11: Global Automotive Augmented Reality Revenue billion Forecast, by Types 2020 & 2033
- Table 12: Global Automotive Augmented Reality Revenue billion Forecast, by Country 2020 & 2033
- Table 13: Brazil Automotive Augmented Reality Revenue (billion) Forecast, by Application 2020 & 2033
- Table 14: Argentina Automotive Augmented Reality Revenue (billion) Forecast, by Application 2020 & 2033
- Table 15: Rest of South America Automotive Augmented Reality Revenue (billion) Forecast, by Application 2020 & 2033
- Table 16: Global Automotive Augmented Reality Revenue billion Forecast, by Application 2020 & 2033
- Table 17: Global Automotive Augmented Reality Revenue billion Forecast, by Types 2020 & 2033
- Table 18: Global Automotive Augmented Reality Revenue billion Forecast, by Country 2020 & 2033
- Table 19: United Kingdom Automotive Augmented Reality Revenue (billion) Forecast, by Application 2020 & 2033
- Table 20: Germany Automotive Augmented Reality Revenue (billion) Forecast, by Application 2020 & 2033
- Table 21: France Automotive Augmented Reality Revenue (billion) Forecast, by Application 2020 & 2033
- Table 22: Italy Automotive Augmented Reality Revenue (billion) Forecast, by Application 2020 & 2033
- Table 23: Spain Automotive Augmented Reality Revenue (billion) Forecast, by Application 2020 & 2033
- Table 24: Russia Automotive Augmented Reality Revenue (billion) Forecast, by Application 2020 & 2033
- Table 25: Benelux Automotive Augmented Reality Revenue (billion) Forecast, by Application 2020 & 2033
- Table 26: Nordics Automotive Augmented Reality Revenue (billion) Forecast, by Application 2020 & 2033
- Table 27: Rest of Europe Automotive Augmented Reality Revenue (billion) Forecast, by Application 2020 & 2033
- Table 28: Global Automotive Augmented Reality Revenue billion Forecast, by Application 2020 & 2033
- Table 29: Global Automotive Augmented Reality Revenue billion Forecast, by Types 2020 & 2033
- Table 30: Global Automotive Augmented Reality Revenue billion Forecast, by Country 2020 & 2033
- Table 31: Turkey Automotive Augmented Reality Revenue (billion) Forecast, by Application 2020 & 2033
- Table 32: Israel Automotive Augmented Reality Revenue (billion) Forecast, by Application 2020 & 2033
- Table 33: GCC Automotive Augmented Reality Revenue (billion) Forecast, by Application 2020 & 2033
- Table 34: North Africa Automotive Augmented Reality Revenue (billion) Forecast, by Application 2020 & 2033
- Table 35: South Africa Automotive Augmented Reality Revenue (billion) Forecast, by Application 2020 & 2033
- Table 36: Rest of Middle East & Africa Automotive Augmented Reality Revenue (billion) Forecast, by Application 2020 & 2033
- Table 37: Global Automotive Augmented Reality Revenue billion Forecast, by Application 2020 & 2033
- Table 38: Global Automotive Augmented Reality Revenue billion Forecast, by Types 2020 & 2033
- Table 39: Global Automotive Augmented Reality Revenue billion Forecast, by Country 2020 & 2033
- Table 40: China Automotive Augmented Reality Revenue (billion) Forecast, by Application 2020 & 2033
- Table 41: India Automotive Augmented Reality Revenue (billion) Forecast, by Application 2020 & 2033
- Table 42: Japan Automotive Augmented Reality Revenue (billion) Forecast, by Application 2020 & 2033
- Table 43: South Korea Automotive Augmented Reality Revenue (billion) Forecast, by Application 2020 & 2033
- Table 44: ASEAN Automotive Augmented Reality Revenue (billion) Forecast, by Application 2020 & 2033
- Table 45: Oceania Automotive Augmented Reality Revenue (billion) Forecast, by Application 2020 & 2033
- Table 46: Rest of Asia Pacific Automotive Augmented Reality Revenue (billion) Forecast, by Application 2020 & 2033
Frequently Asked Questions
1. What is the projected Compound Annual Growth Rate (CAGR) of the Automotive Augmented Reality?
The projected CAGR is approximately 17.6%.
2. Which companies are prominent players in the Automotive Augmented Reality?
Key companies in the market include Continental AG, Denso Corporation, DigiLens Inc., Garmin Limited, General Motors, Harman International Industries Inc., Hyundai Motor Company, LG Business Solutions, MicroVision, Inc., Nippon Seiki Co, Ltd, Panasonic Corporation, Pioneer Corporation, Robert Bosch GmbH, Texas Instruments Inc., Visteon Corporation, Volkswagen AG, WayRay SA, Yazaki Corporation.
3. What are the main segments of the Automotive Augmented Reality?
The market segments include Application, Types.
4. Can you provide details about the market size?
The market size is estimated to be USD 6.79 billion as of 2022.
5. What are some drivers contributing to market growth?
N/A
6. What are the notable trends driving market growth?
N/A
7. Are there any restraints impacting market growth?
N/A
8. Can you provide examples of recent developments in the market?
N/A
9. What pricing options are available for accessing the report?
Pricing options include single-user, multi-user, and enterprise licenses priced at USD 2900.00, USD 4350.00, and USD 5800.00 respectively.
10. Is the market size provided in terms of value or volume?
The market size is provided in terms of value, measured in billion.
11. Are there any specific market keywords associated with the report?
Yes, the market keyword associated with the report is "Automotive Augmented Reality," which aids in identifying and referencing the specific market segment covered.
12. How do I determine which pricing option suits my needs best?
The pricing options vary based on user requirements and access needs. Individual users may opt for single-user licenses, while businesses requiring broader access may choose multi-user or enterprise licenses for cost-effective access to the report.
13. Are there any additional resources or data provided in the Automotive Augmented Reality report?
While the report offers comprehensive insights, it's advisable to review the specific contents or supplementary materials provided to ascertain if additional resources or data are available.
14. How can I stay updated on further developments or reports in the Automotive Augmented Reality?
To stay informed about further developments, trends, and reports in the Automotive Augmented Reality, consider subscribing to industry newsletters, following relevant companies and organizations, or regularly checking reputable industry news sources and publications.
Methodology
Step 1 - Identification of Relevant Samples Size from Population Database


Step 2 - Approaches for Defining Global Market Size (Value, Volume* & Price*)

Note*: In applicable scenarios
Step 3 - Data Sources
Primary Research
- Web Analytics
- Survey Reports
- Research Institute
- Latest Research Reports
- Opinion Leaders
Secondary Research
- Annual Reports
- White Paper
- Latest Press Release
- Industry Association
- Paid Database
- Investor Presentations

Step 4 - Data Triangulation
Involves using different sources of information in order to increase the validity of a study
These sources are likely to be stakeholders in a program - participants, other researchers, program staff, other community members, and so on.
Then we put all data in single framework & apply various statistical tools to find out the dynamic on the market.
During the analysis stage, feedback from the stakeholder groups would be compared to determine areas of agreement as well as areas of divergence