

Key Insights
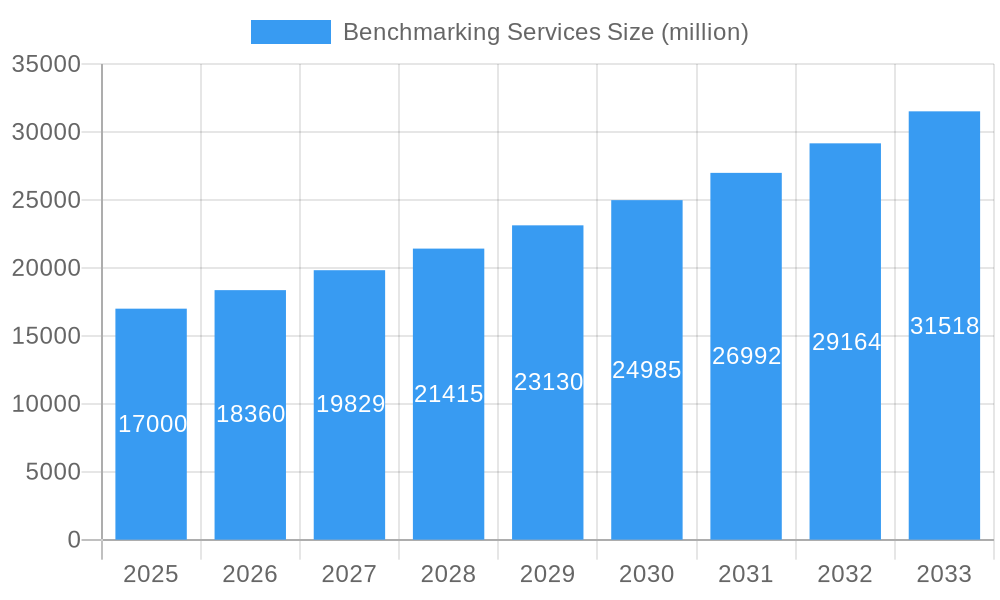
The Benchmarking Services market is poised for significant expansion, driven by the imperative for organizations to enhance operational efficiency and secure a competitive advantage. Key growth drivers include the widespread adoption of advanced analytics for data-informed decision-making, a heightened focus on cost optimization and productivity improvements across industries, and the increasing complexity of business operations necessitating sophisticated performance measurement. Businesses are increasingly utilizing benchmarking services to identify best practices, benchmark against industry leaders, and implement strategic enhancements in areas such as supply chain, human resources, and finance. The proliferation of cloud-based solutions and the integration of benchmarking with business intelligence tools further stimulate market growth. The estimated market size for 2025 is projected to be $2.62 billion, with an anticipated Compound Annual Growth Rate (CAGR) of 9.3% from the base year 2025 through 2033.
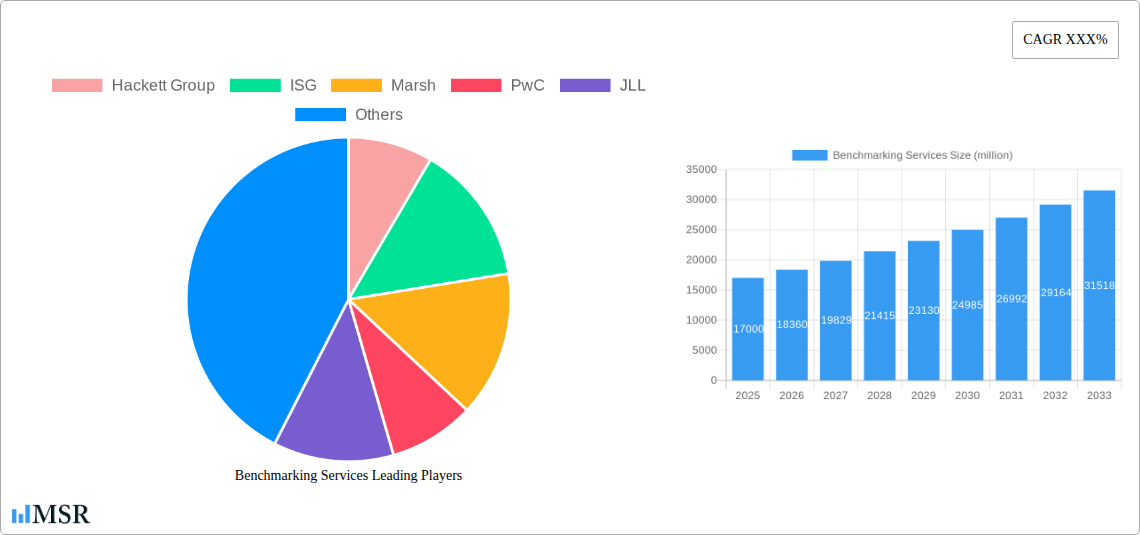
Benchmarking Services Market Size (In Billion)
Despite these promising prospects, certain restraints may impede market expansion. The substantial cost associated with implementing benchmarking programs, particularly for small and medium-sized enterprises, could limit widespread adoption. Furthermore, the requirement for specialized expertise in managing and interpreting benchmarking data, alongside potential data security concerns, may present challenges. Nonetheless, the long-term outlook for the Benchmarking Services market remains robust, fueled by the persistent demand for elevated operational performance and data-driven insights across diverse sectors. The competitive arena features a blend of major consulting firms and specialized service providers, fostering both competition and innovation. Leading entities are expected to differentiate themselves through advanced analytical capabilities, tailored solutions, and seamless integration with existing enterprise systems.
Benchmarking Services Company Market Share
Benchmarking Services Market Report: A Comprehensive Analysis (2019-2033)
This comprehensive report offers an in-depth analysis of the global Benchmarking Services market, providing actionable insights for industry stakeholders. The study covers the period 2019-2033, with a base year of 2025 and a forecast period of 2025-2033. This report leverages extensive market research, encompassing key players like Hackett Group, ISG, Marsh, PwC, JLL, UL LLC, S&P Global, Flatworld Solutions Inc., Verita, Partner Energy, Market Force Information, Datos, Milia Marketing, and UtiliSave, to deliver a robust understanding of market dynamics, trends, and future prospects. The total market value in 2025 is estimated at $xx million, projected to reach $xx million by 2033, exhibiting a CAGR of xx%.
Benchmarking Services Market Concentration & Dynamics
The Benchmarking Services market exhibits a moderately concentrated landscape with a few dominant players holding significant market share. Hackett Group and ISG, for example, collectively account for an estimated xx% of the market in 2025. However, the market is witnessing increased competition from smaller, specialized firms. Market share fluctuations are influenced by factors including innovative product offerings, strategic partnerships, and successful M&A activities.
- Market Concentration: The Herfindahl-Hirschman Index (HHI) is estimated at xx in 2025, indicating a moderately concentrated market.
- Innovation Ecosystems: A vibrant innovation ecosystem exists, driven by technological advancements in data analytics and AI, fostering the development of sophisticated benchmarking tools and platforms.
- Regulatory Frameworks: Government regulations concerning data privacy and security are increasingly impacting market operations, requiring companies to comply with stringent data handling protocols.
- Substitute Products: The emergence of alternative solutions, such as internal benchmarking programs and open-source tools, presents a challenge to market incumbents.
- End-User Trends: The growing demand for data-driven decision-making across various industries is fueling market growth. Industries such as finance, healthcare, and manufacturing are significant adopters.
- M&A Activities: The number of M&A deals in the Benchmarking Services sector has been steadily increasing. In the period 2019-2024, approximately xx M&A deals were recorded, indicating a trend of consolidation.
Benchmarking Services Industry Insights & Trends
The Benchmarking Services market is experiencing significant growth, driven by several key factors. The increasing availability of vast data sets, coupled with advancements in analytics capabilities, enables more comprehensive and accurate benchmarking. Businesses are increasingly recognizing the value of benchmarking to improve operational efficiency, reduce costs, and enhance competitiveness. The market's expansion is further propelled by the growing adoption of cloud-based solutions, providing enhanced scalability and accessibility. Technological disruptions, such as the integration of AI and machine learning, are transforming benchmarking practices, leading to improved accuracy and predictive analytics. Evolving consumer behaviors, particularly the increasing demand for customized and tailored benchmarking solutions, are also shaping market dynamics. This trend has been reflected in a market size of $xx million in 2025, showcasing a substantial growth trajectory, with a considerable rise from $xx million in 2019.
Key Markets & Segments Leading Benchmarking Services
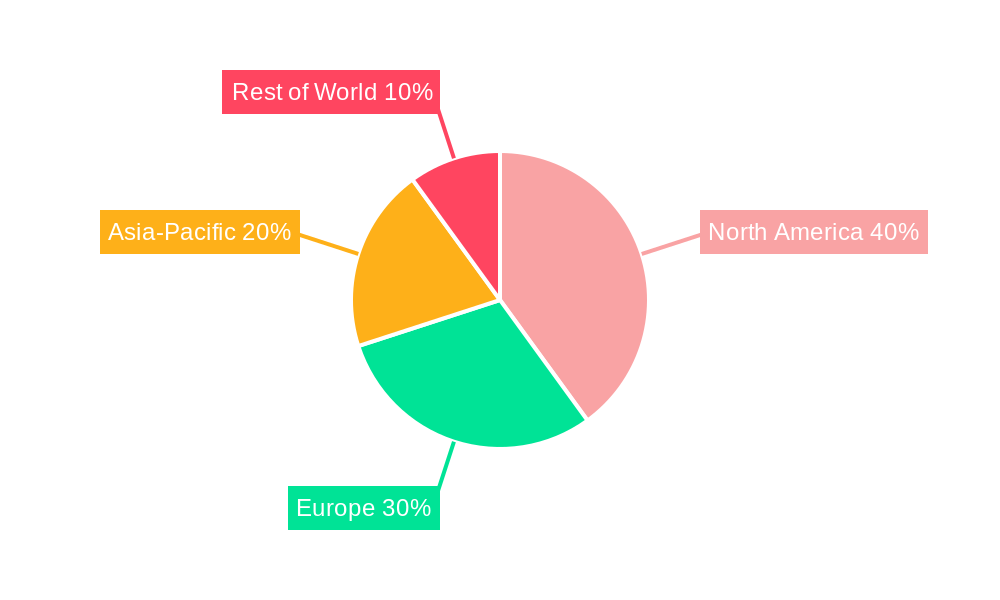
The North American region dominates the global Benchmarking Services market, accounting for an estimated xx% of the total market value in 2025. This dominance is attributable to several key factors:
- Drivers of North American Dominance:
- High adoption of advanced technologies and analytics capabilities.
- Stringent regulatory frameworks promoting data-driven decision-making.
- A robust and mature business environment fostering innovation.
- High concentration of large multinational corporations actively using benchmarking services.
The European and Asia-Pacific regions are also experiencing substantial growth, driven by factors like increasing digitalization and rising demand for efficiency improvements across diverse sectors. Specifically, the financial services and healthcare segments demonstrate particularly strong growth, reflecting a high need for performance optimization and regulatory compliance.
Benchmarking Services Product Developments
Recent years have witnessed significant innovations in benchmarking methodologies and technologies. The development of AI-powered platforms allows for real-time data analysis and predictive modeling, providing businesses with more actionable insights. The integration of cloud-based solutions has improved data accessibility and scalability, while the adoption of advanced visualization tools has made data interpretation more intuitive and efficient. These innovations provide a competitive edge, allowing firms to offer highly customized and specialized benchmarking services that better meet clients' unique needs.
Challenges in the Benchmarking Services Market
The Benchmarking Services market faces various challenges. Data privacy and security concerns are paramount, requiring robust security measures and compliance with regulations like GDPR and CCPA. Supply chain disruptions can impact data availability and the delivery of services, potentially leading to project delays and cost overruns. Furthermore, intense competition from both established players and new entrants necessitates constant innovation and adaptation to maintain market share. The combined impact of these factors can lead to xx% reduction in profit margins for some players.
Forces Driving Benchmarking Services Growth
Technological advancements such as AI and machine learning are major drivers of growth. These technologies enable automated data analysis, improved accuracy, and predictive modeling. Increased globalization and the need for businesses to improve operational efficiency are also significant contributors. Furthermore, supportive regulatory frameworks in certain regions encourage the adoption of benchmarking practices. For example, industry-specific regulations might necessitate comparative performance analysis, thus bolstering market demand.
Long-Term Growth Catalysts in Benchmarking Services
Long-term growth will be fueled by continued innovation in data analytics and the development of more sophisticated benchmarking tools. Strategic partnerships between technology providers and benchmarking service firms will also play a crucial role. The expansion into new geographic markets and vertical industries, particularly in developing economies, presents significant opportunities for growth. This expansion could potentially contribute to a xx% increase in overall market size within the next decade.
Emerging Opportunities in Benchmarking Services
Emerging opportunities lie in the application of benchmarking to address sustainability goals and environmental, social, and governance (ESG) concerns. The increasing demand for ESG-related data and performance analysis presents a significant market opportunity. The expansion into niche markets, such as the public sector, and the development of specialized benchmarking services for specific industries, also represent promising growth areas.
Leading Players in the Benchmarking Services Sector
- Hackett Group
- ISG
- Marsh
- PwC
- JLL
- UL LLC.
- S&P Global
- Flatworld Solutions Inc.
- Verita
- Partner Energy
- Market Force Information
- Datos
- Milia Marketing
- UtiliSave
Key Milestones in Benchmarking Services Industry
- 2020: Increased adoption of cloud-based benchmarking solutions.
- 2021: Several major players launched AI-powered benchmarking platforms.
- 2022: Growing focus on ESG-related benchmarking.
- 2023: Increased regulatory scrutiny of data privacy in benchmarking practices.
- 2024: Several significant M&A activities reshaped the market landscape.
Strategic Outlook for Benchmarking Services Market
The Benchmarking Services market is poised for robust growth, driven by the increasing need for data-driven decision-making and continuous improvement across various industries. Strategic opportunities abound for firms that can leverage technological advancements, adapt to evolving regulatory environments, and cater to the growing demand for customized benchmarking solutions. The potential for market expansion into emerging economies and new industry verticals presents further opportunities for growth and market share gains. This positive outlook suggests a highly promising future for companies operating in this dynamic sector.
Benchmarking Services Segmentation
-
1. Application
- 1.1. Large Enterprises
- 1.2. SMEs
-
2. Type
- 2.1. Business
- 2.2. Energy
- 2.3. Others
Benchmarking Services Segmentation By Geography
-
1. North America
- 1.1. United States
- 1.2. Canada
- 1.3. Mexico
-
2. South America
- 2.1. Brazil
- 2.2. Argentina
- 2.3. Rest of South America
-
3. Europe
- 3.1. United Kingdom
- 3.2. Germany
- 3.3. France
- 3.4. Italy
- 3.5. Spain
- 3.6. Russia
- 3.7. Benelux
- 3.8. Nordics
- 3.9. Rest of Europe
-
4. Middle East & Africa
- 4.1. Turkey
- 4.2. Israel
- 4.3. GCC
- 4.4. North Africa
- 4.5. South Africa
- 4.6. Rest of Middle East & Africa
-
5. Asia Pacific
- 5.1. China
- 5.2. India
- 5.3. Japan
- 5.4. South Korea
- 5.5. ASEAN
- 5.6. Oceania
- 5.7. Rest of Asia Pacific
Benchmarking Services Regional Market Share
Geographic Coverage of Benchmarking Services
Benchmarking Services REPORT HIGHLIGHTS
| Aspects | Details |
|---|---|
| Study Period | 2020-2034 |
| Base Year | 2025 |
| Estimated Year | 2026 |
| Forecast Period | 2026-2034 |
| Historical Period | 2020-2025 |
| Growth Rate | CAGR of 9.3% from 2020-2034 |
| Segmentation |
|
Table of Contents
- 1. Introduction
- 1.1. Research Scope
- 1.2. Market Segmentation
- 1.3. Research Objective
- 1.4. Definitions and Assumptions
- 2. Executive Summary
- 2.1. Market Snapshot
- 3. Market Dynamics
- 3.1. Market Drivers
- 3.2. Market Restrains
- 3.3. Market Trends
- 3.4. Market Opportunities
- 4. Market Factor Analysis
- 4.1. Porters Five Forces
- 4.1.1. Bargaining Power of Suppliers
- 4.1.2. Bargaining Power of Buyers
- 4.1.3. Threat of New Entrants
- 4.1.4. Threat of Substitutes
- 4.1.5. Competitive Rivalry
- 4.2. PESTEL analysis
- 4.3. BCG Analysis
- 4.3.1. Stars (High Growth, High Market Share)
- 4.3.2. Cash Cows (Low Growth, High Market Share)
- 4.3.3. Question Mark (High Growth, Low Market Share)
- 4.3.4. Dogs (Low Growth, Low Market Share)
- 4.4. Ansoff Matrix Analysis
- 4.5. Supply Chain Analysis
- 4.6. Regulatory Landscape
- 4.7. Current Market Potential and Opportunity Assessment (TAM–SAM–SOM Framework)
- 4.8. MSR Analyst Note
- 4.1. Porters Five Forces
- 5. Market Analysis, Insights and Forecast 2021-2033
- 5.1. Market Analysis, Insights and Forecast - by Application
- 5.1.1. Large Enterprises
- 5.1.2. SMEs
- 5.2. Market Analysis, Insights and Forecast - by Type
- 5.2.1. Business
- 5.2.2. Energy
- 5.2.3. Others
- 5.3. Market Analysis, Insights and Forecast - by Region
- 5.3.1. North America
- 5.3.2. South America
- 5.3.3. Europe
- 5.3.4. Middle East & Africa
- 5.3.5. Asia Pacific
- 5.1. Market Analysis, Insights and Forecast - by Application
- 6. Global Benchmarking Services Analysis, Insights and Forecast, 2021-2033
- 6.1. Market Analysis, Insights and Forecast - by Application
- 6.1.1. Large Enterprises
- 6.1.2. SMEs
- 6.2. Market Analysis, Insights and Forecast - by Type
- 6.2.1. Business
- 6.2.2. Energy
- 6.2.3. Others
- 6.1. Market Analysis, Insights and Forecast - by Application
- 7. North America Benchmarking Services Analysis, Insights and Forecast, 2020-2032
- 7.1. Market Analysis, Insights and Forecast - by Application
- 7.1.1. Large Enterprises
- 7.1.2. SMEs
- 7.2. Market Analysis, Insights and Forecast - by Type
- 7.2.1. Business
- 7.2.2. Energy
- 7.2.3. Others
- 7.1. Market Analysis, Insights and Forecast - by Application
- 8. South America Benchmarking Services Analysis, Insights and Forecast, 2020-2032
- 8.1. Market Analysis, Insights and Forecast - by Application
- 8.1.1. Large Enterprises
- 8.1.2. SMEs
- 8.2. Market Analysis, Insights and Forecast - by Type
- 8.2.1. Business
- 8.2.2. Energy
- 8.2.3. Others
- 8.1. Market Analysis, Insights and Forecast - by Application
- 9. Europe Benchmarking Services Analysis, Insights and Forecast, 2020-2032
- 9.1. Market Analysis, Insights and Forecast - by Application
- 9.1.1. Large Enterprises
- 9.1.2. SMEs
- 9.2. Market Analysis, Insights and Forecast - by Type
- 9.2.1. Business
- 9.2.2. Energy
- 9.2.3. Others
- 9.1. Market Analysis, Insights and Forecast - by Application
- 10. Middle East & Africa Benchmarking Services Analysis, Insights and Forecast, 2020-2032
- 10.1. Market Analysis, Insights and Forecast - by Application
- 10.1.1. Large Enterprises
- 10.1.2. SMEs
- 10.2. Market Analysis, Insights and Forecast - by Type
- 10.2.1. Business
- 10.2.2. Energy
- 10.2.3. Others
- 10.1. Market Analysis, Insights and Forecast - by Application
- 11. Asia Pacific Benchmarking Services Analysis, Insights and Forecast, 2020-2032
- 11.1. Market Analysis, Insights and Forecast - by Application
- 11.1.1. Large Enterprises
- 11.1.2. SMEs
- 11.2. Market Analysis, Insights and Forecast - by Type
- 11.2.1. Business
- 11.2.2. Energy
- 11.2.3. Others
- 11.1. Market Analysis, Insights and Forecast - by Application
- 12. Competitive Analysis
- 12.1. Company Profiles
- 12.1.1 Hackett Group
- 12.1.1.1. Company Overview
- 12.1.1.2. Products
- 12.1.1.3. Company Financials
- 12.1.1.4. SWOT Analysis
- 12.1.2 ISG
- 12.1.2.1. Company Overview
- 12.1.2.2. Products
- 12.1.2.3. Company Financials
- 12.1.2.4. SWOT Analysis
- 12.1.3 Marsh
- 12.1.3.1. Company Overview
- 12.1.3.2. Products
- 12.1.3.3. Company Financials
- 12.1.3.4. SWOT Analysis
- 12.1.4 PwC
- 12.1.4.1. Company Overview
- 12.1.4.2. Products
- 12.1.4.3. Company Financials
- 12.1.4.4. SWOT Analysis
- 12.1.5 JLL
- 12.1.5.1. Company Overview
- 12.1.5.2. Products
- 12.1.5.3. Company Financials
- 12.1.5.4. SWOT Analysis
- 12.1.6 UL LLC.
- 12.1.6.1. Company Overview
- 12.1.6.2. Products
- 12.1.6.3. Company Financials
- 12.1.6.4. SWOT Analysis
- 12.1.7 S&P Global
- 12.1.7.1. Company Overview
- 12.1.7.2. Products
- 12.1.7.3. Company Financials
- 12.1.7.4. SWOT Analysis
- 12.1.8 Flatworld Solutions Inc.
- 12.1.8.1. Company Overview
- 12.1.8.2. Products
- 12.1.8.3. Company Financials
- 12.1.8.4. SWOT Analysis
- 12.1.9 Verita
- 12.1.9.1. Company Overview
- 12.1.9.2. Products
- 12.1.9.3. Company Financials
- 12.1.9.4. SWOT Analysis
- 12.1.10 Partner Energy
- 12.1.10.1. Company Overview
- 12.1.10.2. Products
- 12.1.10.3. Company Financials
- 12.1.10.4. SWOT Analysis
- 12.1.11 Market Force Information
- 12.1.11.1. Company Overview
- 12.1.11.2. Products
- 12.1.11.3. Company Financials
- 12.1.11.4. SWOT Analysis
- 12.1.12 Datos
- 12.1.12.1. Company Overview
- 12.1.12.2. Products
- 12.1.12.3. Company Financials
- 12.1.12.4. SWOT Analysis
- 12.1.13 Milia Marketing
- 12.1.13.1. Company Overview
- 12.1.13.2. Products
- 12.1.13.3. Company Financials
- 12.1.13.4. SWOT Analysis
- 12.1.14 UtiliSave
- 12.1.14.1. Company Overview
- 12.1.14.2. Products
- 12.1.14.3. Company Financials
- 12.1.14.4. SWOT Analysis
- 12.1.1 Hackett Group
- 12.2. Market Entropy
- 12.2.1 Company's Key Areas Served
- 12.2.2 Recent Developments
- 12.3. Company Market Share Analysis 2025
- 12.3.1 Top 5 Companies Market Share Analysis
- 12.3.2 Top 3 Companies Market Share Analysis
- 12.4. List of Potential Customers
- 13. Research Methodology
List of Figures
- Figure 1: Global Benchmarking Services Revenue Breakdown (billion, %) by Region 2025 & 2033
- Figure 2: North America Benchmarking Services Revenue (billion), by Application 2025 & 2033
- Figure 3: North America Benchmarking Services Revenue Share (%), by Application 2025 & 2033
- Figure 4: North America Benchmarking Services Revenue (billion), by Type 2025 & 2033
- Figure 5: North America Benchmarking Services Revenue Share (%), by Type 2025 & 2033
- Figure 6: North America Benchmarking Services Revenue (billion), by Country 2025 & 2033
- Figure 7: North America Benchmarking Services Revenue Share (%), by Country 2025 & 2033
- Figure 8: South America Benchmarking Services Revenue (billion), by Application 2025 & 2033
- Figure 9: South America Benchmarking Services Revenue Share (%), by Application 2025 & 2033
- Figure 10: South America Benchmarking Services Revenue (billion), by Type 2025 & 2033
- Figure 11: South America Benchmarking Services Revenue Share (%), by Type 2025 & 2033
- Figure 12: South America Benchmarking Services Revenue (billion), by Country 2025 & 2033
- Figure 13: South America Benchmarking Services Revenue Share (%), by Country 2025 & 2033
- Figure 14: Europe Benchmarking Services Revenue (billion), by Application 2025 & 2033
- Figure 15: Europe Benchmarking Services Revenue Share (%), by Application 2025 & 2033
- Figure 16: Europe Benchmarking Services Revenue (billion), by Type 2025 & 2033
- Figure 17: Europe Benchmarking Services Revenue Share (%), by Type 2025 & 2033
- Figure 18: Europe Benchmarking Services Revenue (billion), by Country 2025 & 2033
- Figure 19: Europe Benchmarking Services Revenue Share (%), by Country 2025 & 2033
- Figure 20: Middle East & Africa Benchmarking Services Revenue (billion), by Application 2025 & 2033
- Figure 21: Middle East & Africa Benchmarking Services Revenue Share (%), by Application 2025 & 2033
- Figure 22: Middle East & Africa Benchmarking Services Revenue (billion), by Type 2025 & 2033
- Figure 23: Middle East & Africa Benchmarking Services Revenue Share (%), by Type 2025 & 2033
- Figure 24: Middle East & Africa Benchmarking Services Revenue (billion), by Country 2025 & 2033
- Figure 25: Middle East & Africa Benchmarking Services Revenue Share (%), by Country 2025 & 2033
- Figure 26: Asia Pacific Benchmarking Services Revenue (billion), by Application 2025 & 2033
- Figure 27: Asia Pacific Benchmarking Services Revenue Share (%), by Application 2025 & 2033
- Figure 28: Asia Pacific Benchmarking Services Revenue (billion), by Type 2025 & 2033
- Figure 29: Asia Pacific Benchmarking Services Revenue Share (%), by Type 2025 & 2033
- Figure 30: Asia Pacific Benchmarking Services Revenue (billion), by Country 2025 & 2033
- Figure 31: Asia Pacific Benchmarking Services Revenue Share (%), by Country 2025 & 2033
List of Tables
- Table 1: Global Benchmarking Services Revenue billion Forecast, by Application 2020 & 2033
- Table 2: Global Benchmarking Services Revenue billion Forecast, by Type 2020 & 2033
- Table 3: Global Benchmarking Services Revenue billion Forecast, by Region 2020 & 2033
- Table 4: Global Benchmarking Services Revenue billion Forecast, by Application 2020 & 2033
- Table 5: Global Benchmarking Services Revenue billion Forecast, by Type 2020 & 2033
- Table 6: Global Benchmarking Services Revenue billion Forecast, by Country 2020 & 2033
- Table 7: United States Benchmarking Services Revenue (billion) Forecast, by Application 2020 & 2033
- Table 8: Canada Benchmarking Services Revenue (billion) Forecast, by Application 2020 & 2033
- Table 9: Mexico Benchmarking Services Revenue (billion) Forecast, by Application 2020 & 2033
- Table 10: Global Benchmarking Services Revenue billion Forecast, by Application 2020 & 2033
- Table 11: Global Benchmarking Services Revenue billion Forecast, by Type 2020 & 2033
- Table 12: Global Benchmarking Services Revenue billion Forecast, by Country 2020 & 2033
- Table 13: Brazil Benchmarking Services Revenue (billion) Forecast, by Application 2020 & 2033
- Table 14: Argentina Benchmarking Services Revenue (billion) Forecast, by Application 2020 & 2033
- Table 15: Rest of South America Benchmarking Services Revenue (billion) Forecast, by Application 2020 & 2033
- Table 16: Global Benchmarking Services Revenue billion Forecast, by Application 2020 & 2033
- Table 17: Global Benchmarking Services Revenue billion Forecast, by Type 2020 & 2033
- Table 18: Global Benchmarking Services Revenue billion Forecast, by Country 2020 & 2033
- Table 19: United Kingdom Benchmarking Services Revenue (billion) Forecast, by Application 2020 & 2033
- Table 20: Germany Benchmarking Services Revenue (billion) Forecast, by Application 2020 & 2033
- Table 21: France Benchmarking Services Revenue (billion) Forecast, by Application 2020 & 2033
- Table 22: Italy Benchmarking Services Revenue (billion) Forecast, by Application 2020 & 2033
- Table 23: Spain Benchmarking Services Revenue (billion) Forecast, by Application 2020 & 2033
- Table 24: Russia Benchmarking Services Revenue (billion) Forecast, by Application 2020 & 2033
- Table 25: Benelux Benchmarking Services Revenue (billion) Forecast, by Application 2020 & 2033
- Table 26: Nordics Benchmarking Services Revenue (billion) Forecast, by Application 2020 & 2033
- Table 27: Rest of Europe Benchmarking Services Revenue (billion) Forecast, by Application 2020 & 2033
- Table 28: Global Benchmarking Services Revenue billion Forecast, by Application 2020 & 2033
- Table 29: Global Benchmarking Services Revenue billion Forecast, by Type 2020 & 2033
- Table 30: Global Benchmarking Services Revenue billion Forecast, by Country 2020 & 2033
- Table 31: Turkey Benchmarking Services Revenue (billion) Forecast, by Application 2020 & 2033
- Table 32: Israel Benchmarking Services Revenue (billion) Forecast, by Application 2020 & 2033
- Table 33: GCC Benchmarking Services Revenue (billion) Forecast, by Application 2020 & 2033
- Table 34: North Africa Benchmarking Services Revenue (billion) Forecast, by Application 2020 & 2033
- Table 35: South Africa Benchmarking Services Revenue (billion) Forecast, by Application 2020 & 2033
- Table 36: Rest of Middle East & Africa Benchmarking Services Revenue (billion) Forecast, by Application 2020 & 2033
- Table 37: Global Benchmarking Services Revenue billion Forecast, by Application 2020 & 2033
- Table 38: Global Benchmarking Services Revenue billion Forecast, by Type 2020 & 2033
- Table 39: Global Benchmarking Services Revenue billion Forecast, by Country 2020 & 2033
- Table 40: China Benchmarking Services Revenue (billion) Forecast, by Application 2020 & 2033
- Table 41: India Benchmarking Services Revenue (billion) Forecast, by Application 2020 & 2033
- Table 42: Japan Benchmarking Services Revenue (billion) Forecast, by Application 2020 & 2033
- Table 43: South Korea Benchmarking Services Revenue (billion) Forecast, by Application 2020 & 2033
- Table 44: ASEAN Benchmarking Services Revenue (billion) Forecast, by Application 2020 & 2033
- Table 45: Oceania Benchmarking Services Revenue (billion) Forecast, by Application 2020 & 2033
- Table 46: Rest of Asia Pacific Benchmarking Services Revenue (billion) Forecast, by Application 2020 & 2033
Frequently Asked Questions
1. What is the projected Compound Annual Growth Rate (CAGR) of the Benchmarking Services?
The projected CAGR is approximately 9.3%.
2. Which companies are prominent players in the Benchmarking Services?
Key companies in the market include Hackett Group, ISG, Marsh, PwC, JLL, UL LLC., S&P Global, Flatworld Solutions Inc., Verita, Partner Energy, Market Force Information, Datos, Milia Marketing, UtiliSave.
3. What are the main segments of the Benchmarking Services?
The market segments include Application, Type.
4. Can you provide details about the market size?
The market size is estimated to be USD 2.62 billion as of 2022.
5. What are some drivers contributing to market growth?
N/A
6. What are the notable trends driving market growth?
N/A
7. Are there any restraints impacting market growth?
N/A
8. Can you provide examples of recent developments in the market?
N/A
9. What pricing options are available for accessing the report?
Pricing options include single-user, multi-user, and enterprise licenses priced at USD 3950.00, USD 5925.00, and USD 7900.00 respectively.
10. Is the market size provided in terms of value or volume?
The market size is provided in terms of value, measured in billion.
11. Are there any specific market keywords associated with the report?
Yes, the market keyword associated with the report is "Benchmarking Services," which aids in identifying and referencing the specific market segment covered.
12. How do I determine which pricing option suits my needs best?
The pricing options vary based on user requirements and access needs. Individual users may opt for single-user licenses, while businesses requiring broader access may choose multi-user or enterprise licenses for cost-effective access to the report.
13. Are there any additional resources or data provided in the Benchmarking Services report?
While the report offers comprehensive insights, it's advisable to review the specific contents or supplementary materials provided to ascertain if additional resources or data are available.
14. How can I stay updated on further developments or reports in the Benchmarking Services?
To stay informed about further developments, trends, and reports in the Benchmarking Services, consider subscribing to industry newsletters, following relevant companies and organizations, or regularly checking reputable industry news sources and publications.
Methodology
Step 1 - Identification of Relevant Samples Size from Population Database


Step 2 - Approaches for Defining Global Market Size (Value, Volume* & Price*)

Note*: In applicable scenarios
Step 3 - Data Sources
Primary Research
- Web Analytics
- Survey Reports
- Research Institute
- Latest Research Reports
- Opinion Leaders
Secondary Research
- Annual Reports
- White Paper
- Latest Press Release
- Industry Association
- Paid Database
- Investor Presentations

Step 4 - Data Triangulation
Involves using different sources of information in order to increase the validity of a study
These sources are likely to be stakeholders in a program - participants, other researchers, program staff, other community members, and so on.
Then we put all data in single framework & apply various statistical tools to find out the dynamic on the market.
During the analysis stage, feedback from the stakeholder groups would be compared to determine areas of agreement as well as areas of divergence