

Key Insights
The Continuous Integration and Continuous Delivery (CI/CD) market is experiencing robust expansion, projected to reach an estimated $15 billion in 2025. This growth is fueled by an impressive Compound Annual Growth Rate (CAGR) of 15% throughout the forecast period of 2025-2033. The increasing adoption of agile methodologies and DevOps practices across industries is a primary driver. Businesses are prioritizing faster software development cycles, improved code quality, and streamlined deployment processes to gain a competitive edge. This demand is particularly pronounced in sectors like IT & Telecom, BFSI, and Manufacturing, where rapid innovation and efficient software delivery are critical for operational success and customer satisfaction. The market is characterized by a strong emphasis on automation, enabling organizations to reduce manual intervention, minimize errors, and accelerate time-to-market.
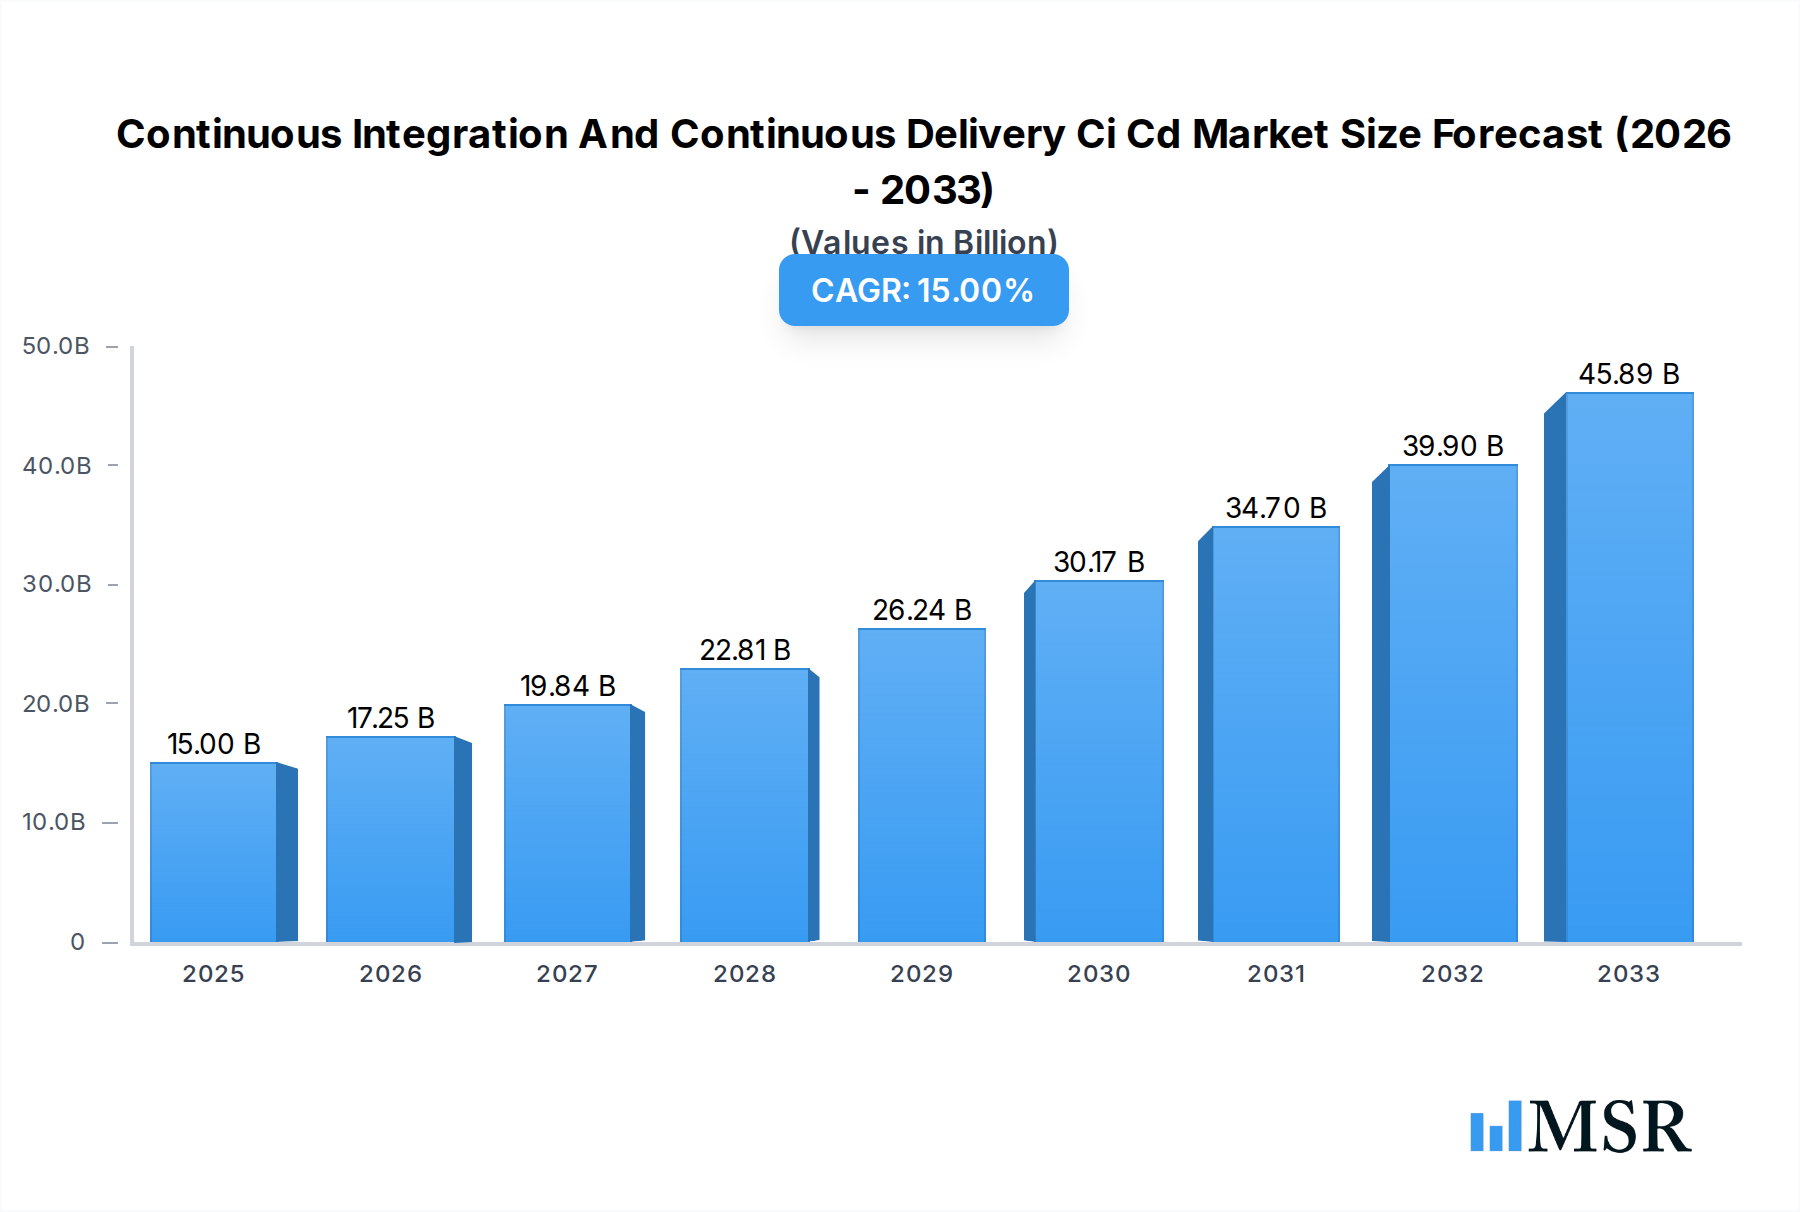
Continuous Integration And Continuous Delivery Ci Cd Market Size (In Billion)
Further analysis reveals that the CI/CD market's trajectory is shaped by a confluence of technological advancements and evolving business needs. Key trends include the widespread adoption of cloud-native CI/CD tools, the integration of AI and machine learning for intelligent automation and anomaly detection, and the rise of security-focused CI/CD pipelines (DevSecOps). While the market enjoys strong growth, certain restraints may emerge, such as the initial cost of implementing comprehensive CI/CD solutions and the need for skilled personnel to manage and optimize these complex systems. However, the overwhelming benefits of improved efficiency, scalability, and reduced risk are expected to outweigh these challenges, ensuring sustained market expansion. The competitive landscape features a mix of established technology giants and specialized CI/CD platform providers, all vying to offer comprehensive and innovative solutions.

Continuous Integration And Continuous Delivery Ci Cd Company Market Share
Unlocking Agility: The Definitive Report on Continuous Integration and Continuous Delivery (CI/CD)
This comprehensive report delves deep into the burgeoning Continuous Integration and Continuous Delivery (CI/CD) market, offering invaluable insights for industry stakeholders. Spanning the study period from 2019 to 2033, with a base year of 2025, this analysis leverages a meticulous forecast period of 2025–2033, building upon detailed historical data from 2019–2024. We dissect market concentration, identify key growth drivers, and illuminate emerging opportunities within this transformative landscape. With a projected market size of XX billion by 2033, this report is your indispensable guide to navigating the future of software development and deployment.
Continuous Integration And Continuous Delivery Ci Cd Market Concentration & Dynamics
The CI/CD market exhibits a dynamic landscape, characterized by both consolidation and rapid innovation. Market concentration is moderately fragmented, with a significant presence of established technology giants alongside nimble, specialized CI/CD solution providers. Key players are actively investing in their DevOps platforms and automation tools, fostering robust innovation ecosystems. Regulatory frameworks are increasingly focusing on software supply chain security and compliance, influencing adoption strategies. Substitute products, such as traditional manual deployment processes, are rapidly becoming obsolete as the benefits of agile development and faster time-to-market become undeniable. End-user trends indicate a strong preference for cloud-native CI/CD solutions and integrated platforms that streamline the entire software development lifecycle (SDLC). Merger and acquisition (M&A) activities are on the rise, with an estimated XX billion in M&A deals over the historical period, signaling a strategic push for market expansion and technological synergy. Leading companies are acquiring smaller players to bolster their DevOps capabilities and expand their service offerings.
Continuous Integration And Continuous Delivery Ci Cd Industry Insights & Trends
The Continuous Integration and Continuous Delivery (CI/CD) industry is experiencing exponential growth, driven by the imperative for organizations to accelerate software delivery cycles and enhance product quality. The global CI/CD market size was valued at XX billion in 2025 and is projected to reach XX billion by 2033, exhibiting a robust Compound Annual Growth Rate (CAGR) of approximately XX% during the forecast period. This phenomenal expansion is fueled by the widespread adoption of DevOps methodologies, which emphasize collaboration and automation between development and operations teams. Technological disruptions are at the forefront, with advancements in containerization technologies like Docker and Kubernetes, and the rise of Infrastructure as Code (IaC) playing pivotal roles in enabling seamless CI/CD pipelines. Evolving consumer behaviors, characterized by a demand for rapid feature updates and seamless user experiences, are compelling businesses across all sectors to prioritize agile software development. The increasing complexity of modern applications and the need for robust testing and deployment strategies further accentuate the significance of CI/CD. The integration of AI and machine learning within CI/CD tools is also a significant trend, promising enhanced code quality analysis, predictive failure detection, and automated release management. This shift towards smarter, more autonomous CI/CD processes is a key indicator of the industry's maturity and future trajectory. The growing emphasis on security in DevOps (DevSecOps) is also driving the integration of security checks throughout the CI/CD pipeline, mitigating risks and ensuring compliance.
Key Markets & Segments Leading Continuous Integration And Continuous Delivery Ci Cd
The CI/CD market is witnessing significant leadership from the IT & Telecom sector, driven by the inherent need for rapid innovation and service delivery in this dynamic industry. However, other application segments are rapidly catching up.
- IT & Telecom: This segment is a dominant force due to the continuous demand for new applications, updates, and infrastructure deployments. The competitive landscape necessitates rapid iteration and a strong focus on automation, making CI/CD a core competency.
- BFSI (Banking, Financial Services, and Insurance): With increasing digital transformation initiatives and the need for enhanced customer experiences, BFSI organizations are heavily investing in CI/CD to deliver secure and compliant financial applications at an accelerated pace.
- Manufacturing: The adoption of Industry 4.0 principles and the integration of IoT devices are driving the need for agile software development in manufacturing. CI/CD enables faster deployment of embedded software and factory automation systems.
- Healthcare: As healthcare providers embrace digital health solutions and electronic health records, CI/CD is crucial for delivering reliable and secure patient management systems and medical devices. The strict regulatory environment also necessitates robust testing and auditable deployment processes.
- Retail: The e-commerce boom and the demand for personalized customer experiences are pushing retail businesses to adopt CI/CD for their online platforms, mobile applications, and inventory management systems.
- Energy: Digitalization in the energy sector, including smart grids and remote monitoring systems, is creating a demand for efficient software development and deployment, positioning CI/CD as a critical enabler.
- Others: This broad category encompasses various industries that are increasingly recognizing the strategic advantage of CI/CD for streamlining their operations and enhancing their digital offerings.
Across these applications, the Continuous Delivery segment is experiencing particularly strong growth, indicating a maturing market where the focus is not just on integration but also on reliable and automated delivery of software into production.
Continuous Integration And Continuous Delivery Ci Cd Product Developments
Product developments in CI/CD are characterized by a relentless pursuit of enhanced automation, intelligence, and security. Innovations are focused on providing end-to-end DevOps platforms that seamlessly integrate source code management, automated testing, build automation, and deployment orchestration. The emergence of AI-powered code analysis tools and predictive analytics for release risk assessment are significantly improving code quality and reducing deployment failures. Furthermore, the integration of security scanning and compliance checks directly into CI/CD pipelines, leading to the rise of DevSecOps, is a major trend, ensuring secure software delivery from the outset.
Challenges in the Continuous Integration And Continuous Delivery Ci Cd Market
Despite its significant growth, the CI/CD market faces several challenges. Organizational resistance to change and a lack of skilled personnel capable of implementing and managing complex DevOps workflows remain significant barriers. The cost of investing in new tools and training can also be a restraint, particularly for smaller enterprises. Furthermore, ensuring robust security and compliance across distributed and hybrid cloud environments requires sophisticated management and can be a complex undertaking. Integration challenges with legacy systems also pose a hurdle for many organizations seeking to adopt modern CI/CD practices.
Forces Driving Continuous Integration And Continuous Delivery Ci Cd Growth
The growth of the CI/CD market is propelled by several key forces. The ever-increasing pace of digital transformation across industries mandates faster software releases and continuous innovation. The widespread adoption of agile methodologies and DevOps culture forms the bedrock for CI/CD implementation. Furthermore, the competitive pressure to deliver superior customer experiences and stay ahead of market trends compels organizations to embrace automation and efficiency in their software development lifecycle. The availability of advanced cloud-based CI/CD tools and the increasing maturity of the DevOps ecosystem further accelerate this growth.
Challenges in the Continuous Integration And Continuous Delivery Ci Cd Market
Long-term growth catalysts for the CI/CD market are deeply rooted in technological evolution and strategic market expansion. The increasing demand for microservices architecture and containerized applications inherently relies on sophisticated CI/CD practices for effective management and deployment. The continued evolution of AI and machine learning within CI/CD tools, promising intelligent automation and proactive issue resolution, will further drive adoption. Strategic partnerships between CI/CD vendors and cloud providers, along with the expansion into emerging economies with growing digital footprints, represent significant long-term growth avenues.
Emerging Opportunities in Continuous Integration And Continuous Delivery Ci Cd
Emerging opportunities in the CI/CD landscape are manifold. The burgeoning field of serverless computing presents a new frontier for optimized CI/CD pipelines, enabling even faster deployment of event-driven applications. The growing emphasis on GitOps, which leverages Git as the single source of truth for declarative infrastructure and applications, is creating new avenues for automated and auditable deployments. Furthermore, the demand for specialized CI/CD solutions tailored for niche industries like IoT development and edge computing is creating untapped market potential. The increasing focus on sustainability in software development is also an emerging trend that CI/CD can address through optimized resource utilization during build and deployment processes.
Leading Players in the Continuous Integration And Continuous Delivery Ci Cd Sector
- Datadog
- AWS
- BMC Software
- Azure
- MicroFocus
- Oracle
- Dynatrace
- SolarWinds
- Splunk
- Huawei Cloud
- Ali Cloud
- New Relic
- IBM
- Cisco
- NetScout
- Microsoft
- Micro Focus
- CircleCI
- CloudBees
- GitLab
- Red Hat
Key Milestones in Continuous Integration And Continuous Delivery Ci Cd Industry
- 2019: Increased adoption of container orchestration platforms like Kubernetes, significantly impacting CI/CD strategies.
- 2020: Rise in focus on DevSecOps, with greater integration of security practices into CI/CD pipelines.
- 2021: Growing prominence of GitOps as a declarative approach to infrastructure and application management.
- 2022: Significant advancements in AI/ML for automated code analysis and predictive failure detection within CI/CD.
- 2023: Expansion of cloud-native CI/CD solutions and increased adoption by enterprises across various sectors.
- 2024: Enhanced focus on supply chain security and auditability within CI/CD workflows.
Strategic Outlook for Continuous Integration And Continuous Delivery Ci Cd Market
The strategic outlook for the CI/CD market is exceptionally positive, driven by the ongoing digital transformation and the relentless pursuit of operational efficiency. Growth accelerators will include the further integration of AI and machine learning for intelligent automation, leading to more predictive and self-healing CI/CD pipelines. Strategic partnerships and alliances between technology providers, cloud platforms, and specialized CI/CD tool vendors will continue to shape the market, offering comprehensive solutions. The expansion of CI/CD adoption into new verticals and its critical role in supporting emerging technologies like edge computing and quantum computing will unlock significant future market potential.
Continuous Integration And Continuous Delivery Ci Cd Segmentation
-
1. Application
- 1.1. BFSI
- 1.2. Manufacturing
- 1.3. Energy
- 1.4. Healthcare
- 1.5. IT & Telecom
- 1.6. Retail
- 1.7. Others
-
2. Type
- 2.1. Continuous Integration
- 2.2. Continuous Delivery
Continuous Integration And Continuous Delivery Ci Cd Segmentation By Geography
-
1. North America
- 1.1. United States
- 1.2. Canada
- 1.3. Mexico
-
2. South America
- 2.1. Brazil
- 2.2. Argentina
- 2.3. Rest of South America
-
3. Europe
- 3.1. United Kingdom
- 3.2. Germany
- 3.3. France
- 3.4. Italy
- 3.5. Spain
- 3.6. Russia
- 3.7. Benelux
- 3.8. Nordics
- 3.9. Rest of Europe
-
4. Middle East & Africa
- 4.1. Turkey
- 4.2. Israel
- 4.3. GCC
- 4.4. North Africa
- 4.5. South Africa
- 4.6. Rest of Middle East & Africa
-
5. Asia Pacific
- 5.1. China
- 5.2. India
- 5.3. Japan
- 5.4. South Korea
- 5.5. ASEAN
- 5.6. Oceania
- 5.7. Rest of Asia Pacific
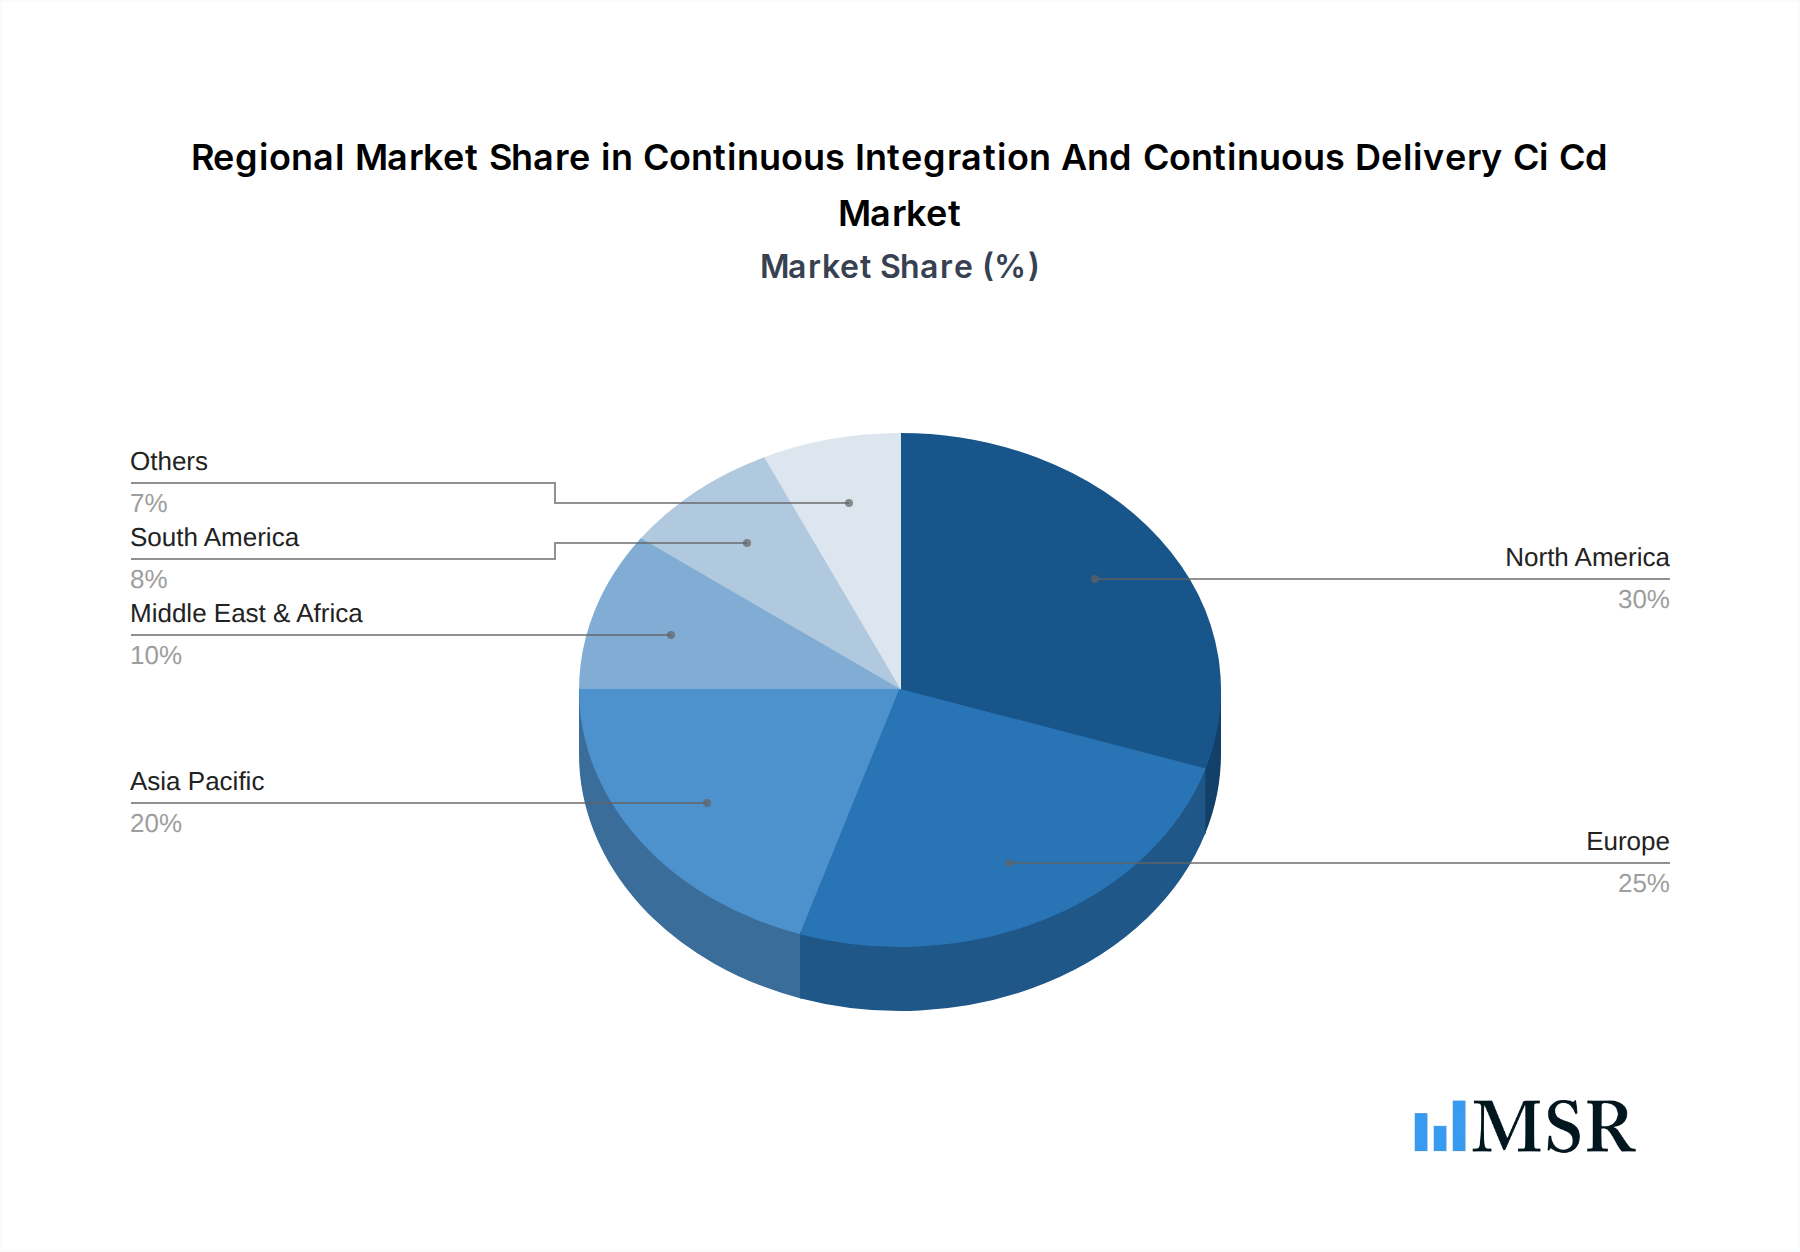
Continuous Integration And Continuous Delivery Ci Cd Regional Market Share
Geographic Coverage of Continuous Integration And Continuous Delivery Ci Cd
Continuous Integration And Continuous Delivery Ci Cd REPORT HIGHLIGHTS
| Aspects | Details |
|---|---|
| Study Period | 2020-2034 |
| Base Year | 2025 |
| Estimated Year | 2026 |
| Forecast Period | 2026-2034 |
| Historical Period | 2020-2025 |
| Growth Rate | CAGR of 15% from 2020-2034 |
| Segmentation |
|
Table of Contents
- 1. Introduction
- 1.1. Research Scope
- 1.2. Market Segmentation
- 1.3. Research Methodology
- 1.4. Definitions and Assumptions
- 2. Executive Summary
- 2.1. Introduction
- 3. Market Dynamics
- 3.1. Introduction
- 3.2. Market Drivers
- 3.3. Market Restrains
- 3.4. Market Trends
- 4. Market Factor Analysis
- 4.1. Porters Five Forces
- 4.2. Supply/Value Chain
- 4.3. PESTEL analysis
- 4.4. Market Entropy
- 4.5. Patent/Trademark Analysis
- 5. Global Continuous Integration And Continuous Delivery Ci Cd Analysis, Insights and Forecast, 2020-2032
- 5.1. Market Analysis, Insights and Forecast - by Application
- 5.1.1. BFSI
- 5.1.2. Manufacturing
- 5.1.3. Energy
- 5.1.4. Healthcare
- 5.1.5. IT & Telecom
- 5.1.6. Retail
- 5.1.7. Others
- 5.2. Market Analysis, Insights and Forecast - by Type
- 5.2.1. Continuous Integration
- 5.2.2. Continuous Delivery
- 5.3. Market Analysis, Insights and Forecast - by Region
- 5.3.1. North America
- 5.3.2. South America
- 5.3.3. Europe
- 5.3.4. Middle East & Africa
- 5.3.5. Asia Pacific
- 5.1. Market Analysis, Insights and Forecast - by Application
- 6. North America Continuous Integration And Continuous Delivery Ci Cd Analysis, Insights and Forecast, 2020-2032
- 6.1. Market Analysis, Insights and Forecast - by Application
- 6.1.1. BFSI
- 6.1.2. Manufacturing
- 6.1.3. Energy
- 6.1.4. Healthcare
- 6.1.5. IT & Telecom
- 6.1.6. Retail
- 6.1.7. Others
- 6.2. Market Analysis, Insights and Forecast - by Type
- 6.2.1. Continuous Integration
- 6.2.2. Continuous Delivery
- 6.1. Market Analysis, Insights and Forecast - by Application
- 7. South America Continuous Integration And Continuous Delivery Ci Cd Analysis, Insights and Forecast, 2020-2032
- 7.1. Market Analysis, Insights and Forecast - by Application
- 7.1.1. BFSI
- 7.1.2. Manufacturing
- 7.1.3. Energy
- 7.1.4. Healthcare
- 7.1.5. IT & Telecom
- 7.1.6. Retail
- 7.1.7. Others
- 7.2. Market Analysis, Insights and Forecast - by Type
- 7.2.1. Continuous Integration
- 7.2.2. Continuous Delivery
- 7.1. Market Analysis, Insights and Forecast - by Application
- 8. Europe Continuous Integration And Continuous Delivery Ci Cd Analysis, Insights and Forecast, 2020-2032
- 8.1. Market Analysis, Insights and Forecast - by Application
- 8.1.1. BFSI
- 8.1.2. Manufacturing
- 8.1.3. Energy
- 8.1.4. Healthcare
- 8.1.5. IT & Telecom
- 8.1.6. Retail
- 8.1.7. Others
- 8.2. Market Analysis, Insights and Forecast - by Type
- 8.2.1. Continuous Integration
- 8.2.2. Continuous Delivery
- 8.1. Market Analysis, Insights and Forecast - by Application
- 9. Middle East & Africa Continuous Integration And Continuous Delivery Ci Cd Analysis, Insights and Forecast, 2020-2032
- 9.1. Market Analysis, Insights and Forecast - by Application
- 9.1.1. BFSI
- 9.1.2. Manufacturing
- 9.1.3. Energy
- 9.1.4. Healthcare
- 9.1.5. IT & Telecom
- 9.1.6. Retail
- 9.1.7. Others
- 9.2. Market Analysis, Insights and Forecast - by Type
- 9.2.1. Continuous Integration
- 9.2.2. Continuous Delivery
- 9.1. Market Analysis, Insights and Forecast - by Application
- 10. Asia Pacific Continuous Integration And Continuous Delivery Ci Cd Analysis, Insights and Forecast, 2020-2032
- 10.1. Market Analysis, Insights and Forecast - by Application
- 10.1.1. BFSI
- 10.1.2. Manufacturing
- 10.1.3. Energy
- 10.1.4. Healthcare
- 10.1.5. IT & Telecom
- 10.1.6. Retail
- 10.1.7. Others
- 10.2. Market Analysis, Insights and Forecast - by Type
- 10.2.1. Continuous Integration
- 10.2.2. Continuous Delivery
- 10.1. Market Analysis, Insights and Forecast - by Application
- 11. Competitive Analysis
- 11.1. Global Market Share Analysis 2025
- 11.2. Company Profiles
- 11.2.1 Datadog
- 11.2.1.1. Overview
- 11.2.1.2. Products
- 11.2.1.3. SWOT Analysis
- 11.2.1.4. Recent Developments
- 11.2.1.5. Financials (Based on Availability)
- 11.2.2 AWS
- 11.2.2.1. Overview
- 11.2.2.2. Products
- 11.2.2.3. SWOT Analysis
- 11.2.2.4. Recent Developments
- 11.2.2.5. Financials (Based on Availability)
- 11.2.3 BMC Software
- 11.2.3.1. Overview
- 11.2.3.2. Products
- 11.2.3.3. SWOT Analysis
- 11.2.3.4. Recent Developments
- 11.2.3.5. Financials (Based on Availability)
- 11.2.4 Azure
- 11.2.4.1. Overview
- 11.2.4.2. Products
- 11.2.4.3. SWOT Analysis
- 11.2.4.4. Recent Developments
- 11.2.4.5. Financials (Based on Availability)
- 11.2.5 MicroFocus
- 11.2.5.1. Overview
- 11.2.5.2. Products
- 11.2.5.3. SWOT Analysis
- 11.2.5.4. Recent Developments
- 11.2.5.5. Financials (Based on Availability)
- 11.2.6 Oracle
- 11.2.6.1. Overview
- 11.2.6.2. Products
- 11.2.6.3. SWOT Analysis
- 11.2.6.4. Recent Developments
- 11.2.6.5. Financials (Based on Availability)
- 11.2.7 Dynatrace
- 11.2.7.1. Overview
- 11.2.7.2. Products
- 11.2.7.3. SWOT Analysis
- 11.2.7.4. Recent Developments
- 11.2.7.5. Financials (Based on Availability)
- 11.2.8 SolarWinds
- 11.2.8.1. Overview
- 11.2.8.2. Products
- 11.2.8.3. SWOT Analysis
- 11.2.8.4. Recent Developments
- 11.2.8.5. Financials (Based on Availability)
- 11.2.9 Splunk
- 11.2.9.1. Overview
- 11.2.9.2. Products
- 11.2.9.3. SWOT Analysis
- 11.2.9.4. Recent Developments
- 11.2.9.5. Financials (Based on Availability)
- 11.2.10 Huawei Cloud
- 11.2.10.1. Overview
- 11.2.10.2. Products
- 11.2.10.3. SWOT Analysis
- 11.2.10.4. Recent Developments
- 11.2.10.5. Financials (Based on Availability)
- 11.2.11 Ali Cloud
- 11.2.11.1. Overview
- 11.2.11.2. Products
- 11.2.11.3. SWOT Analysis
- 11.2.11.4. Recent Developments
- 11.2.11.5. Financials (Based on Availability)
- 11.2.12 New Relic
- 11.2.12.1. Overview
- 11.2.12.2. Products
- 11.2.12.3. SWOT Analysis
- 11.2.12.4. Recent Developments
- 11.2.12.5. Financials (Based on Availability)
- 11.2.13 IBM
- 11.2.13.1. Overview
- 11.2.13.2. Products
- 11.2.13.3. SWOT Analysis
- 11.2.13.4. Recent Developments
- 11.2.13.5. Financials (Based on Availability)
- 11.2.14 Cisco
- 11.2.14.1. Overview
- 11.2.14.2. Products
- 11.2.14.3. SWOT Analysis
- 11.2.14.4. Recent Developments
- 11.2.14.5. Financials (Based on Availability)
- 11.2.15 NetScout
- 11.2.15.1. Overview
- 11.2.15.2. Products
- 11.2.15.3. SWOT Analysis
- 11.2.15.4. Recent Developments
- 11.2.15.5. Financials (Based on Availability)
- 11.2.16 Microsoft
- 11.2.16.1. Overview
- 11.2.16.2. Products
- 11.2.16.3. SWOT Analysis
- 11.2.16.4. Recent Developments
- 11.2.16.5. Financials (Based on Availability)
- 11.2.17 Micro Focus
- 11.2.17.1. Overview
- 11.2.17.2. Products
- 11.2.17.3. SWOT Analysis
- 11.2.17.4. Recent Developments
- 11.2.17.5. Financials (Based on Availability)
- 11.2.18 CircleCI
- 11.2.18.1. Overview
- 11.2.18.2. Products
- 11.2.18.3. SWOT Analysis
- 11.2.18.4. Recent Developments
- 11.2.18.5. Financials (Based on Availability)
- 11.2.19 CloudBees
- 11.2.19.1. Overview
- 11.2.19.2. Products
- 11.2.19.3. SWOT Analysis
- 11.2.19.4. Recent Developments
- 11.2.19.5. Financials (Based on Availability)
- 11.2.20 GitLab
- 11.2.20.1. Overview
- 11.2.20.2. Products
- 11.2.20.3. SWOT Analysis
- 11.2.20.4. Recent Developments
- 11.2.20.5. Financials (Based on Availability)
- 11.2.21 Red Hat
- 11.2.21.1. Overview
- 11.2.21.2. Products
- 11.2.21.3. SWOT Analysis
- 11.2.21.4. Recent Developments
- 11.2.21.5. Financials (Based on Availability)
- 11.2.1 Datadog
List of Figures
- Figure 1: Global Continuous Integration And Continuous Delivery Ci Cd Revenue Breakdown (undefined, %) by Region 2025 & 2033
- Figure 2: North America Continuous Integration And Continuous Delivery Ci Cd Revenue (undefined), by Application 2025 & 2033
- Figure 3: North America Continuous Integration And Continuous Delivery Ci Cd Revenue Share (%), by Application 2025 & 2033
- Figure 4: North America Continuous Integration And Continuous Delivery Ci Cd Revenue (undefined), by Type 2025 & 2033
- Figure 5: North America Continuous Integration And Continuous Delivery Ci Cd Revenue Share (%), by Type 2025 & 2033
- Figure 6: North America Continuous Integration And Continuous Delivery Ci Cd Revenue (undefined), by Country 2025 & 2033
- Figure 7: North America Continuous Integration And Continuous Delivery Ci Cd Revenue Share (%), by Country 2025 & 2033
- Figure 8: South America Continuous Integration And Continuous Delivery Ci Cd Revenue (undefined), by Application 2025 & 2033
- Figure 9: South America Continuous Integration And Continuous Delivery Ci Cd Revenue Share (%), by Application 2025 & 2033
- Figure 10: South America Continuous Integration And Continuous Delivery Ci Cd Revenue (undefined), by Type 2025 & 2033
- Figure 11: South America Continuous Integration And Continuous Delivery Ci Cd Revenue Share (%), by Type 2025 & 2033
- Figure 12: South America Continuous Integration And Continuous Delivery Ci Cd Revenue (undefined), by Country 2025 & 2033
- Figure 13: South America Continuous Integration And Continuous Delivery Ci Cd Revenue Share (%), by Country 2025 & 2033
- Figure 14: Europe Continuous Integration And Continuous Delivery Ci Cd Revenue (undefined), by Application 2025 & 2033
- Figure 15: Europe Continuous Integration And Continuous Delivery Ci Cd Revenue Share (%), by Application 2025 & 2033
- Figure 16: Europe Continuous Integration And Continuous Delivery Ci Cd Revenue (undefined), by Type 2025 & 2033
- Figure 17: Europe Continuous Integration And Continuous Delivery Ci Cd Revenue Share (%), by Type 2025 & 2033
- Figure 18: Europe Continuous Integration And Continuous Delivery Ci Cd Revenue (undefined), by Country 2025 & 2033
- Figure 19: Europe Continuous Integration And Continuous Delivery Ci Cd Revenue Share (%), by Country 2025 & 2033
- Figure 20: Middle East & Africa Continuous Integration And Continuous Delivery Ci Cd Revenue (undefined), by Application 2025 & 2033
- Figure 21: Middle East & Africa Continuous Integration And Continuous Delivery Ci Cd Revenue Share (%), by Application 2025 & 2033
- Figure 22: Middle East & Africa Continuous Integration And Continuous Delivery Ci Cd Revenue (undefined), by Type 2025 & 2033
- Figure 23: Middle East & Africa Continuous Integration And Continuous Delivery Ci Cd Revenue Share (%), by Type 2025 & 2033
- Figure 24: Middle East & Africa Continuous Integration And Continuous Delivery Ci Cd Revenue (undefined), by Country 2025 & 2033
- Figure 25: Middle East & Africa Continuous Integration And Continuous Delivery Ci Cd Revenue Share (%), by Country 2025 & 2033
- Figure 26: Asia Pacific Continuous Integration And Continuous Delivery Ci Cd Revenue (undefined), by Application 2025 & 2033
- Figure 27: Asia Pacific Continuous Integration And Continuous Delivery Ci Cd Revenue Share (%), by Application 2025 & 2033
- Figure 28: Asia Pacific Continuous Integration And Continuous Delivery Ci Cd Revenue (undefined), by Type 2025 & 2033
- Figure 29: Asia Pacific Continuous Integration And Continuous Delivery Ci Cd Revenue Share (%), by Type 2025 & 2033
- Figure 30: Asia Pacific Continuous Integration And Continuous Delivery Ci Cd Revenue (undefined), by Country 2025 & 2033
- Figure 31: Asia Pacific Continuous Integration And Continuous Delivery Ci Cd Revenue Share (%), by Country 2025 & 2033
List of Tables
- Table 1: Global Continuous Integration And Continuous Delivery Ci Cd Revenue undefined Forecast, by Application 2020 & 2033
- Table 2: Global Continuous Integration And Continuous Delivery Ci Cd Revenue undefined Forecast, by Type 2020 & 2033
- Table 3: Global Continuous Integration And Continuous Delivery Ci Cd Revenue undefined Forecast, by Region 2020 & 2033
- Table 4: Global Continuous Integration And Continuous Delivery Ci Cd Revenue undefined Forecast, by Application 2020 & 2033
- Table 5: Global Continuous Integration And Continuous Delivery Ci Cd Revenue undefined Forecast, by Type 2020 & 2033
- Table 6: Global Continuous Integration And Continuous Delivery Ci Cd Revenue undefined Forecast, by Country 2020 & 2033
- Table 7: United States Continuous Integration And Continuous Delivery Ci Cd Revenue (undefined) Forecast, by Application 2020 & 2033
- Table 8: Canada Continuous Integration And Continuous Delivery Ci Cd Revenue (undefined) Forecast, by Application 2020 & 2033
- Table 9: Mexico Continuous Integration And Continuous Delivery Ci Cd Revenue (undefined) Forecast, by Application 2020 & 2033
- Table 10: Global Continuous Integration And Continuous Delivery Ci Cd Revenue undefined Forecast, by Application 2020 & 2033
- Table 11: Global Continuous Integration And Continuous Delivery Ci Cd Revenue undefined Forecast, by Type 2020 & 2033
- Table 12: Global Continuous Integration And Continuous Delivery Ci Cd Revenue undefined Forecast, by Country 2020 & 2033
- Table 13: Brazil Continuous Integration And Continuous Delivery Ci Cd Revenue (undefined) Forecast, by Application 2020 & 2033
- Table 14: Argentina Continuous Integration And Continuous Delivery Ci Cd Revenue (undefined) Forecast, by Application 2020 & 2033
- Table 15: Rest of South America Continuous Integration And Continuous Delivery Ci Cd Revenue (undefined) Forecast, by Application 2020 & 2033
- Table 16: Global Continuous Integration And Continuous Delivery Ci Cd Revenue undefined Forecast, by Application 2020 & 2033
- Table 17: Global Continuous Integration And Continuous Delivery Ci Cd Revenue undefined Forecast, by Type 2020 & 2033
- Table 18: Global Continuous Integration And Continuous Delivery Ci Cd Revenue undefined Forecast, by Country 2020 & 2033
- Table 19: United Kingdom Continuous Integration And Continuous Delivery Ci Cd Revenue (undefined) Forecast, by Application 2020 & 2033
- Table 20: Germany Continuous Integration And Continuous Delivery Ci Cd Revenue (undefined) Forecast, by Application 2020 & 2033
- Table 21: France Continuous Integration And Continuous Delivery Ci Cd Revenue (undefined) Forecast, by Application 2020 & 2033
- Table 22: Italy Continuous Integration And Continuous Delivery Ci Cd Revenue (undefined) Forecast, by Application 2020 & 2033
- Table 23: Spain Continuous Integration And Continuous Delivery Ci Cd Revenue (undefined) Forecast, by Application 2020 & 2033
- Table 24: Russia Continuous Integration And Continuous Delivery Ci Cd Revenue (undefined) Forecast, by Application 2020 & 2033
- Table 25: Benelux Continuous Integration And Continuous Delivery Ci Cd Revenue (undefined) Forecast, by Application 2020 & 2033
- Table 26: Nordics Continuous Integration And Continuous Delivery Ci Cd Revenue (undefined) Forecast, by Application 2020 & 2033
- Table 27: Rest of Europe Continuous Integration And Continuous Delivery Ci Cd Revenue (undefined) Forecast, by Application 2020 & 2033
- Table 28: Global Continuous Integration And Continuous Delivery Ci Cd Revenue undefined Forecast, by Application 2020 & 2033
- Table 29: Global Continuous Integration And Continuous Delivery Ci Cd Revenue undefined Forecast, by Type 2020 & 2033
- Table 30: Global Continuous Integration And Continuous Delivery Ci Cd Revenue undefined Forecast, by Country 2020 & 2033
- Table 31: Turkey Continuous Integration And Continuous Delivery Ci Cd Revenue (undefined) Forecast, by Application 2020 & 2033
- Table 32: Israel Continuous Integration And Continuous Delivery Ci Cd Revenue (undefined) Forecast, by Application 2020 & 2033
- Table 33: GCC Continuous Integration And Continuous Delivery Ci Cd Revenue (undefined) Forecast, by Application 2020 & 2033
- Table 34: North Africa Continuous Integration And Continuous Delivery Ci Cd Revenue (undefined) Forecast, by Application 2020 & 2033
- Table 35: South Africa Continuous Integration And Continuous Delivery Ci Cd Revenue (undefined) Forecast, by Application 2020 & 2033
- Table 36: Rest of Middle East & Africa Continuous Integration And Continuous Delivery Ci Cd Revenue (undefined) Forecast, by Application 2020 & 2033
- Table 37: Global Continuous Integration And Continuous Delivery Ci Cd Revenue undefined Forecast, by Application 2020 & 2033
- Table 38: Global Continuous Integration And Continuous Delivery Ci Cd Revenue undefined Forecast, by Type 2020 & 2033
- Table 39: Global Continuous Integration And Continuous Delivery Ci Cd Revenue undefined Forecast, by Country 2020 & 2033
- Table 40: China Continuous Integration And Continuous Delivery Ci Cd Revenue (undefined) Forecast, by Application 2020 & 2033
- Table 41: India Continuous Integration And Continuous Delivery Ci Cd Revenue (undefined) Forecast, by Application 2020 & 2033
- Table 42: Japan Continuous Integration And Continuous Delivery Ci Cd Revenue (undefined) Forecast, by Application 2020 & 2033
- Table 43: South Korea Continuous Integration And Continuous Delivery Ci Cd Revenue (undefined) Forecast, by Application 2020 & 2033
- Table 44: ASEAN Continuous Integration And Continuous Delivery Ci Cd Revenue (undefined) Forecast, by Application 2020 & 2033
- Table 45: Oceania Continuous Integration And Continuous Delivery Ci Cd Revenue (undefined) Forecast, by Application 2020 & 2033
- Table 46: Rest of Asia Pacific Continuous Integration And Continuous Delivery Ci Cd Revenue (undefined) Forecast, by Application 2020 & 2033
Frequently Asked Questions
1. What is the projected Compound Annual Growth Rate (CAGR) of the Continuous Integration And Continuous Delivery Ci Cd?
The projected CAGR is approximately 15%.
2. Which companies are prominent players in the Continuous Integration And Continuous Delivery Ci Cd?
Key companies in the market include Datadog, AWS, BMC Software, Azure, MicroFocus, Oracle, Dynatrace, SolarWinds, Splunk, Huawei Cloud, Ali Cloud, New Relic, IBM, Cisco, NetScout, Microsoft, Micro Focus, CircleCI, CloudBees, GitLab, Red Hat.
3. What are the main segments of the Continuous Integration And Continuous Delivery Ci Cd?
The market segments include Application, Type.
4. Can you provide details about the market size?
The market size is estimated to be USD XXX N/A as of 2022.
5. What are some drivers contributing to market growth?
N/A
6. What are the notable trends driving market growth?
N/A
7. Are there any restraints impacting market growth?
N/A
8. Can you provide examples of recent developments in the market?
N/A
9. What pricing options are available for accessing the report?
Pricing options include single-user, multi-user, and enterprise licenses priced at USD 3950.00, USD 5925.00, and USD 7900.00 respectively.
10. Is the market size provided in terms of value or volume?
The market size is provided in terms of value, measured in N/A.
11. Are there any specific market keywords associated with the report?
Yes, the market keyword associated with the report is "Continuous Integration And Continuous Delivery Ci Cd," which aids in identifying and referencing the specific market segment covered.
12. How do I determine which pricing option suits my needs best?
The pricing options vary based on user requirements and access needs. Individual users may opt for single-user licenses, while businesses requiring broader access may choose multi-user or enterprise licenses for cost-effective access to the report.
13. Are there any additional resources or data provided in the Continuous Integration And Continuous Delivery Ci Cd report?
While the report offers comprehensive insights, it's advisable to review the specific contents or supplementary materials provided to ascertain if additional resources or data are available.
14. How can I stay updated on further developments or reports in the Continuous Integration And Continuous Delivery Ci Cd?
To stay informed about further developments, trends, and reports in the Continuous Integration And Continuous Delivery Ci Cd, consider subscribing to industry newsletters, following relevant companies and organizations, or regularly checking reputable industry news sources and publications.
Methodology
Step 1 - Identification of Relevant Samples Size from Population Database


Step 2 - Approaches for Defining Global Market Size (Value, Volume* & Price*)

Note*: In applicable scenarios
Step 3 - Data Sources
Primary Research
- Web Analytics
- Survey Reports
- Research Institute
- Latest Research Reports
- Opinion Leaders
Secondary Research
- Annual Reports
- White Paper
- Latest Press Release
- Industry Association
- Paid Database
- Investor Presentations

Step 4 - Data Triangulation
Involves using different sources of information in order to increase the validity of a study
These sources are likely to be stakeholders in a program - participants, other researchers, program staff, other community members, and so on.
Then we put all data in single framework & apply various statistical tools to find out the dynamic on the market.
During the analysis stage, feedback from the stakeholder groups would be compared to determine areas of agreement as well as areas of divergence