

Key Insights
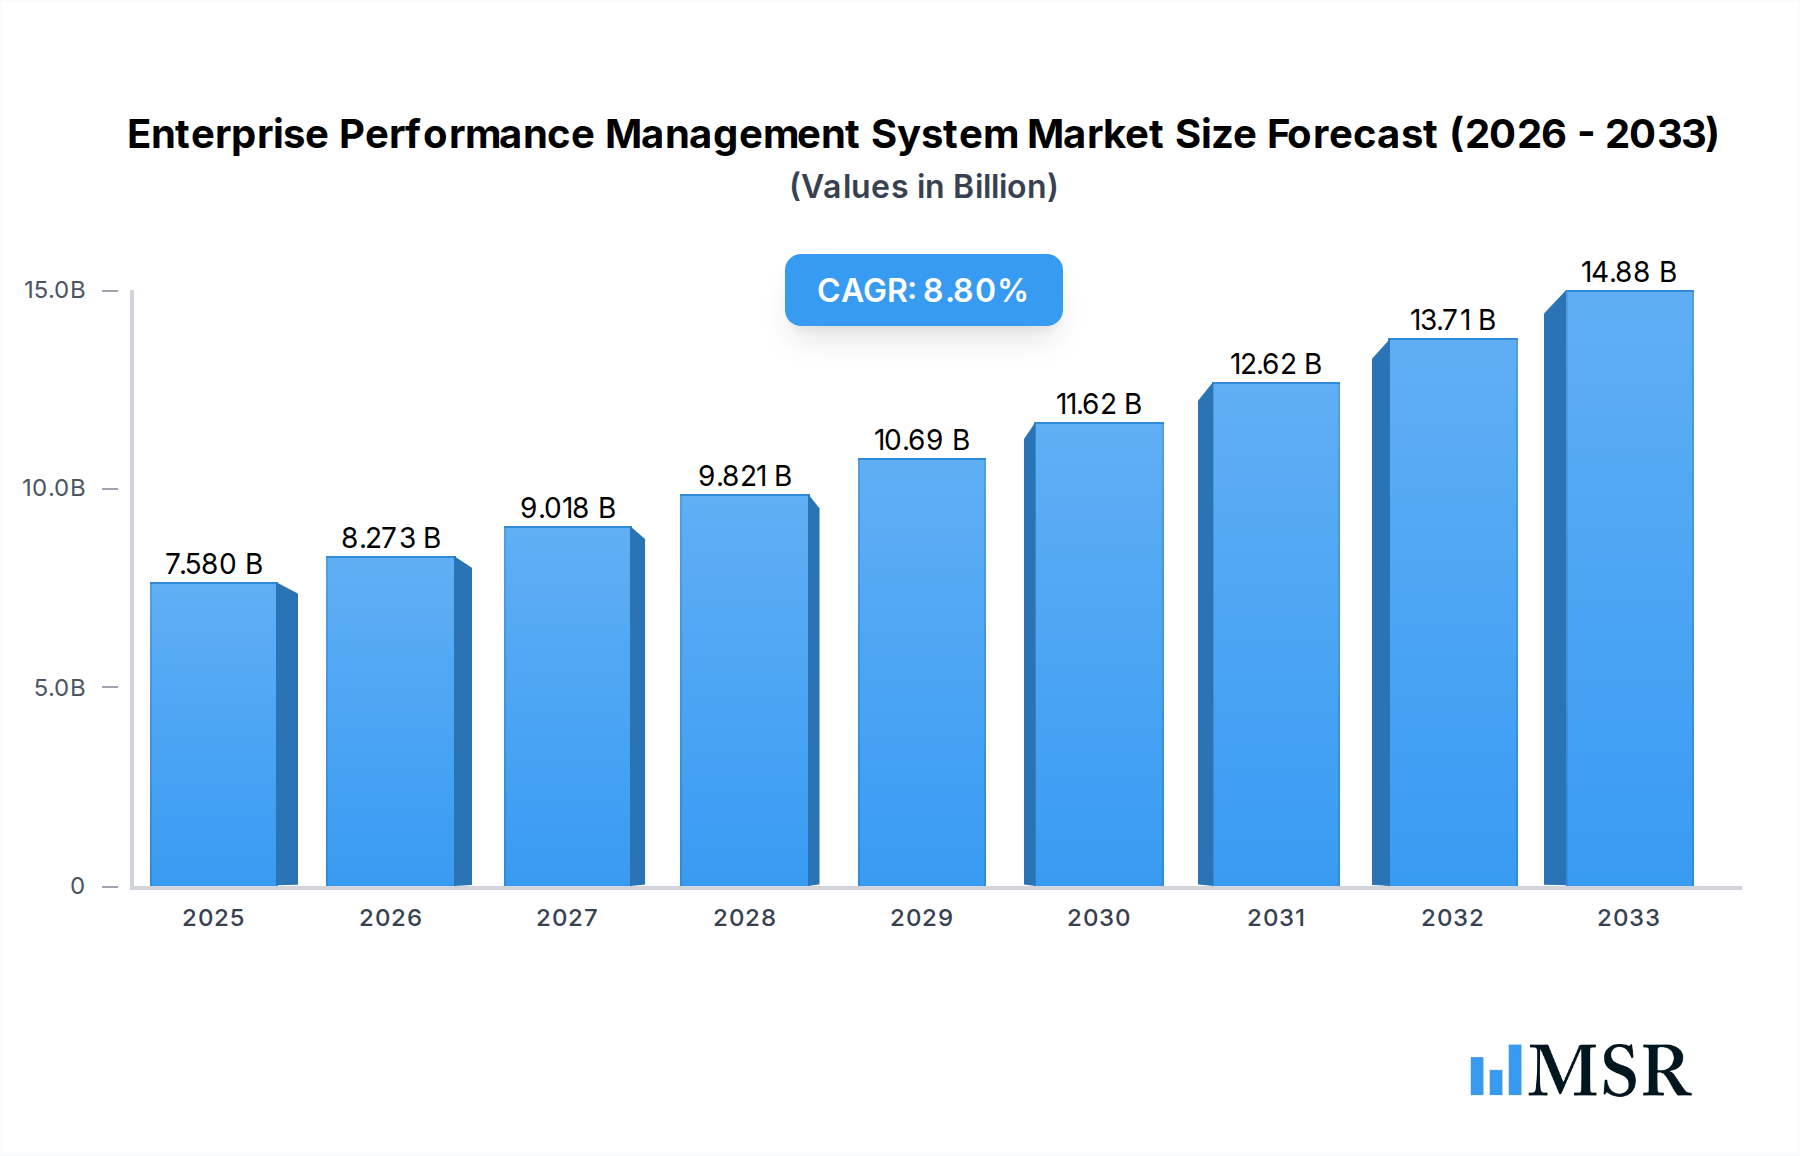
The Enterprise Performance Management (EPM) System market is poised for robust expansion, projected to reach $7.58 billion by 2025, with a significant CAGR of 9.3% expected to drive its trajectory through 2033. This growth is propelled by a confluence of factors, notably the increasing demand for enhanced financial planning, budgeting, forecasting, and reporting capabilities across organizations of all sizes. Businesses are increasingly recognizing the strategic imperative of aligning operational activities with financial objectives to achieve sustainable growth and competitive advantage. The shift towards more agile and data-driven decision-making necessitates sophisticated EPM solutions that can consolidate financial data, automate complex processes, and provide real-time insights. Furthermore, the growing complexity of global markets, regulatory landscapes, and the need for greater transparency in financial reporting are compelling organizations to invest in EPM systems. Small and Medium Enterprises (SMEs) are increasingly adopting cloud-based EPM solutions due to their scalability, cost-effectiveness, and ease of deployment, while larger enterprises are leveraging both cloud and on-premises solutions to meet their specific security and integration requirements.

Enterprise Performance Management System Market Size (In Billion)
Key market drivers include the escalating need for improved business agility, the imperative to optimize resource allocation, and the continuous drive for enhanced profitability and shareholder value. The increasing adoption of digital transformation initiatives and advanced analytics further fuels the demand for comprehensive EPM platforms that can integrate with existing enterprise resource planning (ERP) systems and other business applications. Despite this strong growth outlook, certain restraints, such as the high implementation costs and the perceived complexity of some EPM solutions, may pose challenges. However, the ongoing advancements in cloud technology, artificial intelligence, and machine learning are continuously addressing these concerns, making EPM solutions more accessible and user-friendly. The competitive landscape is marked by a diverse range of players, from established technology giants to specialized EPM vendors, all vying to cater to the evolving needs of the global market. Regional dynamics show a strong presence in North America and Europe, with significant growth potential anticipated in the Asia Pacific region as economies there continue to mature.
Enterprise Performance Management System Company Market Share
Enterprise Performance Management System Market Concentration & Dynamics
The Enterprise Performance Management (EPM) System market is characterized by a moderate to high concentration, with a blend of established giants and innovative niche players shaping the competitive landscape. Leading companies like IBM, BOARD, and Deltek command significant market share, driven by their comprehensive suites and extensive client bases, particularly within Large Enterprises. However, the proliferation of specialized solutions for Small and Medium Enterprises (SMEs) by vendors such as Gtmhub, KPI Fire, and Scientrix is fostering a dynamic ecosystem. Innovation is largely fueled by advancements in AI, machine learning, and predictive analytics, enabling more sophisticated forecasting and strategic planning capabilities. Regulatory frameworks, while generally permissive, are increasingly influenced by data privacy concerns (e.g., GDPR, CCPA), impacting data management and reporting within EPM solutions. Substitute products, such as standalone BI tools and advanced spreadsheets, continue to pose a competitive threat, especially for smaller organizations with less complex needs. End-user trends are heavily skewed towards cloud-based EPM adoption, prioritizing scalability, accessibility, and reduced IT overhead, with on-premises solutions seeing a gradual decline. Mergers and acquisitions (M&A) are a notable dynamic, with larger players acquiring innovative startups to enhance their feature sets and expand market reach. Recent M&A activities suggest a market consolidating around providers offering integrated financial planning and analysis (FP&A) and strategic planning functionalities. Estimated M&A deal counts for the historical period of 2019-2024 stand at approximately 25-30 significant transactions, with a market share distribution where the top 5 players collectively hold around 60-65% of the global EPM market value.
Enterprise Performance Management System Industry Insights & Trends
The global Enterprise Performance Management (EPM) System market is poised for substantial expansion, projected to reach a valuation exceeding 15 billion dollars by 2025, with a robust Compound Annual Growth Rate (CAGR) of approximately 12-14% anticipated from 2025 to 2033. This growth is underpinned by a confluence of potent market drivers, chief among them being the escalating demand for enhanced operational efficiency and strategic agility across all business sectors. Organizations are increasingly recognizing the critical role of EPM in streamlining financial planning and analysis (FP&A), budgeting, forecasting, and performance reporting. Technological disruptions are significantly reshaping the EPM landscape. The integration of Artificial Intelligence (AI) and Machine Learning (ML) is transforming EPM systems from reactive reporting tools into proactive strategic advisors. AI-powered analytics can now identify trends, predict future outcomes with greater accuracy, and automate complex decision-making processes, thereby empowering businesses to make more informed, data-driven choices. Predictive analytics, in particular, is becoming a cornerstone of modern EPM, enabling businesses to anticipate market shifts and proactively adjust their strategies. Cloud-based EPM solutions continue to dominate, offering unparalleled scalability, flexibility, and cost-effectiveness compared to traditional on-premises deployments. This shift is driven by the inherent benefits of reduced infrastructure costs, easier accessibility, and faster deployment cycles, making EPM solutions more attainable for Small and Medium Enterprises (SMEs) as well as Large Enterprises. Evolving consumer behaviors, or rather, evolving enterprise stakeholder behaviors, are also contributing to market growth. Business leaders are demanding more real-time insights and self-service capabilities, pushing vendors to develop intuitive user interfaces and comprehensive dashboarding functionalities. The rise of the "digital enterprise" necessitates seamless integration of EPM with other business systems, such as CRM and ERP, to create a unified view of performance. Furthermore, the increasing complexity of global supply chains and the need for robust risk management are driving the adoption of advanced EPM solutions capable of scenario planning and stress testing. The historical period of 2019-2024 witnessed a steady market expansion, with the market size growing from an estimated 8 billion dollars in 2019 to an estimated 14 billion dollars in 2024, reflecting a CAGR of roughly 11.5%. This trajectory sets a strong foundation for the accelerated growth anticipated in the forecast period.
Key Markets & Segments Leading Enterprise Performance Management System
The Enterprise Performance Management (EPM) System market's dominance is significantly influenced by the Application segment, particularly Large Enterprises, which represent the most substantial portion of the market share, estimated at around 65-70% of the total market value in 2025. This segment's leadership is driven by their complex operational structures, extensive data volumes, and the critical need for sophisticated tools to manage global operations, regulatory compliance, and strategic initiatives. The inherent complexity of managing multiple business units, diverse product lines, and international markets necessitates robust EPM capabilities for consolidated financial reporting, risk management, and performance optimization. Economic growth and robust business infrastructure in developed economies like North America and Europe further bolster the demand within Large Enterprises.
In terms of Type, the Cloud-based segment is rapidly outpacing its on-premises counterpart, projected to capture over 75% of the market by 2025 and continuing its ascendance throughout the forecast period. The drivers behind this shift are manifold:
- Scalability and Flexibility: Cloud EPM solutions offer unparalleled scalability to adapt to fluctuating business needs, allowing companies to expand or contract their usage without significant upfront capital investment. This is particularly advantageous for Large Enterprises experiencing rapid growth or undergoing mergers and acquisitions.
- Cost-Effectiveness: Reduced IT infrastructure and maintenance costs associated with cloud deployments make EPM solutions more accessible, especially for Small and Medium Enterprises (SMEs) that may have limited IT budgets. The subscription-based pricing model further enhances predictability of expenses.
- Accessibility and Collaboration: Cloud-based platforms enable seamless access from anywhere, anytime, fostering better collaboration among geographically dispersed teams. This real-time accessibility is crucial for agile decision-making and timely reporting.
- Faster Deployment and Innovation: Cloud vendors can roll out new features and updates more rapidly, ensuring users benefit from the latest technological advancements, such as AI and ML integrations, without the complex upgrade cycles typical of on-premises systems.
While Large Enterprises dominate in terms of market value, Small and Medium Enterprises (SMEs) represent a significant and rapidly growing segment, accounting for an estimated 30-35% of the market value in 2025 and exhibiting a higher CAGR due to increasing adoption of digital transformation initiatives. The affordability and ease of use of modern cloud EPM solutions are democratizing access to sophisticated performance management tools for smaller organizations. Key regional markets driving this growth include North America (estimated 40% market share), Europe (estimated 30% market share), and the Asia-Pacific region (estimated 20% market share), with emerging markets in Latin America and the Middle East & Africa showing strong growth potential.
Enterprise Performance Management System Product Developments
Product innovation in Enterprise Performance Management (EPM) Systems is currently centered on the integration of advanced AI and machine learning capabilities, enabling predictive analytics, automated forecasting, and intelligent anomaly detection. Vendors are focusing on enhancing user experience through intuitive dashboards, self-service analytics, and natural language processing for easier data interaction. Key applications include integrated financial planning and analysis (FP&A), strategic planning, budgeting, forecasting, profitability and cost management, and performance reporting. These advancements equip businesses with real-time insights, empowering them to make faster, data-driven decisions and adapt to dynamic market conditions. The competitive edge lies in offering seamless integration with existing ERP and CRM systems, ensuring a unified view of business performance.
Challenges in the Enterprise Performance Management System Market
The Enterprise Performance Management (EPM) System market faces several significant challenges that can impede widespread adoption and growth. Data integration complexity remains a primary hurdle, as consolidating disparate data sources from various legacy systems and applications often requires extensive IT resources and expertise. Resistance to change and lack of skilled personnel within organizations can also slow down EPM implementation and user adoption. Furthermore, the high cost of some advanced EPM solutions, particularly for smaller businesses, can be a deterrent. Ensuring data security and compliance with evolving regulations like GDPR and CCPA adds another layer of complexity, demanding robust data governance strategies. Competitive pressures from integrated ERP suites and advanced BI tools also necessitate continuous innovation and feature differentiation.
Forces Driving Enterprise Performance Management System Growth
The Enterprise Performance Management (EPM) System market is propelled by several key growth forces. The escalating need for real-time data visibility and actionable insights to navigate complex business environments is paramount. Digital transformation initiatives across industries are driving the adoption of integrated EPM solutions for enhanced strategic planning and operational efficiency. Advancements in AI and machine learning are revolutionizing EPM capabilities, enabling predictive analytics, automated forecasting, and more sophisticated scenario planning. The increasing global competition and the demand for greater financial agility and accountability further fuel the market. The scalability and cost-effectiveness of cloud-based EPM solutions are democratizing access for a broader range of businesses.
Challenges in the Enterprise Performance Management System Market
Long-term growth catalysts for the Enterprise Performance Management (EPM) System market are rooted in continued technological innovation and evolving business demands. The sustained integration of AI and machine learning will unlock new levels of predictive accuracy and automation, transforming EPM into an indispensable strategic partner for businesses. Strategic partnerships and ecosystem development, where EPM vendors collaborate with ERP, CRM, and data visualization providers, will create more comprehensive and integrated solutions. Market expansion into underserved emerging economies presents significant growth potential as these regions digitize and mature their business operations. Furthermore, the increasing focus on Environmental, Social, and Governance (ESG) reporting will create new functionalities and demand for EPM systems that can track and report on non-financial performance metrics.
Emerging Opportunities in Enterprise Performance Management System
Emerging opportunities in the Enterprise Performance Management (EPM) System market are abundant and diverse. The burgeoning demand for ESG (Environmental, Social, and Governance) performance management represents a significant new avenue for EPM solutions, as companies globally are required to report on sustainability metrics. The increasing adoption of AI-powered prescriptive analytics offers opportunities to move beyond prediction to recommending specific actions for optimized performance. The growth of the SME segment, driven by more accessible and affordable cloud-based EPM solutions, presents a vast untapped market. Furthermore, the development of industry-specific EPM solutions, tailored to the unique needs of sectors like healthcare, retail, and manufacturing, offers niche growth potential. Opportunities also lie in enhancing real-time data integration and visualization capabilities to provide instant, actionable insights.
Leading Players in the Enterprise Performance Management System Sector
- BOARD
- Gtmhub
- Corporater
- KPI Fire
- Scientrix
- Harmony Business Systems
- Deltek
- IBM
- Clearview Software
- Silvon Software
- FloQast
- Aviso
- Phocas Software
- Angbert Enterprises Portal
- Kitonik s.r.o.
Key Milestones in Enterprise Performance Management System Industry
- 2019: Increased focus on AI and machine learning integration in EPM platforms, enhancing predictive analytics capabilities.
- 2020: Significant acceleration in cloud-based EPM adoption due to remote work trends and the need for greater flexibility and scalability.
- 2021: Rise of integrated EPM and CPM (Corporate Performance Management) solutions, consolidating financial and operational planning.
- 2022: Growing emphasis on ESG (Environmental, Social, and Governance) reporting features within EPM systems.
- 2023: Enhanced user experience and self-service analytics become key differentiators for EPM vendors.
- 2024: Increased M&A activity as larger players acquire innovative startups with specialized AI or niche industry capabilities.
Strategic Outlook for Enterprise Performance Management System Market
The strategic outlook for the Enterprise Performance Management (EPM) System market remains exceptionally positive, driven by ongoing digital transformation and the increasing imperative for data-driven decision-making. Future growth accelerators will stem from the deeper integration of AI and machine learning to offer not just predictive but also prescriptive analytics, guiding businesses towards optimal strategies. The expansion of cloud-native EPM solutions will continue to democratize access, particularly for SMEs, while also providing robust scalability for Large Enterprises. Strategic opportunities lie in developing specialized EPM solutions for emerging industries and catering to the growing demand for ESG performance tracking. Partnerships and ecosystem integration will be crucial for delivering comprehensive, end-to-end business management platforms.
Enterprise Performance Management System Segmentation
-
1. Application
- 1.1. Small and Medium Enterprises (SMEs)
- 1.2. Large Enterprises
-
2. Type
- 2.1. Cloud-based
- 2.2. On-premises
Enterprise Performance Management System Segmentation By Geography
-
1. North America
- 1.1. United States
- 1.2. Canada
- 1.3. Mexico
-
2. South America
- 2.1. Brazil
- 2.2. Argentina
- 2.3. Rest of South America
-
3. Europe
- 3.1. United Kingdom
- 3.2. Germany
- 3.3. France
- 3.4. Italy
- 3.5. Spain
- 3.6. Russia
- 3.7. Benelux
- 3.8. Nordics
- 3.9. Rest of Europe
-
4. Middle East & Africa
- 4.1. Turkey
- 4.2. Israel
- 4.3. GCC
- 4.4. North Africa
- 4.5. South Africa
- 4.6. Rest of Middle East & Africa
-
5. Asia Pacific
- 5.1. China
- 5.2. India
- 5.3. Japan
- 5.4. South Korea
- 5.5. ASEAN
- 5.6. Oceania
- 5.7. Rest of Asia Pacific
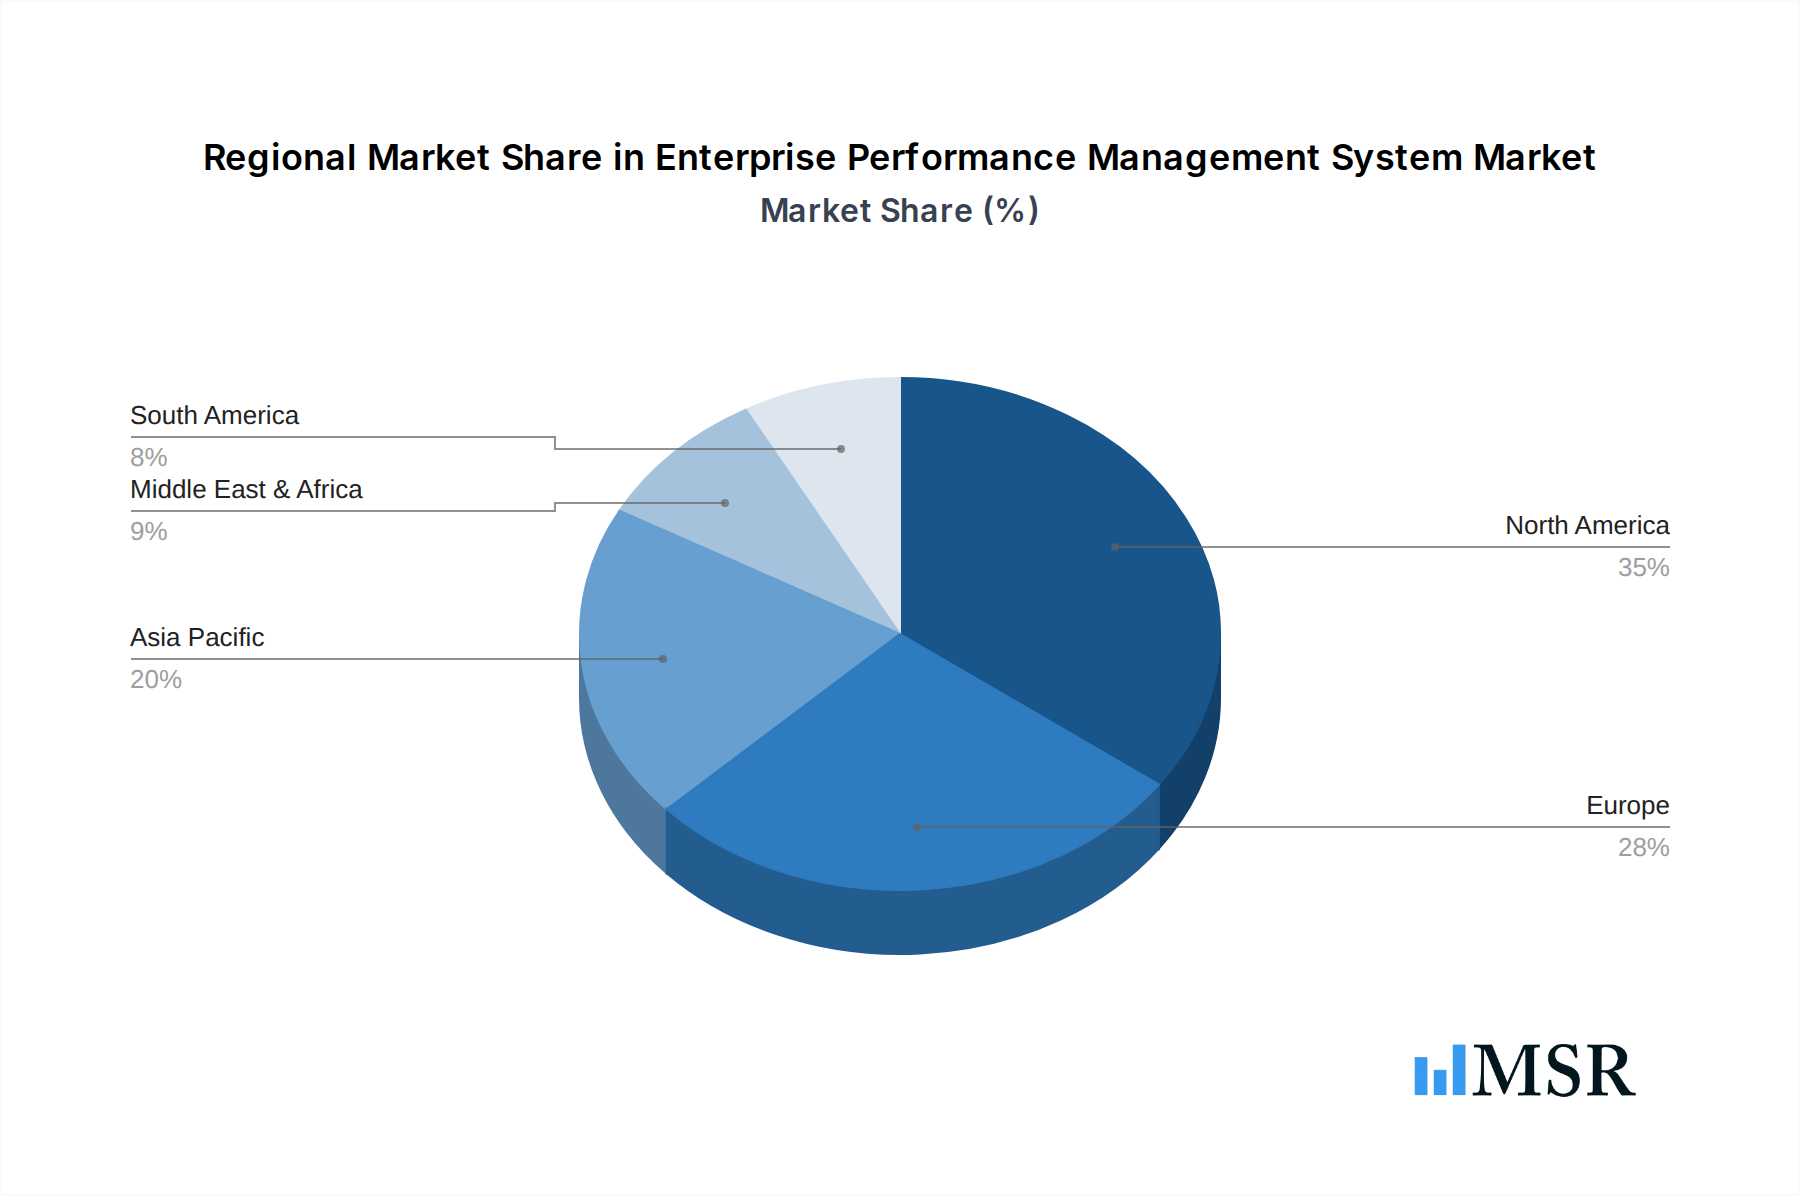
Enterprise Performance Management System Regional Market Share
Geographic Coverage of Enterprise Performance Management System
Enterprise Performance Management System REPORT HIGHLIGHTS
| Aspects | Details |
|---|---|
| Study Period | 2020-2034 |
| Base Year | 2025 |
| Estimated Year | 2026 |
| Forecast Period | 2026-2034 |
| Historical Period | 2020-2025 |
| Growth Rate | CAGR of 9.3% from 2020-2034 |
| Segmentation |
|
Table of Contents
- 1. Introduction
- 1.1. Research Scope
- 1.2. Market Segmentation
- 1.3. Research Methodology
- 1.4. Definitions and Assumptions
- 2. Executive Summary
- 2.1. Introduction
- 3. Market Dynamics
- 3.1. Introduction
- 3.2. Market Drivers
- 3.3. Market Restrains
- 3.4. Market Trends
- 4. Market Factor Analysis
- 4.1. Porters Five Forces
- 4.2. Supply/Value Chain
- 4.3. PESTEL analysis
- 4.4. Market Entropy
- 4.5. Patent/Trademark Analysis
- 5. Global Enterprise Performance Management System Analysis, Insights and Forecast, 2020-2032
- 5.1. Market Analysis, Insights and Forecast - by Application
- 5.1.1. Small and Medium Enterprises (SMEs)
- 5.1.2. Large Enterprises
- 5.2. Market Analysis, Insights and Forecast - by Type
- 5.2.1. Cloud-based
- 5.2.2. On-premises
- 5.3. Market Analysis, Insights and Forecast - by Region
- 5.3.1. North America
- 5.3.2. South America
- 5.3.3. Europe
- 5.3.4. Middle East & Africa
- 5.3.5. Asia Pacific
- 5.1. Market Analysis, Insights and Forecast - by Application
- 6. North America Enterprise Performance Management System Analysis, Insights and Forecast, 2020-2032
- 6.1. Market Analysis, Insights and Forecast - by Application
- 6.1.1. Small and Medium Enterprises (SMEs)
- 6.1.2. Large Enterprises
- 6.2. Market Analysis, Insights and Forecast - by Type
- 6.2.1. Cloud-based
- 6.2.2. On-premises
- 6.1. Market Analysis, Insights and Forecast - by Application
- 7. South America Enterprise Performance Management System Analysis, Insights and Forecast, 2020-2032
- 7.1. Market Analysis, Insights and Forecast - by Application
- 7.1.1. Small and Medium Enterprises (SMEs)
- 7.1.2. Large Enterprises
- 7.2. Market Analysis, Insights and Forecast - by Type
- 7.2.1. Cloud-based
- 7.2.2. On-premises
- 7.1. Market Analysis, Insights and Forecast - by Application
- 8. Europe Enterprise Performance Management System Analysis, Insights and Forecast, 2020-2032
- 8.1. Market Analysis, Insights and Forecast - by Application
- 8.1.1. Small and Medium Enterprises (SMEs)
- 8.1.2. Large Enterprises
- 8.2. Market Analysis, Insights and Forecast - by Type
- 8.2.1. Cloud-based
- 8.2.2. On-premises
- 8.1. Market Analysis, Insights and Forecast - by Application
- 9. Middle East & Africa Enterprise Performance Management System Analysis, Insights and Forecast, 2020-2032
- 9.1. Market Analysis, Insights and Forecast - by Application
- 9.1.1. Small and Medium Enterprises (SMEs)
- 9.1.2. Large Enterprises
- 9.2. Market Analysis, Insights and Forecast - by Type
- 9.2.1. Cloud-based
- 9.2.2. On-premises
- 9.1. Market Analysis, Insights and Forecast - by Application
- 10. Asia Pacific Enterprise Performance Management System Analysis, Insights and Forecast, 2020-2032
- 10.1. Market Analysis, Insights and Forecast - by Application
- 10.1.1. Small and Medium Enterprises (SMEs)
- 10.1.2. Large Enterprises
- 10.2. Market Analysis, Insights and Forecast - by Type
- 10.2.1. Cloud-based
- 10.2.2. On-premises
- 10.1. Market Analysis, Insights and Forecast - by Application
- 11. Competitive Analysis
- 11.1. Global Market Share Analysis 2025
- 11.2. Company Profiles
- 11.2.1 BOARD
- 11.2.1.1. Overview
- 11.2.1.2. Products
- 11.2.1.3. SWOT Analysis
- 11.2.1.4. Recent Developments
- 11.2.1.5. Financials (Based on Availability)
- 11.2.2 Gtmhub
- 11.2.2.1. Overview
- 11.2.2.2. Products
- 11.2.2.3. SWOT Analysis
- 11.2.2.4. Recent Developments
- 11.2.2.5. Financials (Based on Availability)
- 11.2.3 Corporater
- 11.2.3.1. Overview
- 11.2.3.2. Products
- 11.2.3.3. SWOT Analysis
- 11.2.3.4. Recent Developments
- 11.2.3.5. Financials (Based on Availability)
- 11.2.4 KPI Fire
- 11.2.4.1. Overview
- 11.2.4.2. Products
- 11.2.4.3. SWOT Analysis
- 11.2.4.4. Recent Developments
- 11.2.4.5. Financials (Based on Availability)
- 11.2.5 Scientrix
- 11.2.5.1. Overview
- 11.2.5.2. Products
- 11.2.5.3. SWOT Analysis
- 11.2.5.4. Recent Developments
- 11.2.5.5. Financials (Based on Availability)
- 11.2.6 Harmony Business Systems
- 11.2.6.1. Overview
- 11.2.6.2. Products
- 11.2.6.3. SWOT Analysis
- 11.2.6.4. Recent Developments
- 11.2.6.5. Financials (Based on Availability)
- 11.2.7 Deltek
- 11.2.7.1. Overview
- 11.2.7.2. Products
- 11.2.7.3. SWOT Analysis
- 11.2.7.4. Recent Developments
- 11.2.7.5. Financials (Based on Availability)
- 11.2.8 IBM
- 11.2.8.1. Overview
- 11.2.8.2. Products
- 11.2.8.3. SWOT Analysis
- 11.2.8.4. Recent Developments
- 11.2.8.5. Financials (Based on Availability)
- 11.2.9 Clearview Software
- 11.2.9.1. Overview
- 11.2.9.2. Products
- 11.2.9.3. SWOT Analysis
- 11.2.9.4. Recent Developments
- 11.2.9.5. Financials (Based on Availability)
- 11.2.10 Silvon Software
- 11.2.10.1. Overview
- 11.2.10.2. Products
- 11.2.10.3. SWOT Analysis
- 11.2.10.4. Recent Developments
- 11.2.10.5. Financials (Based on Availability)
- 11.2.11 FloQast
- 11.2.11.1. Overview
- 11.2.11.2. Products
- 11.2.11.3. SWOT Analysis
- 11.2.11.4. Recent Developments
- 11.2.11.5. Financials (Based on Availability)
- 11.2.12 Aviso
- 11.2.12.1. Overview
- 11.2.12.2. Products
- 11.2.12.3. SWOT Analysis
- 11.2.12.4. Recent Developments
- 11.2.12.5. Financials (Based on Availability)
- 11.2.13 Phocas Software
- 11.2.13.1. Overview
- 11.2.13.2. Products
- 11.2.13.3. SWOT Analysis
- 11.2.13.4. Recent Developments
- 11.2.13.5. Financials (Based on Availability)
- 11.2.14 Angbert Enterprises Portal
- 11.2.14.1. Overview
- 11.2.14.2. Products
- 11.2.14.3. SWOT Analysis
- 11.2.14.4. Recent Developments
- 11.2.14.5. Financials (Based on Availability)
- 11.2.15 Kitonik s.r.o.
- 11.2.15.1. Overview
- 11.2.15.2. Products
- 11.2.15.3. SWOT Analysis
- 11.2.15.4. Recent Developments
- 11.2.15.5. Financials (Based on Availability)
- 11.2.1 BOARD
List of Figures
- Figure 1: Global Enterprise Performance Management System Revenue Breakdown (undefined, %) by Region 2025 & 2033
- Figure 2: North America Enterprise Performance Management System Revenue (undefined), by Application 2025 & 2033
- Figure 3: North America Enterprise Performance Management System Revenue Share (%), by Application 2025 & 2033
- Figure 4: North America Enterprise Performance Management System Revenue (undefined), by Type 2025 & 2033
- Figure 5: North America Enterprise Performance Management System Revenue Share (%), by Type 2025 & 2033
- Figure 6: North America Enterprise Performance Management System Revenue (undefined), by Country 2025 & 2033
- Figure 7: North America Enterprise Performance Management System Revenue Share (%), by Country 2025 & 2033
- Figure 8: South America Enterprise Performance Management System Revenue (undefined), by Application 2025 & 2033
- Figure 9: South America Enterprise Performance Management System Revenue Share (%), by Application 2025 & 2033
- Figure 10: South America Enterprise Performance Management System Revenue (undefined), by Type 2025 & 2033
- Figure 11: South America Enterprise Performance Management System Revenue Share (%), by Type 2025 & 2033
- Figure 12: South America Enterprise Performance Management System Revenue (undefined), by Country 2025 & 2033
- Figure 13: South America Enterprise Performance Management System Revenue Share (%), by Country 2025 & 2033
- Figure 14: Europe Enterprise Performance Management System Revenue (undefined), by Application 2025 & 2033
- Figure 15: Europe Enterprise Performance Management System Revenue Share (%), by Application 2025 & 2033
- Figure 16: Europe Enterprise Performance Management System Revenue (undefined), by Type 2025 & 2033
- Figure 17: Europe Enterprise Performance Management System Revenue Share (%), by Type 2025 & 2033
- Figure 18: Europe Enterprise Performance Management System Revenue (undefined), by Country 2025 & 2033
- Figure 19: Europe Enterprise Performance Management System Revenue Share (%), by Country 2025 & 2033
- Figure 20: Middle East & Africa Enterprise Performance Management System Revenue (undefined), by Application 2025 & 2033
- Figure 21: Middle East & Africa Enterprise Performance Management System Revenue Share (%), by Application 2025 & 2033
- Figure 22: Middle East & Africa Enterprise Performance Management System Revenue (undefined), by Type 2025 & 2033
- Figure 23: Middle East & Africa Enterprise Performance Management System Revenue Share (%), by Type 2025 & 2033
- Figure 24: Middle East & Africa Enterprise Performance Management System Revenue (undefined), by Country 2025 & 2033
- Figure 25: Middle East & Africa Enterprise Performance Management System Revenue Share (%), by Country 2025 & 2033
- Figure 26: Asia Pacific Enterprise Performance Management System Revenue (undefined), by Application 2025 & 2033
- Figure 27: Asia Pacific Enterprise Performance Management System Revenue Share (%), by Application 2025 & 2033
- Figure 28: Asia Pacific Enterprise Performance Management System Revenue (undefined), by Type 2025 & 2033
- Figure 29: Asia Pacific Enterprise Performance Management System Revenue Share (%), by Type 2025 & 2033
- Figure 30: Asia Pacific Enterprise Performance Management System Revenue (undefined), by Country 2025 & 2033
- Figure 31: Asia Pacific Enterprise Performance Management System Revenue Share (%), by Country 2025 & 2033
List of Tables
- Table 1: Global Enterprise Performance Management System Revenue undefined Forecast, by Application 2020 & 2033
- Table 2: Global Enterprise Performance Management System Revenue undefined Forecast, by Type 2020 & 2033
- Table 3: Global Enterprise Performance Management System Revenue undefined Forecast, by Region 2020 & 2033
- Table 4: Global Enterprise Performance Management System Revenue undefined Forecast, by Application 2020 & 2033
- Table 5: Global Enterprise Performance Management System Revenue undefined Forecast, by Type 2020 & 2033
- Table 6: Global Enterprise Performance Management System Revenue undefined Forecast, by Country 2020 & 2033
- Table 7: United States Enterprise Performance Management System Revenue (undefined) Forecast, by Application 2020 & 2033
- Table 8: Canada Enterprise Performance Management System Revenue (undefined) Forecast, by Application 2020 & 2033
- Table 9: Mexico Enterprise Performance Management System Revenue (undefined) Forecast, by Application 2020 & 2033
- Table 10: Global Enterprise Performance Management System Revenue undefined Forecast, by Application 2020 & 2033
- Table 11: Global Enterprise Performance Management System Revenue undefined Forecast, by Type 2020 & 2033
- Table 12: Global Enterprise Performance Management System Revenue undefined Forecast, by Country 2020 & 2033
- Table 13: Brazil Enterprise Performance Management System Revenue (undefined) Forecast, by Application 2020 & 2033
- Table 14: Argentina Enterprise Performance Management System Revenue (undefined) Forecast, by Application 2020 & 2033
- Table 15: Rest of South America Enterprise Performance Management System Revenue (undefined) Forecast, by Application 2020 & 2033
- Table 16: Global Enterprise Performance Management System Revenue undefined Forecast, by Application 2020 & 2033
- Table 17: Global Enterprise Performance Management System Revenue undefined Forecast, by Type 2020 & 2033
- Table 18: Global Enterprise Performance Management System Revenue undefined Forecast, by Country 2020 & 2033
- Table 19: United Kingdom Enterprise Performance Management System Revenue (undefined) Forecast, by Application 2020 & 2033
- Table 20: Germany Enterprise Performance Management System Revenue (undefined) Forecast, by Application 2020 & 2033
- Table 21: France Enterprise Performance Management System Revenue (undefined) Forecast, by Application 2020 & 2033
- Table 22: Italy Enterprise Performance Management System Revenue (undefined) Forecast, by Application 2020 & 2033
- Table 23: Spain Enterprise Performance Management System Revenue (undefined) Forecast, by Application 2020 & 2033
- Table 24: Russia Enterprise Performance Management System Revenue (undefined) Forecast, by Application 2020 & 2033
- Table 25: Benelux Enterprise Performance Management System Revenue (undefined) Forecast, by Application 2020 & 2033
- Table 26: Nordics Enterprise Performance Management System Revenue (undefined) Forecast, by Application 2020 & 2033
- Table 27: Rest of Europe Enterprise Performance Management System Revenue (undefined) Forecast, by Application 2020 & 2033
- Table 28: Global Enterprise Performance Management System Revenue undefined Forecast, by Application 2020 & 2033
- Table 29: Global Enterprise Performance Management System Revenue undefined Forecast, by Type 2020 & 2033
- Table 30: Global Enterprise Performance Management System Revenue undefined Forecast, by Country 2020 & 2033
- Table 31: Turkey Enterprise Performance Management System Revenue (undefined) Forecast, by Application 2020 & 2033
- Table 32: Israel Enterprise Performance Management System Revenue (undefined) Forecast, by Application 2020 & 2033
- Table 33: GCC Enterprise Performance Management System Revenue (undefined) Forecast, by Application 2020 & 2033
- Table 34: North Africa Enterprise Performance Management System Revenue (undefined) Forecast, by Application 2020 & 2033
- Table 35: South Africa Enterprise Performance Management System Revenue (undefined) Forecast, by Application 2020 & 2033
- Table 36: Rest of Middle East & Africa Enterprise Performance Management System Revenue (undefined) Forecast, by Application 2020 & 2033
- Table 37: Global Enterprise Performance Management System Revenue undefined Forecast, by Application 2020 & 2033
- Table 38: Global Enterprise Performance Management System Revenue undefined Forecast, by Type 2020 & 2033
- Table 39: Global Enterprise Performance Management System Revenue undefined Forecast, by Country 2020 & 2033
- Table 40: China Enterprise Performance Management System Revenue (undefined) Forecast, by Application 2020 & 2033
- Table 41: India Enterprise Performance Management System Revenue (undefined) Forecast, by Application 2020 & 2033
- Table 42: Japan Enterprise Performance Management System Revenue (undefined) Forecast, by Application 2020 & 2033
- Table 43: South Korea Enterprise Performance Management System Revenue (undefined) Forecast, by Application 2020 & 2033
- Table 44: ASEAN Enterprise Performance Management System Revenue (undefined) Forecast, by Application 2020 & 2033
- Table 45: Oceania Enterprise Performance Management System Revenue (undefined) Forecast, by Application 2020 & 2033
- Table 46: Rest of Asia Pacific Enterprise Performance Management System Revenue (undefined) Forecast, by Application 2020 & 2033
Frequently Asked Questions
1. What is the projected Compound Annual Growth Rate (CAGR) of the Enterprise Performance Management System?
The projected CAGR is approximately 9.3%.
2. Which companies are prominent players in the Enterprise Performance Management System?
Key companies in the market include BOARD, Gtmhub, Corporater, KPI Fire, Scientrix, Harmony Business Systems, Deltek, IBM, Clearview Software, Silvon Software, FloQast, Aviso, Phocas Software, Angbert Enterprises Portal, Kitonik s.r.o..
3. What are the main segments of the Enterprise Performance Management System?
The market segments include Application, Type.
4. Can you provide details about the market size?
The market size is estimated to be USD XXX N/A as of 2022.
5. What are some drivers contributing to market growth?
N/A
6. What are the notable trends driving market growth?
N/A
7. Are there any restraints impacting market growth?
N/A
8. Can you provide examples of recent developments in the market?
N/A
9. What pricing options are available for accessing the report?
Pricing options include single-user, multi-user, and enterprise licenses priced at USD 4250.00, USD 6375.00, and USD 8500.00 respectively.
10. Is the market size provided in terms of value or volume?
The market size is provided in terms of value, measured in N/A.
11. Are there any specific market keywords associated with the report?
Yes, the market keyword associated with the report is "Enterprise Performance Management System," which aids in identifying and referencing the specific market segment covered.
12. How do I determine which pricing option suits my needs best?
The pricing options vary based on user requirements and access needs. Individual users may opt for single-user licenses, while businesses requiring broader access may choose multi-user or enterprise licenses for cost-effective access to the report.
13. Are there any additional resources or data provided in the Enterprise Performance Management System report?
While the report offers comprehensive insights, it's advisable to review the specific contents or supplementary materials provided to ascertain if additional resources or data are available.
14. How can I stay updated on further developments or reports in the Enterprise Performance Management System?
To stay informed about further developments, trends, and reports in the Enterprise Performance Management System, consider subscribing to industry newsletters, following relevant companies and organizations, or regularly checking reputable industry news sources and publications.
Methodology
Step 1 - Identification of Relevant Samples Size from Population Database


Step 2 - Approaches for Defining Global Market Size (Value, Volume* & Price*)

Note*: In applicable scenarios
Step 3 - Data Sources
Primary Research
- Web Analytics
- Survey Reports
- Research Institute
- Latest Research Reports
- Opinion Leaders
Secondary Research
- Annual Reports
- White Paper
- Latest Press Release
- Industry Association
- Paid Database
- Investor Presentations

Step 4 - Data Triangulation
Involves using different sources of information in order to increase the validity of a study
These sources are likely to be stakeholders in a program - participants, other researchers, program staff, other community members, and so on.
Then we put all data in single framework & apply various statistical tools to find out the dynamic on the market.
During the analysis stage, feedback from the stakeholder groups would be compared to determine areas of agreement as well as areas of divergence