

Key Insights
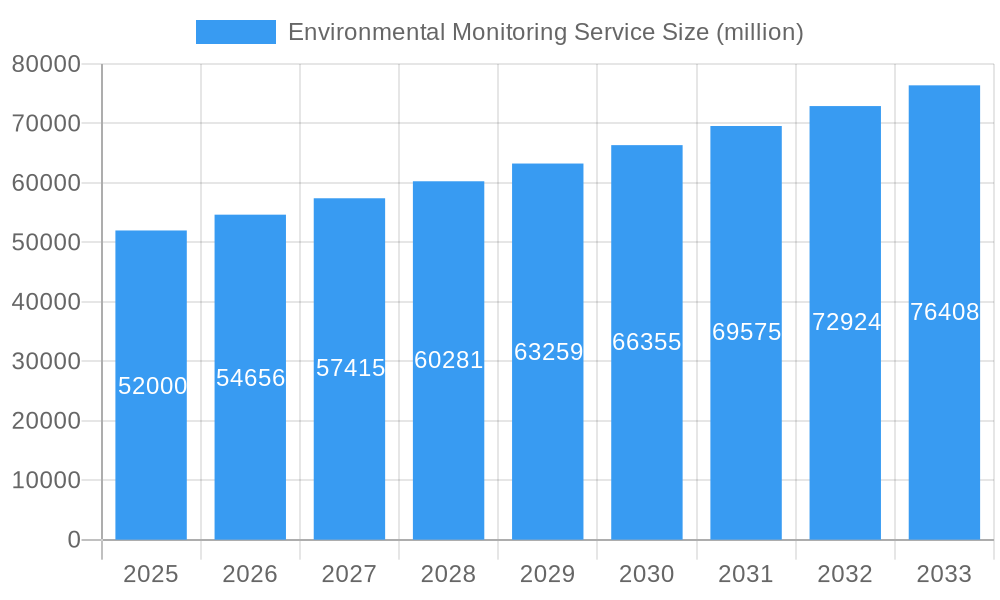
The global Environmental Monitoring Service market is poised for significant expansion, projected to reach an estimated $52,000 million by 2025 and ascend to $78,000 million by 2033, demonstrating a robust Compound Annual Growth Rate (CAGR) of 5.2% from 2025 to 2033. This growth is primarily fueled by an escalating global emphasis on public health, stringent environmental regulations, and a growing awareness of the critical role of environmental quality in sectors ranging from hospitality to education and healthcare. The increasing demand for advanced monitoring solutions to detect and mitigate pollutants in air, water, and soil, coupled with the proactive need to ensure safe and healthy indoor environments in public spaces like hotels, restaurants, and fitness centers, are key drivers. Furthermore, the integration of IoT and AI technologies is revolutionizing the field, enabling real-time data acquisition, predictive analytics, and more efficient compliance management, thereby underpinning the market's upward trajectory.
Environmental Monitoring Service Market Size (In Billion)
The market segmentation reveals a dynamic landscape. The Hardware segment, encompassing sensors, analyzers, and data loggers, forms the foundational layer for effective environmental monitoring, while the Software segment, offering data management, analysis platforms, and reporting tools, is experiencing rapid innovation and adoption. Geographically, North America is anticipated to lead the market in terms of size and adoption, driven by advanced technological infrastructure and a mature regulatory framework. However, the Asia Pacific region is expected to witness the fastest growth due to rapid industrialization, increasing environmental concerns, and substantial investments in public health infrastructure. Key players such as Thermo Fisher Scientific, Vaisala, and Eurofins Environment Testing are instrumental in shaping market trends through continuous product development and strategic collaborations, catering to diverse application needs across industries. The growing concern over indoor air quality in schools and restaurants, alongside the need for robust environmental surveillance in healthcare facilities, are further accelerating the demand for these specialized services.
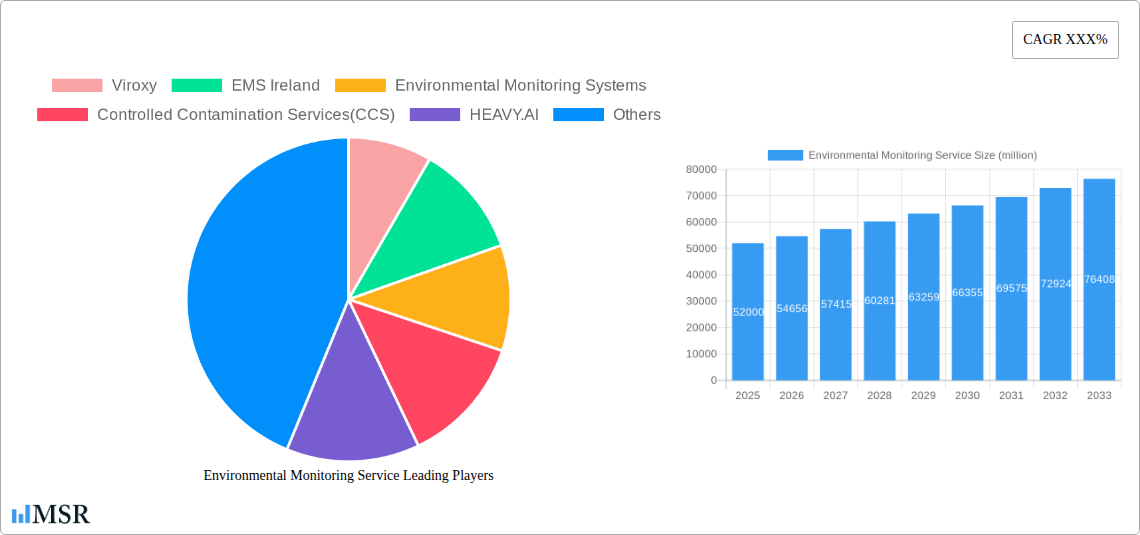
Environmental Monitoring Service Company Market Share
Comprehensive Environmental Monitoring Service Market Report: Insights, Trends, and Forecasts (2019-2033)
This comprehensive report delves into the dynamic Environmental Monitoring Service market, providing an in-depth analysis of its structure, trends, and future trajectory. Covering the period from 2019 to 2033, with a base year of 2025, this study offers actionable insights for industry stakeholders, investors, and decision-makers. We explore key market segments, technological innovations, regulatory landscapes, and competitive dynamics, equipping you with the knowledge to navigate this rapidly evolving sector.
Environmental Monitoring Service Market Concentration & Dynamics
The Environmental Monitoring Service market exhibits a moderate to high concentration, with key players such as Thermo Fisher Scientific, Yokogawa Electric, and Vaisala holding significant market share. The innovation ecosystem is robust, driven by continuous advancements in sensor technology, data analytics platforms, and IoT integration. Regulatory frameworks, including stringent environmental protection laws and compliance mandates, are shaping the demand for reliable monitoring solutions across various sectors. The emergence of substitute products, such as more affordable DIY monitoring kits, presents a challenge, yet the demand for accredited and certified professional services remains strong. End-user trends are increasingly focused on real-time data, predictive analytics, and comprehensive environmental compliance. Mergers and acquisitions (M&A) activities are a notable feature, with approximately 50 significant deals recorded in the historical period (2019-2024), consolidating market share and expanding service portfolios. Companies like Eurofins Environment Testing and Ramboll have been active acquirers, strengthening their global presence.
Environmental Monitoring Service Industry Insights & Trends
The global Environmental Monitoring Service market is projected for substantial growth, estimated at USD 25,000 million in the base year 2025, with a projected compound annual growth rate (CAGR) of 8.5% during the forecast period of 2025–2033. This expansion is fueled by a confluence of factors, including escalating environmental awareness among consumers and corporations, increasing government regulations mandating air and water quality monitoring, and the growing need for industrial process optimization. Technological disruptions are at the forefront of this evolution. The integration of the Internet of Things (IoT) is revolutionizing data collection, enabling real-time, continuous monitoring and remote accessibility. Advanced sensor technologies, offering higher precision and the ability to detect a wider range of pollutants, are becoming more sophisticated and cost-effective. Artificial intelligence (AI) and machine learning (ML) algorithms are transforming raw data into actionable insights, facilitating predictive maintenance and early detection of environmental anomalies. Evolving consumer behaviors are also playing a crucial role; businesses across sectors like hospitality (Hotels), education (Schools), and food service (Restaurants) are prioritizing sustainability and transparency, driving demand for environmental performance reporting. The fitness industry (Fitness Centres) is also increasingly focused on indoor air quality for member well-being. Furthermore, the expansion of smart cities initiatives and the growing emphasis on public health are creating new avenues for Environmental Monitoring Systems and services. The market size is expected to reach approximately USD 45,000 million by 2033. The increased adoption of Software solutions for data management and analysis, coupled with the development of sophisticated Hardware for diverse monitoring needs, underscores the dynamic nature of this industry.
Key Markets & Segments Leading Environmental Monitoring Service
The Environmental Monitoring Service market's dominance is strategically distributed across several key regions and segments, driven by distinct economic, regulatory, and demographic factors. In terms of geographical reach, North America, particularly the United States, currently leads, propelled by robust industrial sectors, stringent environmental regulations, and significant investment in research and development. Europe, with its strong commitment to sustainability and ambitious environmental targets, follows closely. Asia-Pacific is emerging as a high-growth region, fueled by rapid industrialization and increasing environmental consciousness in countries like China and India.
Within the Application segments, the Others category, encompassing industrial manufacturing, power generation, and agriculture, represents the largest market share, accounting for an estimated 35% of the total market value. This is directly attributable to the high volume of emissions and waste generated by these sectors, necessitating continuous and comprehensive monitoring for compliance and operational efficiency. The Hotels segment is experiencing significant growth, driven by guest demand for sustainable and healthy environments, leading to increased monitoring of indoor air quality, water usage, and waste management. Schools and Fitness Centres are also key growth areas, with a growing focus on ensuring healthy indoor environments for students and members, respectively. The Restaurants segment, while smaller, is driven by food safety regulations and a desire to showcase eco-friendly practices.
The Type segment is witnessing a parallel growth in both Hardware and Software solutions. The Hardware segment, comprising a wide array of sensors, detectors, and sampling equipment, is foundational, with an estimated market share of 55%. Innovations in miniaturization, energy efficiency, and multi-parameter sensing are driving its expansion. Companies like Teledyne Technologies and Vaisala are prominent in this domain. Simultaneously, the Software segment is experiencing rapid expansion, with an estimated market share of 45%, and a higher CAGR due to its critical role in data analysis, visualization, and reporting. Environmental Systems Research Institute (Esri) and HEAVY.AI are leading players in providing advanced analytical platforms, enabling businesses to derive meaningful insights from environmental data. The interoperability of Hardware and Software solutions, often through IoT platforms, is becoming a critical differentiator, creating integrated Environmental Monitoring Solutions (EMS).
- Drivers for Dominance in North America & Europe:
- Strict regulatory frameworks and enforcement agencies.
- High industrial output and complex environmental challenges.
- Advanced technological adoption and R&D investments.
- Strong consumer and corporate demand for sustainability.
- Drivers for Growth in Asia-Pacific:
- Rapid industrialization and urbanization.
- Increasing government focus on environmental protection.
- Growing awareness of health impacts of pollution.
- Emergence of local players and increasing affordability of solutions.
- Dominance of "Others" Application Segment:
- High volume of pollutants and waste requiring continuous monitoring.
- Critical for regulatory compliance in heavy industries.
- Essential for process optimization and resource management.
- Growth in Hospitality, Education, and Fitness Segments:
- Increasing emphasis on occupant health and well-being.
- Demand for sustainable and eco-friendly business practices.
- Brand differentiation through environmental performance.
- Synergistic Growth of Hardware and Software:
- Hardware provides the raw data; software transforms it into actionable intelligence.
- IoT integration enables seamless data flow between devices and platforms.
- Comprehensive solutions are increasingly preferred by end-users.
Environmental Monitoring Service Product Developments
Recent product developments in the Environmental Monitoring Service sector are characterized by enhanced precision, miniaturization, and integrated data analytics. Innovations include the introduction of multi-parameter sensors capable of simultaneously detecting air pollutants like PM2.5, VOCs, and CO2, alongside temperature and humidity. Companies are focusing on developing smart, connected devices that leverage IoT capabilities for real-time data transmission and remote monitoring. AI-powered software platforms are increasingly being integrated to provide predictive analytics for pollution events, optimize operational efficiency, and streamline compliance reporting. This trend is exemplified by the development of cloud-based solutions that offer scalable data storage and advanced visualization tools, making complex environmental data accessible and comprehensible to a wider audience. The market relevance of these developments lies in their ability to offer more cost-effective, efficient, and actionable environmental monitoring solutions.
Challenges in the Environmental Monitoring Service Market
The Environmental Monitoring Service market faces several significant challenges that impede its growth and adoption. Regulatory hurdles, including the complexity and ever-changing nature of environmental laws across different jurisdictions, create compliance burdens for businesses. Supply chain disruptions, particularly for specialized electronic components, can lead to delays in product development and deployment, impacting service availability. Intense competitive pressures from both established players and emerging disruptors can lead to price wars and reduced profit margins. Quantifiable impacts include an estimated 10-15% increase in operational costs due to compliance complexities and potential revenue losses of up to 5% due to supply chain delays.
Forces Driving Environmental Monitoring Service Growth
Several powerful forces are propelling the Environmental Monitoring Service market forward. Technologically, the rapid advancement of sensor technology, coupled with the widespread adoption of IoT and AI, is enabling more accurate, real-time, and predictive environmental monitoring. Economically, a growing global awareness of climate change and its impacts is driving investments in sustainable practices and compliance. Regulatory factors, such as increasingly stringent environmental protection laws and emission standards worldwide, mandate the adoption of comprehensive monitoring solutions. For example, the EU’s Green Deal initiatives are significantly boosting demand for environmental monitoring services across member states.
Challenges in the Environmental Monitoring Service Market
The long-term growth of the Environmental Monitoring Service market is underpinned by several key catalysts. Continued innovation in areas like nanotechnology for sensor development, advanced data analytics for predictive modeling, and the expansion of remote sensing technologies will unlock new applications and improve existing ones. Strategic partnerships between technology providers, service companies, and end-users are crucial for developing tailored solutions that address specific industry needs. Market expansions into developing economies, where environmental regulations are evolving and industrial growth is high, present significant untapped potential. Furthermore, the increasing consumer demand for transparency and verifiable sustainability claims will continue to drive the need for robust and reliable environmental monitoring.
Emerging Opportunities in Environmental Monitoring Service
Emerging opportunities in the Environmental Monitoring Service market are abundant and diverse. The burgeoning field of precision agriculture offers significant potential for soil and water quality monitoring, enhancing crop yields and reducing environmental impact. The development of affordable and user-friendly indoor air quality monitoring systems for residential use represents a substantial consumer market opportunity. Furthermore, the growing emphasis on circular economy principles is creating demand for services that monitor waste streams and resource recovery processes. Advancements in real-time, hyper-local pollution mapping powered by distributed sensor networks and big data analytics are opening doors for novel public health initiatives and urban planning strategies.
Leading Players in the Environmental Monitoring Service Sector
- Viroxy
- EMS Ireland
- Environmental Monitoring Systems
- Controlled Contamination Services (CCS)
- HEAVY.AI
- Yokogawa Electric
- JRC
- Thermo Fisher Scientific
- Technical Safety Services
- CMA Testing
- NUVIA
- Lata Envirotech Services
- Mabbett
- BART River Services
- Environmental Systems Research Institute (Esri)
- Teledyne Technologies
- Vaisala
- Eurofins Environment Testing
- Ramboll
- ACOEM Group
- Environmental Monitoring Solutions (EMS)
Key Milestones in Environmental Monitoring Service Industry
- 2019: Increased adoption of IoT-enabled real-time environmental data platforms.
- 2020: Growing demand for indoor air quality monitoring in response to global health concerns.
- 2021: Significant growth in AI and machine learning applications for predictive environmental analysis.
- 2022: Expansion of regulatory frameworks for industrial emissions and wastewater discharge.
- 2023: Launch of new, miniaturized, and multi-parameter environmental sensors.
- 2024: Increased M&A activity as companies consolidate market share and expand service offerings.
Strategic Outlook for Environmental Monitoring Service Market
The strategic outlook for the Environmental Monitoring Service market is exceptionally positive, characterized by sustained growth driven by increasing regulatory pressures, technological innovation, and a heightened global focus on sustainability. Key growth accelerators include the continued integration of AI and big data analytics for predictive insights, the expansion of IoT networks for ubiquitous monitoring, and the development of novel sensor technologies. Strategic opportunities lie in expanding service offerings into emerging markets, developing specialized solutions for niche applications like precision agriculture and the circular economy, and forging partnerships to create integrated end-to-end environmental management systems. The market is poised for continued innovation and value creation for stakeholders committed to environmental stewardship.
Environmental Monitoring Service Segmentation
-
1. Application
- 1.1. Hotels
- 1.2. Schools
- 1.3. Restaurants
- 1.4. Fitness Centres
- 1.5. Others
-
2. Type
- 2.1. Hardware
- 2.2. Software
Environmental Monitoring Service Segmentation By Geography
-
1. North America
- 1.1. United States
- 1.2. Canada
- 1.3. Mexico
-
2. South America
- 2.1. Brazil
- 2.2. Argentina
- 2.3. Rest of South America
-
3. Europe
- 3.1. United Kingdom
- 3.2. Germany
- 3.3. France
- 3.4. Italy
- 3.5. Spain
- 3.6. Russia
- 3.7. Benelux
- 3.8. Nordics
- 3.9. Rest of Europe
-
4. Middle East & Africa
- 4.1. Turkey
- 4.2. Israel
- 4.3. GCC
- 4.4. North Africa
- 4.5. South Africa
- 4.6. Rest of Middle East & Africa
-
5. Asia Pacific
- 5.1. China
- 5.2. India
- 5.3. Japan
- 5.4. South Korea
- 5.5. ASEAN
- 5.6. Oceania
- 5.7. Rest of Asia Pacific
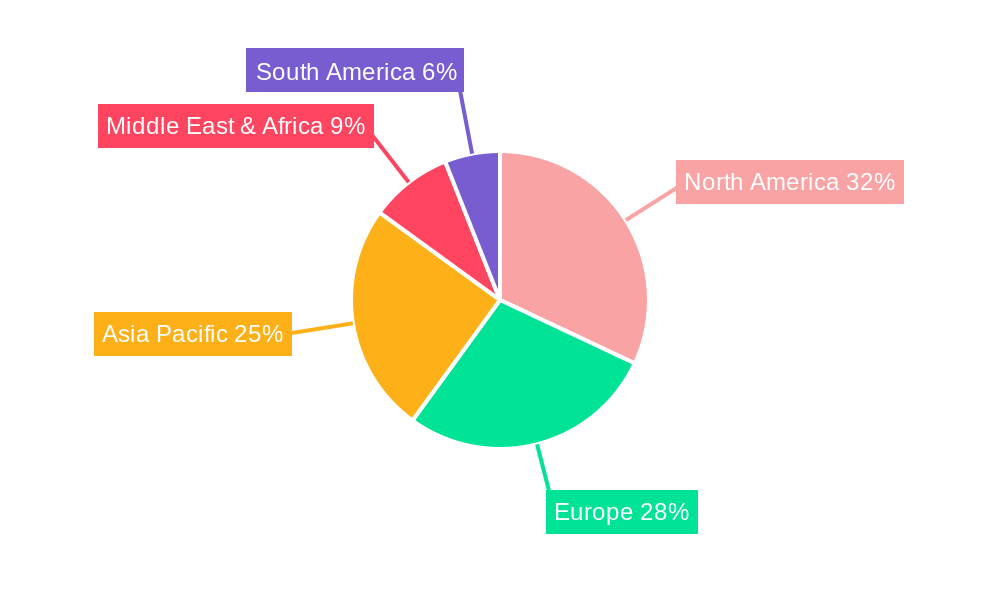
Environmental Monitoring Service Regional Market Share
Geographic Coverage of Environmental Monitoring Service
Environmental Monitoring Service REPORT HIGHLIGHTS
| Aspects | Details |
|---|---|
| Study Period | 2020-2034 |
| Base Year | 2025 |
| Estimated Year | 2026 |
| Forecast Period | 2026-2034 |
| Historical Period | 2020-2025 |
| Growth Rate | CAGR of 5.5% from 2020-2034 |
| Segmentation |
|
Table of Contents
- 1. Introduction
- 1.1. Research Scope
- 1.2. Market Segmentation
- 1.3. Research Objective
- 1.4. Definitions and Assumptions
- 2. Executive Summary
- 2.1. Market Snapshot
- 3. Market Dynamics
- 3.1. Market Drivers
- 3.2. Market Restrains
- 3.3. Market Trends
- 3.4. Market Opportunities
- 4. Market Factor Analysis
- 4.1. Porters Five Forces
- 4.1.1. Bargaining Power of Suppliers
- 4.1.2. Bargaining Power of Buyers
- 4.1.3. Threat of New Entrants
- 4.1.4. Threat of Substitutes
- 4.1.5. Competitive Rivalry
- 4.2. PESTEL analysis
- 4.3. BCG Analysis
- 4.3.1. Stars (High Growth, High Market Share)
- 4.3.2. Cash Cows (Low Growth, High Market Share)
- 4.3.3. Question Mark (High Growth, Low Market Share)
- 4.3.4. Dogs (Low Growth, Low Market Share)
- 4.4. Ansoff Matrix Analysis
- 4.5. Supply Chain Analysis
- 4.6. Regulatory Landscape
- 4.7. Current Market Potential and Opportunity Assessment (TAM–SAM–SOM Framework)
- 4.8. MSR Analyst Note
- 4.1. Porters Five Forces
- 5. Market Analysis, Insights and Forecast 2021-2033
- 5.1. Market Analysis, Insights and Forecast - by Application
- 5.1.1. Hotels
- 5.1.2. Schools
- 5.1.3. Restaurants
- 5.1.4. Fitness Centres
- 5.1.5. Others
- 5.2. Market Analysis, Insights and Forecast - by Type
- 5.2.1. Hardware
- 5.2.2. Software
- 5.3. Market Analysis, Insights and Forecast - by Region
- 5.3.1. North America
- 5.3.2. South America
- 5.3.3. Europe
- 5.3.4. Middle East & Africa
- 5.3.5. Asia Pacific
- 5.1. Market Analysis, Insights and Forecast - by Application
- 6. Global Environmental Monitoring Service Analysis, Insights and Forecast, 2021-2033
- 6.1. Market Analysis, Insights and Forecast - by Application
- 6.1.1. Hotels
- 6.1.2. Schools
- 6.1.3. Restaurants
- 6.1.4. Fitness Centres
- 6.1.5. Others
- 6.2. Market Analysis, Insights and Forecast - by Type
- 6.2.1. Hardware
- 6.2.2. Software
- 6.1. Market Analysis, Insights and Forecast - by Application
- 7. North America Environmental Monitoring Service Analysis, Insights and Forecast, 2020-2032
- 7.1. Market Analysis, Insights and Forecast - by Application
- 7.1.1. Hotels
- 7.1.2. Schools
- 7.1.3. Restaurants
- 7.1.4. Fitness Centres
- 7.1.5. Others
- 7.2. Market Analysis, Insights and Forecast - by Type
- 7.2.1. Hardware
- 7.2.2. Software
- 7.1. Market Analysis, Insights and Forecast - by Application
- 8. South America Environmental Monitoring Service Analysis, Insights and Forecast, 2020-2032
- 8.1. Market Analysis, Insights and Forecast - by Application
- 8.1.1. Hotels
- 8.1.2. Schools
- 8.1.3. Restaurants
- 8.1.4. Fitness Centres
- 8.1.5. Others
- 8.2. Market Analysis, Insights and Forecast - by Type
- 8.2.1. Hardware
- 8.2.2. Software
- 8.1. Market Analysis, Insights and Forecast - by Application
- 9. Europe Environmental Monitoring Service Analysis, Insights and Forecast, 2020-2032
- 9.1. Market Analysis, Insights and Forecast - by Application
- 9.1.1. Hotels
- 9.1.2. Schools
- 9.1.3. Restaurants
- 9.1.4. Fitness Centres
- 9.1.5. Others
- 9.2. Market Analysis, Insights and Forecast - by Type
- 9.2.1. Hardware
- 9.2.2. Software
- 9.1. Market Analysis, Insights and Forecast - by Application
- 10. Middle East & Africa Environmental Monitoring Service Analysis, Insights and Forecast, 2020-2032
- 10.1. Market Analysis, Insights and Forecast - by Application
- 10.1.1. Hotels
- 10.1.2. Schools
- 10.1.3. Restaurants
- 10.1.4. Fitness Centres
- 10.1.5. Others
- 10.2. Market Analysis, Insights and Forecast - by Type
- 10.2.1. Hardware
- 10.2.2. Software
- 10.1. Market Analysis, Insights and Forecast - by Application
- 11. Asia Pacific Environmental Monitoring Service Analysis, Insights and Forecast, 2020-2032
- 11.1. Market Analysis, Insights and Forecast - by Application
- 11.1.1. Hotels
- 11.1.2. Schools
- 11.1.3. Restaurants
- 11.1.4. Fitness Centres
- 11.1.5. Others
- 11.2. Market Analysis, Insights and Forecast - by Type
- 11.2.1. Hardware
- 11.2.2. Software
- 11.1. Market Analysis, Insights and Forecast - by Application
- 12. Competitive Analysis
- 12.1. Company Profiles
- 12.1.1 Viroxy
- 12.1.1.1. Company Overview
- 12.1.1.2. Products
- 12.1.1.3. Company Financials
- 12.1.1.4. SWOT Analysis
- 12.1.2 EMS Ireland
- 12.1.2.1. Company Overview
- 12.1.2.2. Products
- 12.1.2.3. Company Financials
- 12.1.2.4. SWOT Analysis
- 12.1.3 Environmental Monitoring Systems
- 12.1.3.1. Company Overview
- 12.1.3.2. Products
- 12.1.3.3. Company Financials
- 12.1.3.4. SWOT Analysis
- 12.1.4 Controlled Contamination Services(CCS)
- 12.1.4.1. Company Overview
- 12.1.4.2. Products
- 12.1.4.3. Company Financials
- 12.1.4.4. SWOT Analysis
- 12.1.5 HEAVY.AI
- 12.1.5.1. Company Overview
- 12.1.5.2. Products
- 12.1.5.3. Company Financials
- 12.1.5.4. SWOT Analysis
- 12.1.6 Yokogawa Electric
- 12.1.6.1. Company Overview
- 12.1.6.2. Products
- 12.1.6.3. Company Financials
- 12.1.6.4. SWOT Analysis
- 12.1.7 JRC
- 12.1.7.1. Company Overview
- 12.1.7.2. Products
- 12.1.7.3. Company Financials
- 12.1.7.4. SWOT Analysis
- 12.1.8 Thermo Fisher Scientific
- 12.1.8.1. Company Overview
- 12.1.8.2. Products
- 12.1.8.3. Company Financials
- 12.1.8.4. SWOT Analysis
- 12.1.9 Technical Safety Services
- 12.1.9.1. Company Overview
- 12.1.9.2. Products
- 12.1.9.3. Company Financials
- 12.1.9.4. SWOT Analysis
- 12.1.10 CMA Testing
- 12.1.10.1. Company Overview
- 12.1.10.2. Products
- 12.1.10.3. Company Financials
- 12.1.10.4. SWOT Analysis
- 12.1.11 NUVIA
- 12.1.11.1. Company Overview
- 12.1.11.2. Products
- 12.1.11.3. Company Financials
- 12.1.11.4. SWOT Analysis
- 12.1.12 Lata Envirotech Services
- 12.1.12.1. Company Overview
- 12.1.12.2. Products
- 12.1.12.3. Company Financials
- 12.1.12.4. SWOT Analysis
- 12.1.13 Mabbett
- 12.1.13.1. Company Overview
- 12.1.13.2. Products
- 12.1.13.3. Company Financials
- 12.1.13.4. SWOT Analysis
- 12.1.14 BART River Services
- 12.1.14.1. Company Overview
- 12.1.14.2. Products
- 12.1.14.3. Company Financials
- 12.1.14.4. SWOT Analysis
- 12.1.15 Environmental Systems Research Institute (Esri)
- 12.1.15.1. Company Overview
- 12.1.15.2. Products
- 12.1.15.3. Company Financials
- 12.1.15.4. SWOT Analysis
- 12.1.16 Teledyne Technologies
- 12.1.16.1. Company Overview
- 12.1.16.2. Products
- 12.1.16.3. Company Financials
- 12.1.16.4. SWOT Analysis
- 12.1.17 Vaisala
- 12.1.17.1. Company Overview
- 12.1.17.2. Products
- 12.1.17.3. Company Financials
- 12.1.17.4. SWOT Analysis
- 12.1.18 Eurofins Environment Testing
- 12.1.18.1. Company Overview
- 12.1.18.2. Products
- 12.1.18.3. Company Financials
- 12.1.18.4. SWOT Analysis
- 12.1.19 Ramboll
- 12.1.19.1. Company Overview
- 12.1.19.2. Products
- 12.1.19.3. Company Financials
- 12.1.19.4. SWOT Analysis
- 12.1.20 ACOEM Group
- 12.1.20.1. Company Overview
- 12.1.20.2. Products
- 12.1.20.3. Company Financials
- 12.1.20.4. SWOT Analysis
- 12.1.21 Environmental Monitoring Solutions (EMS)
- 12.1.21.1. Company Overview
- 12.1.21.2. Products
- 12.1.21.3. Company Financials
- 12.1.21.4. SWOT Analysis
- 12.1.1 Viroxy
- 12.2. Market Entropy
- 12.2.1 Company's Key Areas Served
- 12.2.2 Recent Developments
- 12.3. Company Market Share Analysis 2025
- 12.3.1 Top 5 Companies Market Share Analysis
- 12.3.2 Top 3 Companies Market Share Analysis
- 12.4. List of Potential Customers
- 13. Research Methodology
List of Figures
- Figure 1: Global Environmental Monitoring Service Revenue Breakdown (undefined, %) by Region 2025 & 2033
- Figure 2: North America Environmental Monitoring Service Revenue (undefined), by Application 2025 & 2033
- Figure 3: North America Environmental Monitoring Service Revenue Share (%), by Application 2025 & 2033
- Figure 4: North America Environmental Monitoring Service Revenue (undefined), by Type 2025 & 2033
- Figure 5: North America Environmental Monitoring Service Revenue Share (%), by Type 2025 & 2033
- Figure 6: North America Environmental Monitoring Service Revenue (undefined), by Country 2025 & 2033
- Figure 7: North America Environmental Monitoring Service Revenue Share (%), by Country 2025 & 2033
- Figure 8: South America Environmental Monitoring Service Revenue (undefined), by Application 2025 & 2033
- Figure 9: South America Environmental Monitoring Service Revenue Share (%), by Application 2025 & 2033
- Figure 10: South America Environmental Monitoring Service Revenue (undefined), by Type 2025 & 2033
- Figure 11: South America Environmental Monitoring Service Revenue Share (%), by Type 2025 & 2033
- Figure 12: South America Environmental Monitoring Service Revenue (undefined), by Country 2025 & 2033
- Figure 13: South America Environmental Monitoring Service Revenue Share (%), by Country 2025 & 2033
- Figure 14: Europe Environmental Monitoring Service Revenue (undefined), by Application 2025 & 2033
- Figure 15: Europe Environmental Monitoring Service Revenue Share (%), by Application 2025 & 2033
- Figure 16: Europe Environmental Monitoring Service Revenue (undefined), by Type 2025 & 2033
- Figure 17: Europe Environmental Monitoring Service Revenue Share (%), by Type 2025 & 2033
- Figure 18: Europe Environmental Monitoring Service Revenue (undefined), by Country 2025 & 2033
- Figure 19: Europe Environmental Monitoring Service Revenue Share (%), by Country 2025 & 2033
- Figure 20: Middle East & Africa Environmental Monitoring Service Revenue (undefined), by Application 2025 & 2033
- Figure 21: Middle East & Africa Environmental Monitoring Service Revenue Share (%), by Application 2025 & 2033
- Figure 22: Middle East & Africa Environmental Monitoring Service Revenue (undefined), by Type 2025 & 2033
- Figure 23: Middle East & Africa Environmental Monitoring Service Revenue Share (%), by Type 2025 & 2033
- Figure 24: Middle East & Africa Environmental Monitoring Service Revenue (undefined), by Country 2025 & 2033
- Figure 25: Middle East & Africa Environmental Monitoring Service Revenue Share (%), by Country 2025 & 2033
- Figure 26: Asia Pacific Environmental Monitoring Service Revenue (undefined), by Application 2025 & 2033
- Figure 27: Asia Pacific Environmental Monitoring Service Revenue Share (%), by Application 2025 & 2033
- Figure 28: Asia Pacific Environmental Monitoring Service Revenue (undefined), by Type 2025 & 2033
- Figure 29: Asia Pacific Environmental Monitoring Service Revenue Share (%), by Type 2025 & 2033
- Figure 30: Asia Pacific Environmental Monitoring Service Revenue (undefined), by Country 2025 & 2033
- Figure 31: Asia Pacific Environmental Monitoring Service Revenue Share (%), by Country 2025 & 2033
List of Tables
- Table 1: Global Environmental Monitoring Service Revenue undefined Forecast, by Application 2020 & 2033
- Table 2: Global Environmental Monitoring Service Revenue undefined Forecast, by Type 2020 & 2033
- Table 3: Global Environmental Monitoring Service Revenue undefined Forecast, by Region 2020 & 2033
- Table 4: Global Environmental Monitoring Service Revenue undefined Forecast, by Application 2020 & 2033
- Table 5: Global Environmental Monitoring Service Revenue undefined Forecast, by Type 2020 & 2033
- Table 6: Global Environmental Monitoring Service Revenue undefined Forecast, by Country 2020 & 2033
- Table 7: United States Environmental Monitoring Service Revenue (undefined) Forecast, by Application 2020 & 2033
- Table 8: Canada Environmental Monitoring Service Revenue (undefined) Forecast, by Application 2020 & 2033
- Table 9: Mexico Environmental Monitoring Service Revenue (undefined) Forecast, by Application 2020 & 2033
- Table 10: Global Environmental Monitoring Service Revenue undefined Forecast, by Application 2020 & 2033
- Table 11: Global Environmental Monitoring Service Revenue undefined Forecast, by Type 2020 & 2033
- Table 12: Global Environmental Monitoring Service Revenue undefined Forecast, by Country 2020 & 2033
- Table 13: Brazil Environmental Monitoring Service Revenue (undefined) Forecast, by Application 2020 & 2033
- Table 14: Argentina Environmental Monitoring Service Revenue (undefined) Forecast, by Application 2020 & 2033
- Table 15: Rest of South America Environmental Monitoring Service Revenue (undefined) Forecast, by Application 2020 & 2033
- Table 16: Global Environmental Monitoring Service Revenue undefined Forecast, by Application 2020 & 2033
- Table 17: Global Environmental Monitoring Service Revenue undefined Forecast, by Type 2020 & 2033
- Table 18: Global Environmental Monitoring Service Revenue undefined Forecast, by Country 2020 & 2033
- Table 19: United Kingdom Environmental Monitoring Service Revenue (undefined) Forecast, by Application 2020 & 2033
- Table 20: Germany Environmental Monitoring Service Revenue (undefined) Forecast, by Application 2020 & 2033
- Table 21: France Environmental Monitoring Service Revenue (undefined) Forecast, by Application 2020 & 2033
- Table 22: Italy Environmental Monitoring Service Revenue (undefined) Forecast, by Application 2020 & 2033
- Table 23: Spain Environmental Monitoring Service Revenue (undefined) Forecast, by Application 2020 & 2033
- Table 24: Russia Environmental Monitoring Service Revenue (undefined) Forecast, by Application 2020 & 2033
- Table 25: Benelux Environmental Monitoring Service Revenue (undefined) Forecast, by Application 2020 & 2033
- Table 26: Nordics Environmental Monitoring Service Revenue (undefined) Forecast, by Application 2020 & 2033
- Table 27: Rest of Europe Environmental Monitoring Service Revenue (undefined) Forecast, by Application 2020 & 2033
- Table 28: Global Environmental Monitoring Service Revenue undefined Forecast, by Application 2020 & 2033
- Table 29: Global Environmental Monitoring Service Revenue undefined Forecast, by Type 2020 & 2033
- Table 30: Global Environmental Monitoring Service Revenue undefined Forecast, by Country 2020 & 2033
- Table 31: Turkey Environmental Monitoring Service Revenue (undefined) Forecast, by Application 2020 & 2033
- Table 32: Israel Environmental Monitoring Service Revenue (undefined) Forecast, by Application 2020 & 2033
- Table 33: GCC Environmental Monitoring Service Revenue (undefined) Forecast, by Application 2020 & 2033
- Table 34: North Africa Environmental Monitoring Service Revenue (undefined) Forecast, by Application 2020 & 2033
- Table 35: South Africa Environmental Monitoring Service Revenue (undefined) Forecast, by Application 2020 & 2033
- Table 36: Rest of Middle East & Africa Environmental Monitoring Service Revenue (undefined) Forecast, by Application 2020 & 2033
- Table 37: Global Environmental Monitoring Service Revenue undefined Forecast, by Application 2020 & 2033
- Table 38: Global Environmental Monitoring Service Revenue undefined Forecast, by Type 2020 & 2033
- Table 39: Global Environmental Monitoring Service Revenue undefined Forecast, by Country 2020 & 2033
- Table 40: China Environmental Monitoring Service Revenue (undefined) Forecast, by Application 2020 & 2033
- Table 41: India Environmental Monitoring Service Revenue (undefined) Forecast, by Application 2020 & 2033
- Table 42: Japan Environmental Monitoring Service Revenue (undefined) Forecast, by Application 2020 & 2033
- Table 43: South Korea Environmental Monitoring Service Revenue (undefined) Forecast, by Application 2020 & 2033
- Table 44: ASEAN Environmental Monitoring Service Revenue (undefined) Forecast, by Application 2020 & 2033
- Table 45: Oceania Environmental Monitoring Service Revenue (undefined) Forecast, by Application 2020 & 2033
- Table 46: Rest of Asia Pacific Environmental Monitoring Service Revenue (undefined) Forecast, by Application 2020 & 2033
Frequently Asked Questions
1. What is the projected Compound Annual Growth Rate (CAGR) of the Environmental Monitoring Service?
The projected CAGR is approximately 5.5%.
2. Which companies are prominent players in the Environmental Monitoring Service?
Key companies in the market include Viroxy, EMS Ireland, Environmental Monitoring Systems, Controlled Contamination Services(CCS), HEAVY.AI, Yokogawa Electric, JRC, Thermo Fisher Scientific, Technical Safety Services, CMA Testing, NUVIA, Lata Envirotech Services, Mabbett, BART River Services, Environmental Systems Research Institute (Esri), Teledyne Technologies, Vaisala, Eurofins Environment Testing, Ramboll, ACOEM Group, Environmental Monitoring Solutions (EMS).
3. What are the main segments of the Environmental Monitoring Service?
The market segments include Application, Type.
4. Can you provide details about the market size?
The market size is estimated to be USD XXX N/A as of 2022.
5. What are some drivers contributing to market growth?
N/A
6. What are the notable trends driving market growth?
N/A
7. Are there any restraints impacting market growth?
N/A
8. Can you provide examples of recent developments in the market?
N/A
9. What pricing options are available for accessing the report?
Pricing options include single-user, multi-user, and enterprise licenses priced at USD 3950.00, USD 5925.00, and USD 7900.00 respectively.
10. Is the market size provided in terms of value or volume?
The market size is provided in terms of value, measured in N/A.
11. Are there any specific market keywords associated with the report?
Yes, the market keyword associated with the report is "Environmental Monitoring Service," which aids in identifying and referencing the specific market segment covered.
12. How do I determine which pricing option suits my needs best?
The pricing options vary based on user requirements and access needs. Individual users may opt for single-user licenses, while businesses requiring broader access may choose multi-user or enterprise licenses for cost-effective access to the report.
13. Are there any additional resources or data provided in the Environmental Monitoring Service report?
While the report offers comprehensive insights, it's advisable to review the specific contents or supplementary materials provided to ascertain if additional resources or data are available.
14. How can I stay updated on further developments or reports in the Environmental Monitoring Service?
To stay informed about further developments, trends, and reports in the Environmental Monitoring Service, consider subscribing to industry newsletters, following relevant companies and organizations, or regularly checking reputable industry news sources and publications.
Methodology
Step 1 - Identification of Relevant Samples Size from Population Database


Step 2 - Approaches for Defining Global Market Size (Value, Volume* & Price*)

Note*: In applicable scenarios
Step 3 - Data Sources
Primary Research
- Web Analytics
- Survey Reports
- Research Institute
- Latest Research Reports
- Opinion Leaders
Secondary Research
- Annual Reports
- White Paper
- Latest Press Release
- Industry Association
- Paid Database
- Investor Presentations

Step 4 - Data Triangulation
Involves using different sources of information in order to increase the validity of a study
These sources are likely to be stakeholders in a program - participants, other researchers, program staff, other community members, and so on.
Then we put all data in single framework & apply various statistical tools to find out the dynamic on the market.
During the analysis stage, feedback from the stakeholder groups would be compared to determine areas of agreement as well as areas of divergence