

Key Insights
The global Electric Vehicle (EV) Taxi market is poised for significant expansion, driven by heightened environmental awareness, stricter emission mandates, and decreasing battery expenses. The market, projected to reach a size of 29.54 billion by 2025, is anticipated to grow at a robust Compound Annual Growth Rate (CAGR) of 25.56% from 2025 to 2033. Key growth catalysts include government incentives for EV adoption, escalating fuel costs, and the expanding availability of charging infrastructure. Technological progress in battery longevity, charging speed, and vehicle performance further bolsters market growth. The four-wheeler taxi segment is expected to lead market share due to its superior passenger capacity and suitability for extended journeys. Conversely, the two-wheeler taxi segment presents substantial growth opportunities in urban centers, offering cost-effectiveness and agility. Leading operators such as Ola Cabs and Uber are actively investing in EV taxi fleets, accelerating market adoption.
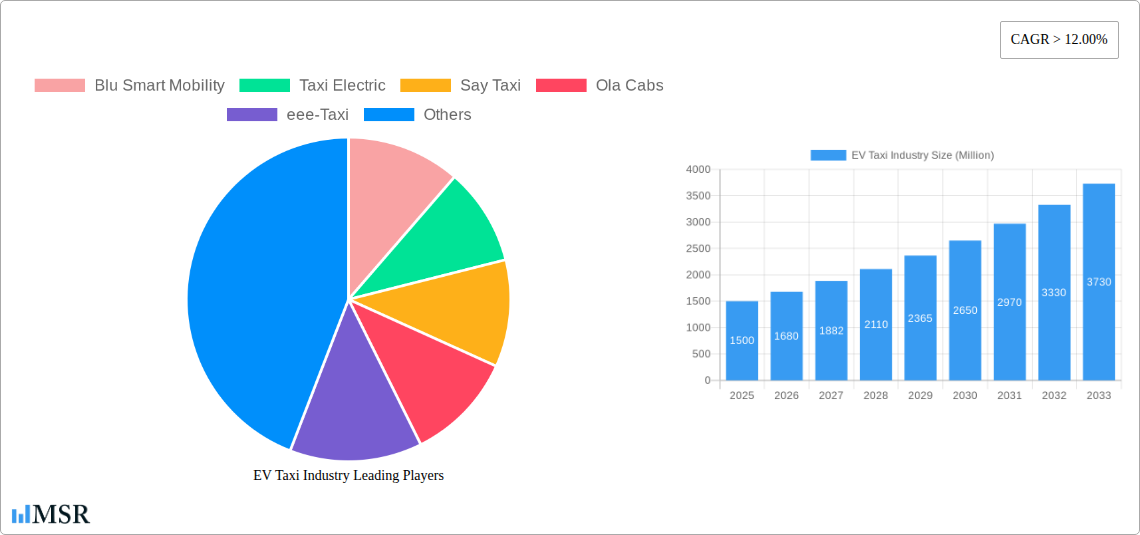
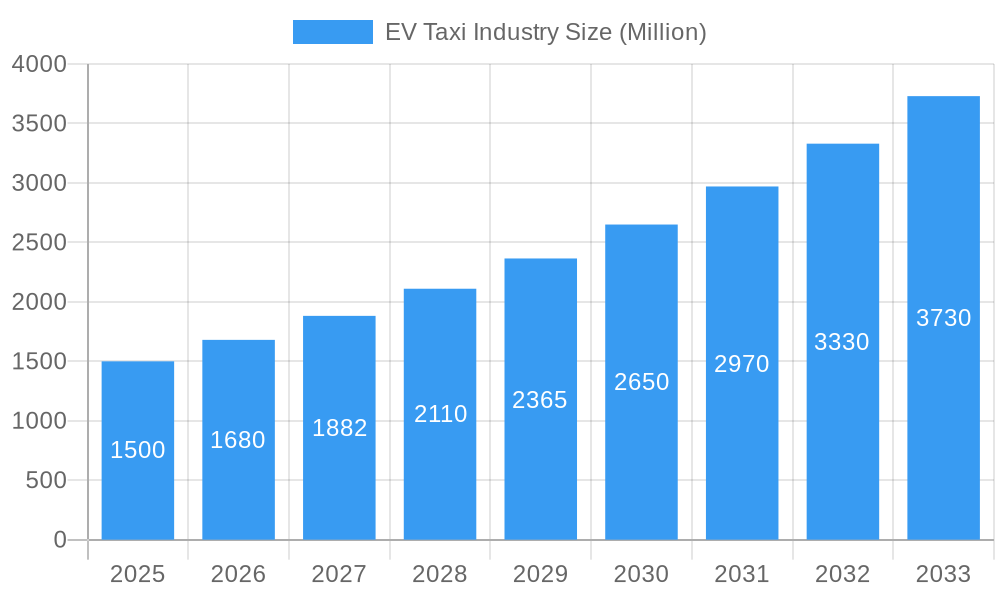
EV Taxi Industry Market Size (In Billion)
Market challenges include the higher upfront cost of EVs versus internal combustion engine vehicles, concerns regarding range anxiety, and inconsistent charging station distribution. Nevertheless, the long-term market trajectory remains optimistic. Ongoing advancements in battery technology, coupled with supportive governmental policies and the development of comprehensive charging networks, are expected to mitigate these constraints. Geographic expansion will be varied, with mature markets in North America and Europe exhibiting steady growth, while rapidly developing economies in Asia, particularly India and China, will witness accelerated expansion fueled by increasing urbanization and a growing middle class. The competitive environment is dynamic, with incumbent players facing pressure from emerging entrants focused on innovative business models and cutting-edge technology. Success hinges on efficient fleet management, strategic alliances with charging infrastructure providers, and targeted marketing campaigns appealing to eco-conscious consumers.
EV Taxi Industry Company Market Share
Revolutionizing Rides: A Comprehensive Report on the EV Taxi Industry (2019-2033)
This in-depth report provides a comprehensive analysis of the burgeoning Electric Vehicle (EV) Taxi industry, projecting a market valuation exceeding $XX Million by 2033. We delve into market dynamics, growth drivers, technological advancements, and key players shaping this transformative sector. The report covers the period 2019-2033, with a base year of 2025 and a forecast period spanning 2025-2033. Targeted towards investors, industry stakeholders, and policymakers, this report offers actionable insights and strategic recommendations for navigating this rapidly evolving landscape.
EV Taxi Industry Market Concentration & Dynamics
The EV taxi market exhibits a dynamic interplay of established players and emerging disruptors. Market concentration is currently moderate, with key players like Ola Cabs, Uber, and Blu Smart Mobility holding significant shares, estimated at xx%, xx%, and xx%, respectively, in 2025. However, the entry of numerous startups and the rapid technological advancements are likely to reshape this landscape in the coming years.
The innovation ecosystem is vibrant, characterized by continuous improvements in battery technology, charging infrastructure, and vehicle design. Regulatory frameworks, while evolving, are increasingly supportive of EV adoption, incentivizing the transition through subsidies and emission regulations. Substitute products, such as traditional combustion engine taxis, face growing competitive pressure due to the cost advantages and environmental benefits offered by EVs. End-user trends demonstrate a clear preference for cleaner, more sustainable transportation options, further bolstering EV taxi adoption. M&A activity has been moderate in recent years, with approximately xx deals recorded between 2019 and 2024. This activity is expected to increase as larger players consolidate their market positions and smaller players seek strategic partnerships.
EV Taxi Industry Industry Insights & Trends
The global EV taxi market is experiencing exponential growth, driven by a confluence of factors. The market size in 2025 is estimated at $XX Million, exhibiting a Compound Annual Growth Rate (CAGR) of xx% from 2025 to 2033. This remarkable growth is fueled by several key trends: increasing environmental concerns, government regulations promoting cleaner transportation, technological advancements leading to lower EV costs and improved battery performance, and rising consumer demand for convenient and eco-friendly mobility solutions. Technological disruptions, particularly in battery technology and autonomous driving systems, are poised to further accelerate market growth. Evolving consumer behaviors, such as a preference for ride-hailing services and increasing awareness of sustainability, significantly contribute to the burgeoning market.
Key Markets & Segments Leading EV Taxi Industry
The Asia-Pacific region is currently the dominant market for EV taxis, driven by strong economic growth, expanding urban populations, and supportive government policies. Within this region, India and China are leading the charge.
- Drivers of Growth in Asia-Pacific:
- Rapid urbanization and increasing population density.
- Government incentives and subsidies for EV adoption.
- Growing middle class with increased disposable income.
- Development of charging infrastructure.
The four-wheeler taxi segment currently holds the largest market share, with a predicted xx% in 2025, followed by the two-wheeler segment. The battery electric vehicle (BEV) type is projected to dominate the market over the forecast period, surpassing hybrid electric vehicles (HEV) due to advancements in battery technology and decreasing costs. While HEVs offer a transitional solution, BEVs are expected to become the preferred choice for environmental and performance reasons.
EV Taxi Industry Product Developments
Significant strides are being made in EV taxi technology, including advancements in battery technology leading to increased range and faster charging times, improved vehicle designs for enhanced passenger comfort and safety, and integration of smart features and connected technology. These innovations provide significant competitive edges, enhancing operational efficiency and improving the overall passenger experience.
Challenges in the EV Taxi Industry Market
The EV taxi industry faces several challenges, including high initial investment costs for vehicles and charging infrastructure, limited charging infrastructure availability in certain regions, and the fluctuating prices of raw materials for battery production impacting profitability. Additionally, regulatory uncertainties and inconsistent government policies across different regions can create operational hurdles. Intense competition from existing players and the emergence of new entrants adds further pressure. These challenges, estimated to impact the market by approximately xx% in 2025, need to be addressed for sustainable growth.
Forces Driving EV Taxi Industry Growth
Several factors are driving the expansion of the EV taxi industry. Technological advancements, such as improved battery technology and autonomous driving capabilities, are making EVs more affordable and efficient. Favorable government policies, including tax incentives and subsidies, are encouraging widespread adoption. Furthermore, growing environmental concerns and the increasing popularity of ride-hailing services are creating a significant demand for sustainable transportation options.
Long-Term Growth Catalysts in the EV Taxi Industry
Continued innovation in battery technology, strategic partnerships between EV manufacturers, charging infrastructure providers, and ride-hailing platforms, and expansion into new and emerging markets will be crucial for long-term growth. The integration of advanced technologies like artificial intelligence and the Internet of Things (IoT) presents further opportunities for efficiency improvements and cost reductions.
Emerging Opportunities in EV Taxi Industry
Significant opportunities exist in expanding into underserved markets, developing innovative business models such as subscription-based services and exploring new technologies like autonomous driving and vehicle-to-grid (V2G) integration. Understanding and adapting to changing consumer preferences, particularly the demand for personalized and enhanced passenger experiences, will be key to unlocking further growth potential.
Leading Players in the EV Taxi Industry Sector
- Blu Smart Mobility
- Taxi Electric
- Say Taxi
- Ola Cabs
- eee-Taxi
- Connexxion
- Uber
- Prakrit
Key Milestones in EV Taxi Industry Industry
- 2020: Ola Electric launches its first electric scooter, signaling a shift towards two-wheeler EV taxis.
- 2021: Several governments announce significant investments in charging infrastructure.
- 2022: Blu Smart Mobility secures substantial funding for expansion.
- 2023: Uber expands its EV taxi fleet in major metropolitan areas.
- 2024: Significant advancements in battery technology are announced, leading to increased range and reduced charging times.
Strategic Outlook for EV Taxi Industry Market
The EV taxi industry is poised for significant growth in the coming decade, driven by technological advancements, supportive government policies, and evolving consumer preferences. Strategic partnerships and investments in research and development will be key to capturing a share of this expanding market. Focusing on sustainable business models, optimized operational efficiency, and enhanced customer experience will be crucial for success in this competitive landscape. The market shows immense potential, with opportunities for substantial returns for early investors and industry leaders.
EV Taxi Industry Segmentation
-
1. Type
- 1.1. Hybrid Electric Vehicle
- 1.2. Battery Electric Vehicle
-
2. Vehicle Type
- 2.1. Two Wheeler Taxi
- 2.2. Four Wheeler Taxi
EV Taxi Industry Segmentation By Geography
- 1. United States
- 2. Canada
- 3. Rest of North America
- 4. Germany
- 5. United Kingdom
- 6. France
- 7. Italy
- 8. Rest of Europe
- 9. China
- 10. India
- 11. Japan
- 12. South Korea
- 13. Rest of Asia Pacific
- 14. Mexico
- 15. Brazil
- 16. United Arab Emirates
- 17. Other Countries
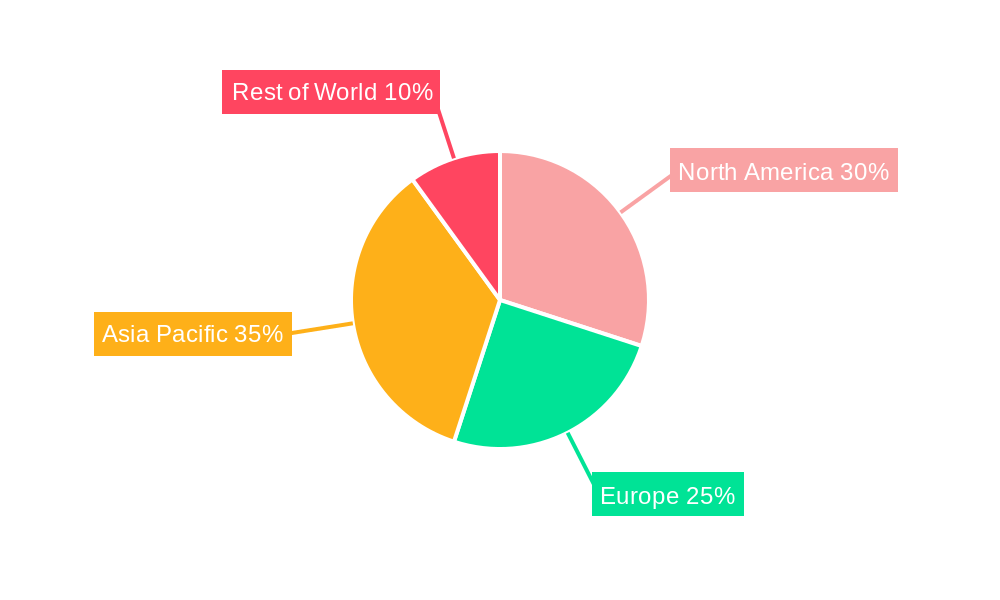
EV Taxi Industry Regional Market Share
Geographic Coverage of EV Taxi Industry
EV Taxi Industry REPORT HIGHLIGHTS
| Aspects | Details |
|---|---|
| Study Period | 2020-2034 |
| Base Year | 2025 |
| Estimated Year | 2026 |
| Forecast Period | 2026-2034 |
| Historical Period | 2020-2025 |
| Growth Rate | CAGR of 25.56% from 2020-2034 |
| Segmentation |
|
Table of Contents
- 1. Introduction
- 1.1. Research Scope
- 1.2. Market Segmentation
- 1.3. Research Objective
- 1.4. Definitions and Assumptions
- 2. Executive Summary
- 2.1. Market Snapshot
- 3. Market Dynamics
- 3.1. Market Drivers
- 3.2. Market Restrains
- 3.3. Market Trends
- 3.4. Market Opportunities
- 4. Market Factor Analysis
- 4.1. Porters Five Forces
- 4.1.1. Bargaining Power of Suppliers
- 4.1.2. Bargaining Power of Buyers
- 4.1.3. Threat of New Entrants
- 4.1.4. Threat of Substitutes
- 4.1.5. Competitive Rivalry
- 4.2. PESTEL analysis
- 4.3. BCG Analysis
- 4.3.1. Stars (High Growth, High Market Share)
- 4.3.2. Cash Cows (Low Growth, High Market Share)
- 4.3.3. Question Mark (High Growth, Low Market Share)
- 4.3.4. Dogs (Low Growth, Low Market Share)
- 4.4. Ansoff Matrix Analysis
- 4.5. Supply Chain Analysis
- 4.6. Regulatory Landscape
- 4.7. Current Market Potential and Opportunity Assessment (TAM–SAM–SOM Framework)
- 4.8. MSR Analyst Note
- 4.1. Porters Five Forces
- 5. Market Analysis, Insights and Forecast 2021-2033
- 5.1. Market Analysis, Insights and Forecast - by Type
- 5.1.1. Hybrid Electric Vehicle
- 5.1.2. Battery Electric Vehicle
- 5.2. Market Analysis, Insights and Forecast - by Vehicle Type
- 5.2.1. Two Wheeler Taxi
- 5.2.2. Four Wheeler Taxi
- 5.3. Market Analysis, Insights and Forecast - by Region
- 5.3.1. United States
- 5.3.2. Canada
- 5.3.3. Rest of North America
- 5.3.4. Germany
- 5.3.5. United Kingdom
- 5.3.6. France
- 5.3.7. Italy
- 5.3.8. Rest of Europe
- 5.3.9. China
- 5.3.10. India
- 5.3.11. Japan
- 5.3.12. South Korea
- 5.3.13. Rest of Asia Pacific
- 5.3.14. Mexico
- 5.3.15. Brazil
- 5.3.16. United Arab Emirates
- 5.3.17. Other Countries
- 5.1. Market Analysis, Insights and Forecast - by Type
- 6. Global EV Taxi Industry Analysis, Insights and Forecast, 2021-2033
- 6.1. Market Analysis, Insights and Forecast - by Type
- 6.1.1. Hybrid Electric Vehicle
- 6.1.2. Battery Electric Vehicle
- 6.2. Market Analysis, Insights and Forecast - by Vehicle Type
- 6.2.1. Two Wheeler Taxi
- 6.2.2. Four Wheeler Taxi
- 6.1. Market Analysis, Insights and Forecast - by Type
- 7. United States EV Taxi Industry Analysis, Insights and Forecast, 2020-2032
- 7.1. Market Analysis, Insights and Forecast - by Type
- 7.1.1. Hybrid Electric Vehicle
- 7.1.2. Battery Electric Vehicle
- 7.2. Market Analysis, Insights and Forecast - by Vehicle Type
- 7.2.1. Two Wheeler Taxi
- 7.2.2. Four Wheeler Taxi
- 7.1. Market Analysis, Insights and Forecast - by Type
- 8. Canada EV Taxi Industry Analysis, Insights and Forecast, 2020-2032
- 8.1. Market Analysis, Insights and Forecast - by Type
- 8.1.1. Hybrid Electric Vehicle
- 8.1.2. Battery Electric Vehicle
- 8.2. Market Analysis, Insights and Forecast - by Vehicle Type
- 8.2.1. Two Wheeler Taxi
- 8.2.2. Four Wheeler Taxi
- 8.1. Market Analysis, Insights and Forecast - by Type
- 9. Rest of North America EV Taxi Industry Analysis, Insights and Forecast, 2020-2032
- 9.1. Market Analysis, Insights and Forecast - by Type
- 9.1.1. Hybrid Electric Vehicle
- 9.1.2. Battery Electric Vehicle
- 9.2. Market Analysis, Insights and Forecast - by Vehicle Type
- 9.2.1. Two Wheeler Taxi
- 9.2.2. Four Wheeler Taxi
- 9.1. Market Analysis, Insights and Forecast - by Type
- 10. Germany EV Taxi Industry Analysis, Insights and Forecast, 2020-2032
- 10.1. Market Analysis, Insights and Forecast - by Type
- 10.1.1. Hybrid Electric Vehicle
- 10.1.2. Battery Electric Vehicle
- 10.2. Market Analysis, Insights and Forecast - by Vehicle Type
- 10.2.1. Two Wheeler Taxi
- 10.2.2. Four Wheeler Taxi
- 10.1. Market Analysis, Insights and Forecast - by Type
- 11. United Kingdom EV Taxi Industry Analysis, Insights and Forecast, 2020-2032
- 11.1. Market Analysis, Insights and Forecast - by Type
- 11.1.1. Hybrid Electric Vehicle
- 11.1.2. Battery Electric Vehicle
- 11.2. Market Analysis, Insights and Forecast - by Vehicle Type
- 11.2.1. Two Wheeler Taxi
- 11.2.2. Four Wheeler Taxi
- 11.1. Market Analysis, Insights and Forecast - by Type
- 12. France EV Taxi Industry Analysis, Insights and Forecast, 2020-2032
- 12.1. Market Analysis, Insights and Forecast - by Type
- 12.1.1. Hybrid Electric Vehicle
- 12.1.2. Battery Electric Vehicle
- 12.2. Market Analysis, Insights and Forecast - by Vehicle Type
- 12.2.1. Two Wheeler Taxi
- 12.2.2. Four Wheeler Taxi
- 12.1. Market Analysis, Insights and Forecast - by Type
- 13. Italy EV Taxi Industry Analysis, Insights and Forecast, 2020-2032
- 13.1. Market Analysis, Insights and Forecast - by Type
- 13.1.1. Hybrid Electric Vehicle
- 13.1.2. Battery Electric Vehicle
- 13.2. Market Analysis, Insights and Forecast - by Vehicle Type
- 13.2.1. Two Wheeler Taxi
- 13.2.2. Four Wheeler Taxi
- 13.1. Market Analysis, Insights and Forecast - by Type
- 14. Rest of Europe EV Taxi Industry Analysis, Insights and Forecast, 2020-2032
- 14.1. Market Analysis, Insights and Forecast - by Type
- 14.1.1. Hybrid Electric Vehicle
- 14.1.2. Battery Electric Vehicle
- 14.2. Market Analysis, Insights and Forecast - by Vehicle Type
- 14.2.1. Two Wheeler Taxi
- 14.2.2. Four Wheeler Taxi
- 14.1. Market Analysis, Insights and Forecast - by Type
- 15. China EV Taxi Industry Analysis, Insights and Forecast, 2020-2032
- 15.1. Market Analysis, Insights and Forecast - by Type
- 15.1.1. Hybrid Electric Vehicle
- 15.1.2. Battery Electric Vehicle
- 15.2. Market Analysis, Insights and Forecast - by Vehicle Type
- 15.2.1. Two Wheeler Taxi
- 15.2.2. Four Wheeler Taxi
- 15.1. Market Analysis, Insights and Forecast - by Type
- 16. India EV Taxi Industry Analysis, Insights and Forecast, 2020-2032
- 16.1. Market Analysis, Insights and Forecast - by Type
- 16.1.1. Hybrid Electric Vehicle
- 16.1.2. Battery Electric Vehicle
- 16.2. Market Analysis, Insights and Forecast - by Vehicle Type
- 16.2.1. Two Wheeler Taxi
- 16.2.2. Four Wheeler Taxi
- 16.1. Market Analysis, Insights and Forecast - by Type
- 17. Japan EV Taxi Industry Analysis, Insights and Forecast, 2020-2032
- 17.1. Market Analysis, Insights and Forecast - by Type
- 17.1.1. Hybrid Electric Vehicle
- 17.1.2. Battery Electric Vehicle
- 17.2. Market Analysis, Insights and Forecast - by Vehicle Type
- 17.2.1. Two Wheeler Taxi
- 17.2.2. Four Wheeler Taxi
- 17.1. Market Analysis, Insights and Forecast - by Type
- 18. South Korea EV Taxi Industry Analysis, Insights and Forecast, 2020-2032
- 18.1. Market Analysis, Insights and Forecast - by Type
- 18.1.1. Hybrid Electric Vehicle
- 18.1.2. Battery Electric Vehicle
- 18.2. Market Analysis, Insights and Forecast - by Vehicle Type
- 18.2.1. Two Wheeler Taxi
- 18.2.2. Four Wheeler Taxi
- 18.1. Market Analysis, Insights and Forecast - by Type
- 19. Rest of Asia Pacific EV Taxi Industry Analysis, Insights and Forecast, 2020-2032
- 19.1. Market Analysis, Insights and Forecast - by Type
- 19.1.1. Hybrid Electric Vehicle
- 19.1.2. Battery Electric Vehicle
- 19.2. Market Analysis, Insights and Forecast - by Vehicle Type
- 19.2.1. Two Wheeler Taxi
- 19.2.2. Four Wheeler Taxi
- 19.1. Market Analysis, Insights and Forecast - by Type
- 20. Mexico EV Taxi Industry Analysis, Insights and Forecast, 2020-2032
- 20.1. Market Analysis, Insights and Forecast - by Type
- 20.1.1. Hybrid Electric Vehicle
- 20.1.2. Battery Electric Vehicle
- 20.2. Market Analysis, Insights and Forecast - by Vehicle Type
- 20.2.1. Two Wheeler Taxi
- 20.2.2. Four Wheeler Taxi
- 20.1. Market Analysis, Insights and Forecast - by Type
- 21. Brazil EV Taxi Industry Analysis, Insights and Forecast, 2020-2032
- 21.1. Market Analysis, Insights and Forecast - by Type
- 21.1.1. Hybrid Electric Vehicle
- 21.1.2. Battery Electric Vehicle
- 21.2. Market Analysis, Insights and Forecast - by Vehicle Type
- 21.2.1. Two Wheeler Taxi
- 21.2.2. Four Wheeler Taxi
- 21.1. Market Analysis, Insights and Forecast - by Type
- 22. United Arab Emirates EV Taxi Industry Analysis, Insights and Forecast, 2020-2032
- 22.1. Market Analysis, Insights and Forecast - by Type
- 22.1.1. Hybrid Electric Vehicle
- 22.1.2. Battery Electric Vehicle
- 22.2. Market Analysis, Insights and Forecast - by Vehicle Type
- 22.2.1. Two Wheeler Taxi
- 22.2.2. Four Wheeler Taxi
- 22.1. Market Analysis, Insights and Forecast - by Type
- 23. Other Countries EV Taxi Industry Analysis, Insights and Forecast, 2020-2032
- 23.1. Market Analysis, Insights and Forecast - by Type
- 23.1.1. Hybrid Electric Vehicle
- 23.1.2. Battery Electric Vehicle
- 23.2. Market Analysis, Insights and Forecast - by Vehicle Type
- 23.2.1. Two Wheeler Taxi
- 23.2.2. Four Wheeler Taxi
- 23.1. Market Analysis, Insights and Forecast - by Type
- 24. Competitive Analysis
- 24.1. Company Profiles
- 24.1.1 Blu Smart Mobility
- 24.1.1.1. Company Overview
- 24.1.1.2. Products
- 24.1.1.3. Company Financials
- 24.1.1.4. SWOT Analysis
- 24.1.2 Taxi Electric
- 24.1.2.1. Company Overview
- 24.1.2.2. Products
- 24.1.2.3. Company Financials
- 24.1.2.4. SWOT Analysis
- 24.1.3 Say Taxi
- 24.1.3.1. Company Overview
- 24.1.3.2. Products
- 24.1.3.3. Company Financials
- 24.1.3.4. SWOT Analysis
- 24.1.4 Ola Cabs
- 24.1.4.1. Company Overview
- 24.1.4.2. Products
- 24.1.4.3. Company Financials
- 24.1.4.4. SWOT Analysis
- 24.1.5 eee-Taxi
- 24.1.5.1. Company Overview
- 24.1.5.2. Products
- 24.1.5.3. Company Financials
- 24.1.5.4. SWOT Analysis
- 24.1.6 Connexxion
- 24.1.6.1. Company Overview
- 24.1.6.2. Products
- 24.1.6.3. Company Financials
- 24.1.6.4. SWOT Analysis
- 24.1.7 Uber
- 24.1.7.1. Company Overview
- 24.1.7.2. Products
- 24.1.7.3. Company Financials
- 24.1.7.4. SWOT Analysis
- 24.1.8 Prakrit
- 24.1.8.1. Company Overview
- 24.1.8.2. Products
- 24.1.8.3. Company Financials
- 24.1.8.4. SWOT Analysis
- 24.1.1 Blu Smart Mobility
- 24.2. Market Entropy
- 24.2.1 Company's Key Areas Served
- 24.2.2 Recent Developments
- 24.3. Company Market Share Analysis 2025
- 24.3.1 Top 5 Companies Market Share Analysis
- 24.3.2 Top 3 Companies Market Share Analysis
- 24.4. List of Potential Customers
- 25. Research Methodology
List of Figures
- Figure 1: Global EV Taxi Industry Revenue Breakdown (billion, %) by Region 2025 & 2033
- Figure 2: United States EV Taxi Industry Revenue (billion), by Type 2025 & 2033
- Figure 3: United States EV Taxi Industry Revenue Share (%), by Type 2025 & 2033
- Figure 4: United States EV Taxi Industry Revenue (billion), by Vehicle Type 2025 & 2033
- Figure 5: United States EV Taxi Industry Revenue Share (%), by Vehicle Type 2025 & 2033
- Figure 6: United States EV Taxi Industry Revenue (billion), by Country 2025 & 2033
- Figure 7: United States EV Taxi Industry Revenue Share (%), by Country 2025 & 2033
- Figure 8: Canada EV Taxi Industry Revenue (billion), by Type 2025 & 2033
- Figure 9: Canada EV Taxi Industry Revenue Share (%), by Type 2025 & 2033
- Figure 10: Canada EV Taxi Industry Revenue (billion), by Vehicle Type 2025 & 2033
- Figure 11: Canada EV Taxi Industry Revenue Share (%), by Vehicle Type 2025 & 2033
- Figure 12: Canada EV Taxi Industry Revenue (billion), by Country 2025 & 2033
- Figure 13: Canada EV Taxi Industry Revenue Share (%), by Country 2025 & 2033
- Figure 14: Rest of North America EV Taxi Industry Revenue (billion), by Type 2025 & 2033
- Figure 15: Rest of North America EV Taxi Industry Revenue Share (%), by Type 2025 & 2033
- Figure 16: Rest of North America EV Taxi Industry Revenue (billion), by Vehicle Type 2025 & 2033
- Figure 17: Rest of North America EV Taxi Industry Revenue Share (%), by Vehicle Type 2025 & 2033
- Figure 18: Rest of North America EV Taxi Industry Revenue (billion), by Country 2025 & 2033
- Figure 19: Rest of North America EV Taxi Industry Revenue Share (%), by Country 2025 & 2033
- Figure 20: Germany EV Taxi Industry Revenue (billion), by Type 2025 & 2033
- Figure 21: Germany EV Taxi Industry Revenue Share (%), by Type 2025 & 2033
- Figure 22: Germany EV Taxi Industry Revenue (billion), by Vehicle Type 2025 & 2033
- Figure 23: Germany EV Taxi Industry Revenue Share (%), by Vehicle Type 2025 & 2033
- Figure 24: Germany EV Taxi Industry Revenue (billion), by Country 2025 & 2033
- Figure 25: Germany EV Taxi Industry Revenue Share (%), by Country 2025 & 2033
- Figure 26: United Kingdom EV Taxi Industry Revenue (billion), by Type 2025 & 2033
- Figure 27: United Kingdom EV Taxi Industry Revenue Share (%), by Type 2025 & 2033
- Figure 28: United Kingdom EV Taxi Industry Revenue (billion), by Vehicle Type 2025 & 2033
- Figure 29: United Kingdom EV Taxi Industry Revenue Share (%), by Vehicle Type 2025 & 2033
- Figure 30: United Kingdom EV Taxi Industry Revenue (billion), by Country 2025 & 2033
- Figure 31: United Kingdom EV Taxi Industry Revenue Share (%), by Country 2025 & 2033
- Figure 32: France EV Taxi Industry Revenue (billion), by Type 2025 & 2033
- Figure 33: France EV Taxi Industry Revenue Share (%), by Type 2025 & 2033
- Figure 34: France EV Taxi Industry Revenue (billion), by Vehicle Type 2025 & 2033
- Figure 35: France EV Taxi Industry Revenue Share (%), by Vehicle Type 2025 & 2033
- Figure 36: France EV Taxi Industry Revenue (billion), by Country 2025 & 2033
- Figure 37: France EV Taxi Industry Revenue Share (%), by Country 2025 & 2033
- Figure 38: Italy EV Taxi Industry Revenue (billion), by Type 2025 & 2033
- Figure 39: Italy EV Taxi Industry Revenue Share (%), by Type 2025 & 2033
- Figure 40: Italy EV Taxi Industry Revenue (billion), by Vehicle Type 2025 & 2033
- Figure 41: Italy EV Taxi Industry Revenue Share (%), by Vehicle Type 2025 & 2033
- Figure 42: Italy EV Taxi Industry Revenue (billion), by Country 2025 & 2033
- Figure 43: Italy EV Taxi Industry Revenue Share (%), by Country 2025 & 2033
- Figure 44: Rest of Europe EV Taxi Industry Revenue (billion), by Type 2025 & 2033
- Figure 45: Rest of Europe EV Taxi Industry Revenue Share (%), by Type 2025 & 2033
- Figure 46: Rest of Europe EV Taxi Industry Revenue (billion), by Vehicle Type 2025 & 2033
- Figure 47: Rest of Europe EV Taxi Industry Revenue Share (%), by Vehicle Type 2025 & 2033
- Figure 48: Rest of Europe EV Taxi Industry Revenue (billion), by Country 2025 & 2033
- Figure 49: Rest of Europe EV Taxi Industry Revenue Share (%), by Country 2025 & 2033
- Figure 50: China EV Taxi Industry Revenue (billion), by Type 2025 & 2033
- Figure 51: China EV Taxi Industry Revenue Share (%), by Type 2025 & 2033
- Figure 52: China EV Taxi Industry Revenue (billion), by Vehicle Type 2025 & 2033
- Figure 53: China EV Taxi Industry Revenue Share (%), by Vehicle Type 2025 & 2033
- Figure 54: China EV Taxi Industry Revenue (billion), by Country 2025 & 2033
- Figure 55: China EV Taxi Industry Revenue Share (%), by Country 2025 & 2033
- Figure 56: India EV Taxi Industry Revenue (billion), by Type 2025 & 2033
- Figure 57: India EV Taxi Industry Revenue Share (%), by Type 2025 & 2033
- Figure 58: India EV Taxi Industry Revenue (billion), by Vehicle Type 2025 & 2033
- Figure 59: India EV Taxi Industry Revenue Share (%), by Vehicle Type 2025 & 2033
- Figure 60: India EV Taxi Industry Revenue (billion), by Country 2025 & 2033
- Figure 61: India EV Taxi Industry Revenue Share (%), by Country 2025 & 2033
- Figure 62: Japan EV Taxi Industry Revenue (billion), by Type 2025 & 2033
- Figure 63: Japan EV Taxi Industry Revenue Share (%), by Type 2025 & 2033
- Figure 64: Japan EV Taxi Industry Revenue (billion), by Vehicle Type 2025 & 2033
- Figure 65: Japan EV Taxi Industry Revenue Share (%), by Vehicle Type 2025 & 2033
- Figure 66: Japan EV Taxi Industry Revenue (billion), by Country 2025 & 2033
- Figure 67: Japan EV Taxi Industry Revenue Share (%), by Country 2025 & 2033
- Figure 68: South Korea EV Taxi Industry Revenue (billion), by Type 2025 & 2033
- Figure 69: South Korea EV Taxi Industry Revenue Share (%), by Type 2025 & 2033
- Figure 70: South Korea EV Taxi Industry Revenue (billion), by Vehicle Type 2025 & 2033
- Figure 71: South Korea EV Taxi Industry Revenue Share (%), by Vehicle Type 2025 & 2033
- Figure 72: South Korea EV Taxi Industry Revenue (billion), by Country 2025 & 2033
- Figure 73: South Korea EV Taxi Industry Revenue Share (%), by Country 2025 & 2033
- Figure 74: Rest of Asia Pacific EV Taxi Industry Revenue (billion), by Type 2025 & 2033
- Figure 75: Rest of Asia Pacific EV Taxi Industry Revenue Share (%), by Type 2025 & 2033
- Figure 76: Rest of Asia Pacific EV Taxi Industry Revenue (billion), by Vehicle Type 2025 & 2033
- Figure 77: Rest of Asia Pacific EV Taxi Industry Revenue Share (%), by Vehicle Type 2025 & 2033
- Figure 78: Rest of Asia Pacific EV Taxi Industry Revenue (billion), by Country 2025 & 2033
- Figure 79: Rest of Asia Pacific EV Taxi Industry Revenue Share (%), by Country 2025 & 2033
- Figure 80: Mexico EV Taxi Industry Revenue (billion), by Type 2025 & 2033
- Figure 81: Mexico EV Taxi Industry Revenue Share (%), by Type 2025 & 2033
- Figure 82: Mexico EV Taxi Industry Revenue (billion), by Vehicle Type 2025 & 2033
- Figure 83: Mexico EV Taxi Industry Revenue Share (%), by Vehicle Type 2025 & 2033
- Figure 84: Mexico EV Taxi Industry Revenue (billion), by Country 2025 & 2033
- Figure 85: Mexico EV Taxi Industry Revenue Share (%), by Country 2025 & 2033
- Figure 86: Brazil EV Taxi Industry Revenue (billion), by Type 2025 & 2033
- Figure 87: Brazil EV Taxi Industry Revenue Share (%), by Type 2025 & 2033
- Figure 88: Brazil EV Taxi Industry Revenue (billion), by Vehicle Type 2025 & 2033
- Figure 89: Brazil EV Taxi Industry Revenue Share (%), by Vehicle Type 2025 & 2033
- Figure 90: Brazil EV Taxi Industry Revenue (billion), by Country 2025 & 2033
- Figure 91: Brazil EV Taxi Industry Revenue Share (%), by Country 2025 & 2033
- Figure 92: United Arab Emirates EV Taxi Industry Revenue (billion), by Type 2025 & 2033
- Figure 93: United Arab Emirates EV Taxi Industry Revenue Share (%), by Type 2025 & 2033
- Figure 94: United Arab Emirates EV Taxi Industry Revenue (billion), by Vehicle Type 2025 & 2033
- Figure 95: United Arab Emirates EV Taxi Industry Revenue Share (%), by Vehicle Type 2025 & 2033
- Figure 96: United Arab Emirates EV Taxi Industry Revenue (billion), by Country 2025 & 2033
- Figure 97: United Arab Emirates EV Taxi Industry Revenue Share (%), by Country 2025 & 2033
- Figure 98: Other Countries EV Taxi Industry Revenue (billion), by Type 2025 & 2033
- Figure 99: Other Countries EV Taxi Industry Revenue Share (%), by Type 2025 & 2033
- Figure 100: Other Countries EV Taxi Industry Revenue (billion), by Vehicle Type 2025 & 2033
- Figure 101: Other Countries EV Taxi Industry Revenue Share (%), by Vehicle Type 2025 & 2033
- Figure 102: Other Countries EV Taxi Industry Revenue (billion), by Country 2025 & 2033
- Figure 103: Other Countries EV Taxi Industry Revenue Share (%), by Country 2025 & 2033
List of Tables
- Table 1: Global EV Taxi Industry Revenue billion Forecast, by Type 2020 & 2033
- Table 2: Global EV Taxi Industry Revenue billion Forecast, by Vehicle Type 2020 & 2033
- Table 3: Global EV Taxi Industry Revenue billion Forecast, by Region 2020 & 2033
- Table 4: Global EV Taxi Industry Revenue billion Forecast, by Type 2020 & 2033
- Table 5: Global EV Taxi Industry Revenue billion Forecast, by Vehicle Type 2020 & 2033
- Table 6: Global EV Taxi Industry Revenue billion Forecast, by Country 2020 & 2033
- Table 7: Global EV Taxi Industry Revenue billion Forecast, by Type 2020 & 2033
- Table 8: Global EV Taxi Industry Revenue billion Forecast, by Vehicle Type 2020 & 2033
- Table 9: Global EV Taxi Industry Revenue billion Forecast, by Country 2020 & 2033
- Table 10: Global EV Taxi Industry Revenue billion Forecast, by Type 2020 & 2033
- Table 11: Global EV Taxi Industry Revenue billion Forecast, by Vehicle Type 2020 & 2033
- Table 12: Global EV Taxi Industry Revenue billion Forecast, by Country 2020 & 2033
- Table 13: Global EV Taxi Industry Revenue billion Forecast, by Type 2020 & 2033
- Table 14: Global EV Taxi Industry Revenue billion Forecast, by Vehicle Type 2020 & 2033
- Table 15: Global EV Taxi Industry Revenue billion Forecast, by Country 2020 & 2033
- Table 16: Global EV Taxi Industry Revenue billion Forecast, by Type 2020 & 2033
- Table 17: Global EV Taxi Industry Revenue billion Forecast, by Vehicle Type 2020 & 2033
- Table 18: Global EV Taxi Industry Revenue billion Forecast, by Country 2020 & 2033
- Table 19: Global EV Taxi Industry Revenue billion Forecast, by Type 2020 & 2033
- Table 20: Global EV Taxi Industry Revenue billion Forecast, by Vehicle Type 2020 & 2033
- Table 21: Global EV Taxi Industry Revenue billion Forecast, by Country 2020 & 2033
- Table 22: Global EV Taxi Industry Revenue billion Forecast, by Type 2020 & 2033
- Table 23: Global EV Taxi Industry Revenue billion Forecast, by Vehicle Type 2020 & 2033
- Table 24: Global EV Taxi Industry Revenue billion Forecast, by Country 2020 & 2033
- Table 25: Global EV Taxi Industry Revenue billion Forecast, by Type 2020 & 2033
- Table 26: Global EV Taxi Industry Revenue billion Forecast, by Vehicle Type 2020 & 2033
- Table 27: Global EV Taxi Industry Revenue billion Forecast, by Country 2020 & 2033
- Table 28: Global EV Taxi Industry Revenue billion Forecast, by Type 2020 & 2033
- Table 29: Global EV Taxi Industry Revenue billion Forecast, by Vehicle Type 2020 & 2033
- Table 30: Global EV Taxi Industry Revenue billion Forecast, by Country 2020 & 2033
- Table 31: Global EV Taxi Industry Revenue billion Forecast, by Type 2020 & 2033
- Table 32: Global EV Taxi Industry Revenue billion Forecast, by Vehicle Type 2020 & 2033
- Table 33: Global EV Taxi Industry Revenue billion Forecast, by Country 2020 & 2033
- Table 34: Global EV Taxi Industry Revenue billion Forecast, by Type 2020 & 2033
- Table 35: Global EV Taxi Industry Revenue billion Forecast, by Vehicle Type 2020 & 2033
- Table 36: Global EV Taxi Industry Revenue billion Forecast, by Country 2020 & 2033
- Table 37: Global EV Taxi Industry Revenue billion Forecast, by Type 2020 & 2033
- Table 38: Global EV Taxi Industry Revenue billion Forecast, by Vehicle Type 2020 & 2033
- Table 39: Global EV Taxi Industry Revenue billion Forecast, by Country 2020 & 2033
- Table 40: Global EV Taxi Industry Revenue billion Forecast, by Type 2020 & 2033
- Table 41: Global EV Taxi Industry Revenue billion Forecast, by Vehicle Type 2020 & 2033
- Table 42: Global EV Taxi Industry Revenue billion Forecast, by Country 2020 & 2033
- Table 43: Global EV Taxi Industry Revenue billion Forecast, by Type 2020 & 2033
- Table 44: Global EV Taxi Industry Revenue billion Forecast, by Vehicle Type 2020 & 2033
- Table 45: Global EV Taxi Industry Revenue billion Forecast, by Country 2020 & 2033
- Table 46: Global EV Taxi Industry Revenue billion Forecast, by Type 2020 & 2033
- Table 47: Global EV Taxi Industry Revenue billion Forecast, by Vehicle Type 2020 & 2033
- Table 48: Global EV Taxi Industry Revenue billion Forecast, by Country 2020 & 2033
- Table 49: Global EV Taxi Industry Revenue billion Forecast, by Type 2020 & 2033
- Table 50: Global EV Taxi Industry Revenue billion Forecast, by Vehicle Type 2020 & 2033
- Table 51: Global EV Taxi Industry Revenue billion Forecast, by Country 2020 & 2033
- Table 52: Global EV Taxi Industry Revenue billion Forecast, by Type 2020 & 2033
- Table 53: Global EV Taxi Industry Revenue billion Forecast, by Vehicle Type 2020 & 2033
- Table 54: Global EV Taxi Industry Revenue billion Forecast, by Country 2020 & 2033
Frequently Asked Questions
1. What is the projected Compound Annual Growth Rate (CAGR) of the EV Taxi Industry?
The projected CAGR is approximately 25.56%.
2. Which companies are prominent players in the EV Taxi Industry?
Key companies in the market include Blu Smart Mobility, Taxi Electric, Say Taxi, Ola Cabs, eee-Taxi, Connexxion, Uber, Prakrit.
3. What are the main segments of the EV Taxi Industry?
The market segments include Type, Vehicle Type.
4. Can you provide details about the market size?
The market size is estimated to be USD 29.54 billion as of 2022.
5. What are some drivers contributing to market growth?
Government Policies to promote electric Vehicles Sales.
6. What are the notable trends driving market growth?
Government Initiatives and Investment is Boosting the Demand.
7. Are there any restraints impacting market growth?
High Cost of Capital Expenditure for Electric Vehicle Infrastructure.
8. Can you provide examples of recent developments in the market?
N/A
9. What pricing options are available for accessing the report?
Pricing options include single-user, multi-user, and enterprise licenses priced at USD 4750, USD 5250, and USD 8750 respectively.
10. Is the market size provided in terms of value or volume?
The market size is provided in terms of value, measured in billion.
11. Are there any specific market keywords associated with the report?
Yes, the market keyword associated with the report is "EV Taxi Industry," which aids in identifying and referencing the specific market segment covered.
12. How do I determine which pricing option suits my needs best?
The pricing options vary based on user requirements and access needs. Individual users may opt for single-user licenses, while businesses requiring broader access may choose multi-user or enterprise licenses for cost-effective access to the report.
13. Are there any additional resources or data provided in the EV Taxi Industry report?
While the report offers comprehensive insights, it's advisable to review the specific contents or supplementary materials provided to ascertain if additional resources or data are available.
14. How can I stay updated on further developments or reports in the EV Taxi Industry?
To stay informed about further developments, trends, and reports in the EV Taxi Industry, consider subscribing to industry newsletters, following relevant companies and organizations, or regularly checking reputable industry news sources and publications.
Methodology
Step 1 - Identification of Relevant Samples Size from Population Database


Step 2 - Approaches for Defining Global Market Size (Value, Volume* & Price*)

Note*: In applicable scenarios
Step 3 - Data Sources
Primary Research
- Web Analytics
- Survey Reports
- Research Institute
- Latest Research Reports
- Opinion Leaders
Secondary Research
- Annual Reports
- White Paper
- Latest Press Release
- Industry Association
- Paid Database
- Investor Presentations

Step 4 - Data Triangulation
Involves using different sources of information in order to increase the validity of a study
These sources are likely to be stakeholders in a program - participants, other researchers, program staff, other community members, and so on.
Then we put all data in single framework & apply various statistical tools to find out the dynamic on the market.
During the analysis stage, feedback from the stakeholder groups would be compared to determine areas of agreement as well as areas of divergence