

Key Insights
The global Exploration Software market is poised for significant expansion, projected to reach $416 million by 2025, driven by a robust CAGR of 7.2% throughout the forecast period of 2025-2033. This growth trajectory is primarily fueled by the increasing need for advanced geological modeling and seismic data interpretation tools across the oil & gas industry. As exploration efforts intensify to meet growing energy demands and discover new reserves, sophisticated software solutions are becoming indispensable for optimizing resource allocation, reducing exploration risks, and improving success rates. The market is witnessing a strong adoption of cloud-based solutions, offering enhanced scalability, accessibility, and collaborative capabilities for exploration teams, especially benefiting large enterprises and SMEs alike. Furthermore, the ongoing digital transformation within the energy sector, encompassing big data analytics, artificial intelligence, and machine learning integration, is creating new avenues for innovation and market penetration for exploration software providers.
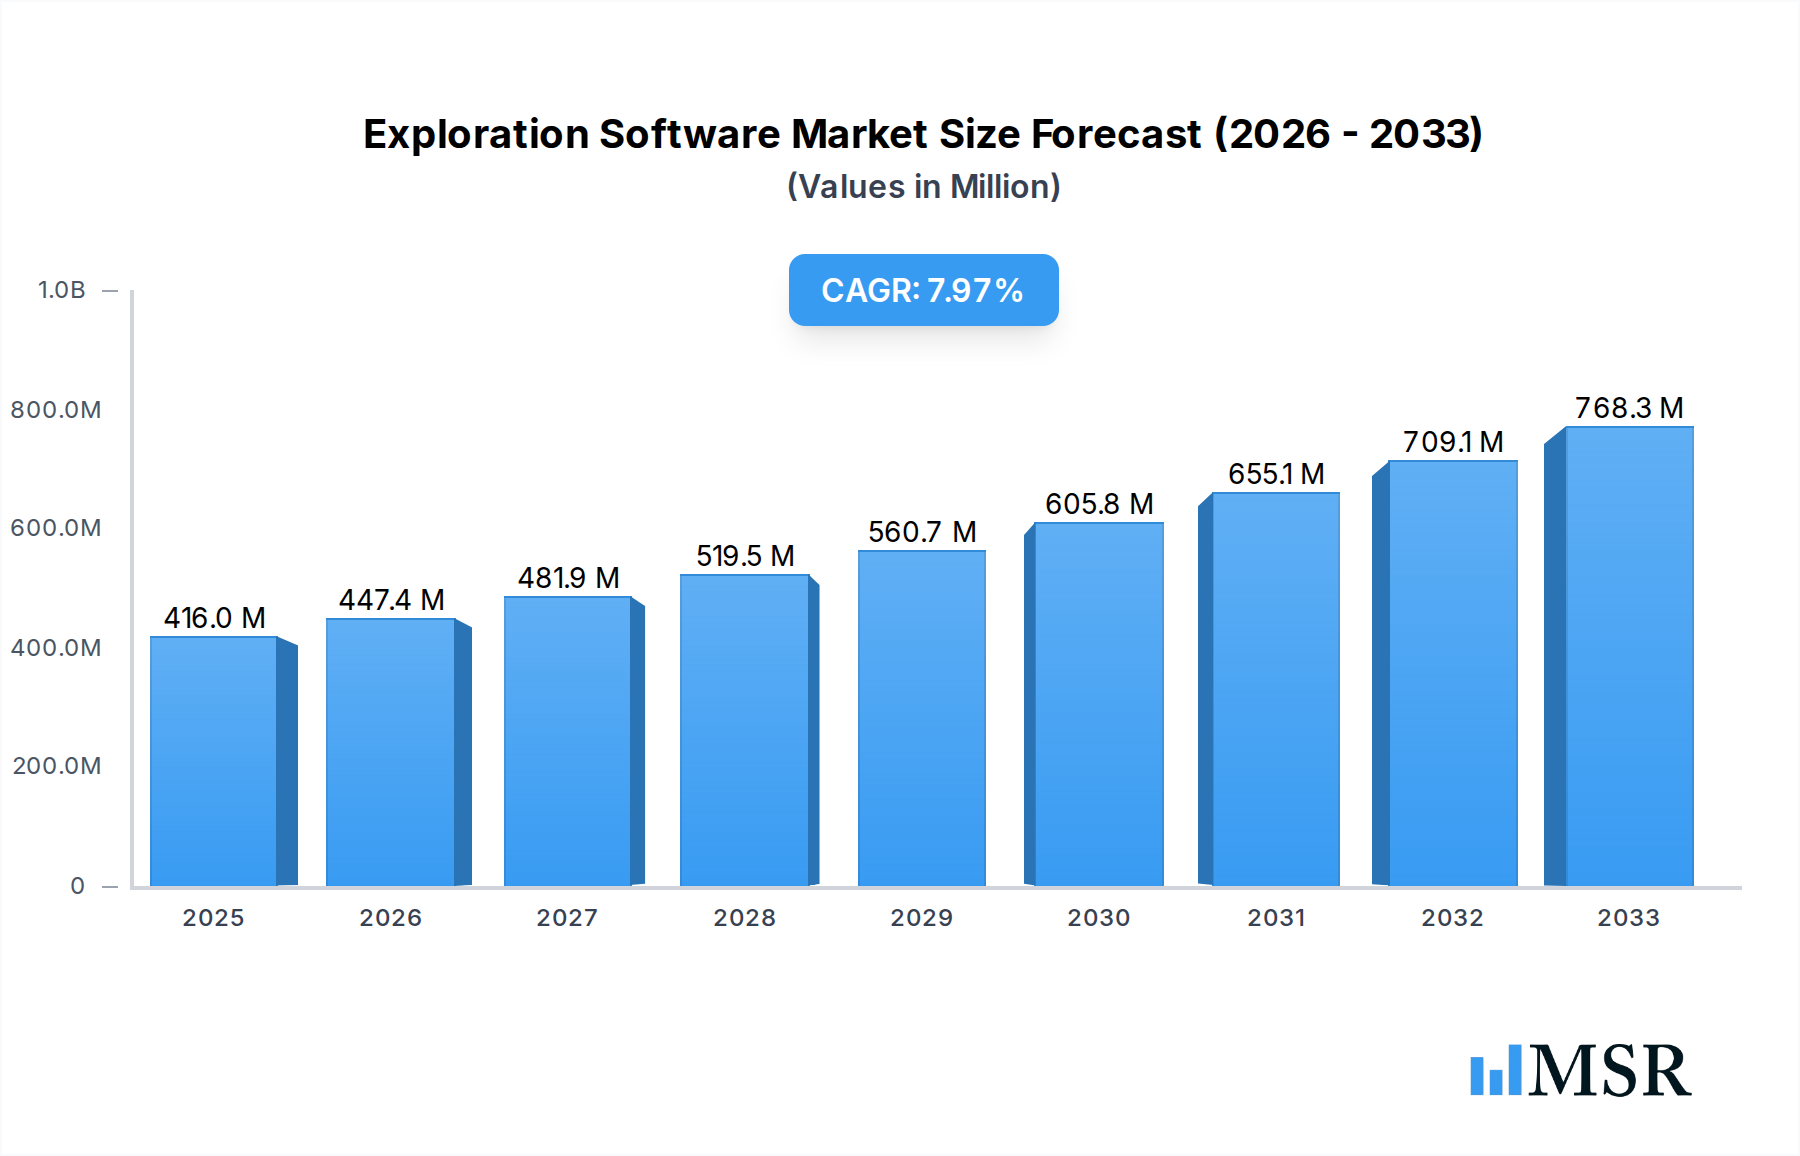
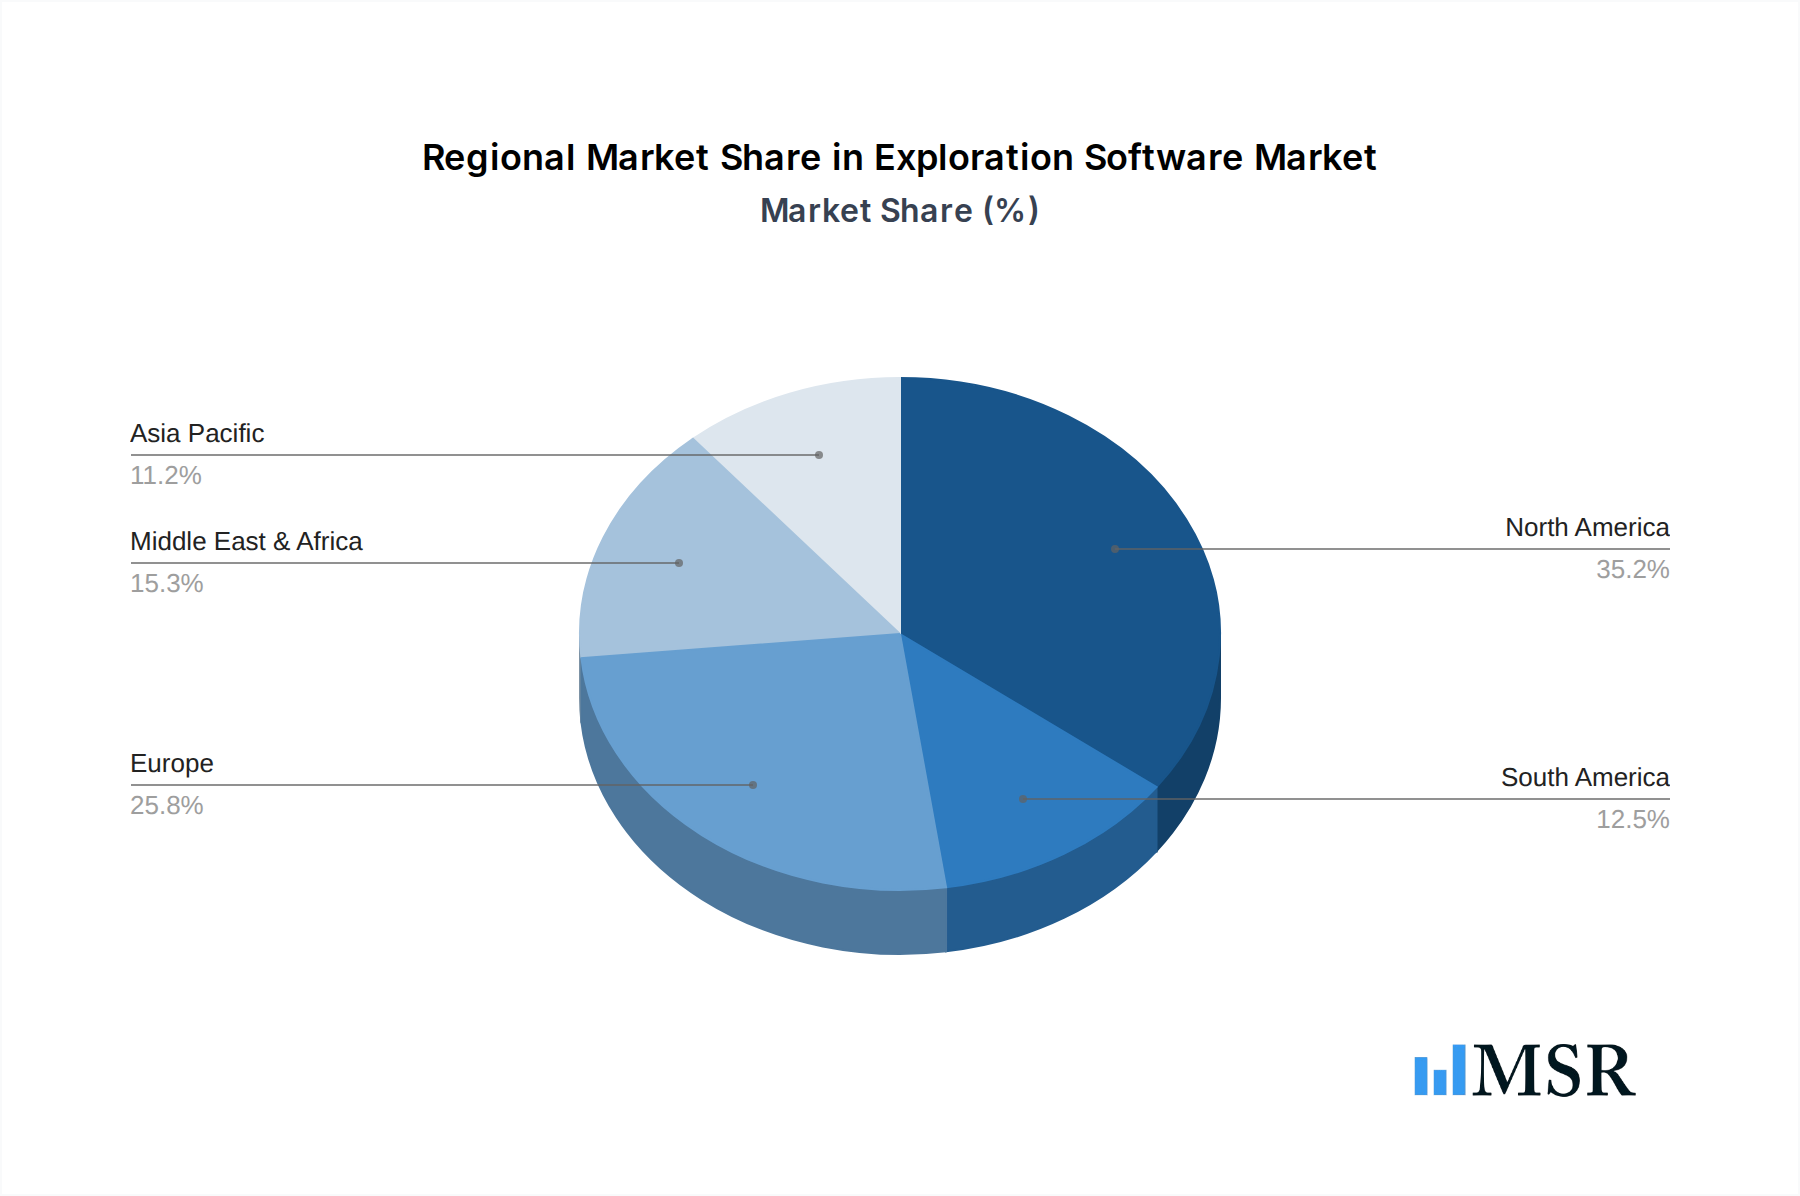
Exploration Software Market Size (In Million)
Key drivers such as the rising complexity of exploration targets, the need for efficient data management, and the demand for enhanced visualization and simulation tools are propelling market growth. Despite these positive trends, certain restraints, including high implementation costs for some advanced solutions and the availability of skilled personnel, may present challenges. However, the continuous evolution of technology and the growing emphasis on cost-effective exploration strategies are expected to mitigate these limitations. Geographically, North America is anticipated to lead the market due to extensive oil and gas exploration activities, followed by Europe and the Middle East & Africa. The Asia Pacific region, with its burgeoning energy needs and increasing investments in exploration, presents a substantial growth opportunity. Companies like Schlumberger, Sintef, and Petrel E&P are at the forefront, innovating and expanding their offerings to cater to the evolving needs of the exploration sector.

Exploration Software Company Market Share
Exploration Software Market Research Report: Comprehensive Analysis 2019–2033
This comprehensive Exploration Software Market Research Report delivers deep insights into the global exploration software landscape, covering market dynamics, key trends, leading segments, product developments, challenges, growth drivers, emerging opportunities, and strategic outlook from 2019 to 2033. With a base year of 2025 and a forecast period of 2025–2033, this report provides actionable intelligence for industry stakeholders, including Schlumberger, Sintef, Petrel E&P, Quorum, geoSCOUT, and Exprodat. The analysis focuses on critical segments such as Large Enterprises and SMEs, and deployment types including Cloud Based and Web Based exploration software solutions.
Exploration Software Market Concentration & Dynamics
The exploration software market exhibits a moderate to high concentration, driven by significant investments in research and development by major players. Innovation ecosystems are characterized by collaborative efforts between software developers and oil and gas companies, fostering advancements in seismic data interpretation, reservoir modeling, and geological surveying. Regulatory frameworks primarily focus on data security and environmental impact assessments, influencing software development and deployment strategies. Substitute products, such as advanced analytical tools or outsourced geological services, present a dynamic competitive element. End-user trends highlight an increasing demand for integrated, user-friendly platforms that streamline complex exploration workflows and reduce time-to-discovery. Mergers and acquisitions (M&A) activity remains a key driver of market consolidation, with an estimated 15 M&A deals in the historical period (2019-2024) aimed at expanding product portfolios and market reach. Market share analysis reveals that leading companies hold substantial portions, with the top three players accounting for approximately 65% of the global market.
Exploration Software Industry Insights & Trends
The global exploration software market is projected for substantial growth, driven by the escalating need for efficient and advanced tools in the upstream oil and gas sector. The market size was valued at an estimated $5.5 billion in the base year 2025 and is anticipated to expand to $8.9 billion by 2033, exhibiting a Compound Annual Growth Rate (CAGR) of approximately 6.2% during the forecast period. Technological disruptions are at the forefront, with the integration of Artificial Intelligence (AI) and Machine Learning (ML) revolutionizing data processing, anomaly detection, and predictive analytics in exploration activities. Cloud-based solutions are gaining significant traction due to their scalability, accessibility, and cost-effectiveness, enabling smaller enterprises to leverage sophisticated exploration tools without substantial upfront investment. Evolving consumer behaviors within the industry reflect a growing preference for subscription-based models, interoperable software suites, and solutions that offer real-time data visualization and collaboration features. The increasing complexity of geological formations and the need to unlock reserves in challenging environments further propel the demand for innovative exploration software. Furthermore, a renewed focus on energy security and the ongoing exploration for new hydrocarbon reserves, particularly in emerging markets, are contributing to sustained market expansion. The integration of Big Data analytics and the Internet of Things (IoT) in exploration workflows are also key trends, enabling more comprehensive data capture and analysis, leading to improved exploration success rates and reduced operational risks. The shift towards digital transformation across the energy sector is a fundamental driver, pushing companies to adopt advanced digital tools for competitive advantage.
Key Markets & Segments Leading Exploration Software
The Cloud Based segment is emerging as the dominant deployment type within the exploration software market, driven by its inherent scalability, flexibility, and reduced IT infrastructure overheads. This is particularly beneficial for SMEs who can access advanced exploration capabilities without significant capital expenditure.
- Drivers for Cloud Based Dominance:
- Cost Efficiency: Reduced upfront hardware and software licensing costs.
- Scalability: Ability to scale resources up or down based on project needs.
- Accessibility: Seamless access from any location with internet connectivity.
- Collaboration: Enhanced collaboration features for distributed teams.
- Automatic Updates: Continuous software improvements and feature additions.
The Large Enterprises segment continues to be a significant consumer of exploration software, leveraging comprehensive suites for complex, large-scale projects. Their demand for robust, integrated platforms that offer advanced analytics and simulation capabilities remains a cornerstone of market revenue. The increasing complexity of global exploration targets and the imperative to optimize resource allocation for maximum return on investment are fueling this demand. Regions like North America and Asia Pacific are leading the market due to substantial investments in oil and gas exploration, driven by economic growth and energy security concerns. For instance, the United States, with its mature but continuously active exploration landscape, and China, with its burgeoning energy demands, represent key growth markets. The adoption of Cloud Based solutions within both Large Enterprises and SMEs is accelerating, as companies recognize the benefits of agility and reduced operational burdens.
Exploration Software Product Developments
Recent product developments in exploration software are heavily influenced by advancements in AI, ML, and cloud computing. Innovations are focused on creating more intelligent, automated workflows for seismic interpretation, reservoir characterization, and risk assessment. Companies are developing platforms that integrate diverse geological and geophysical data sources, offering predictive modeling capabilities and real-time insights. The emphasis is on user-friendly interfaces that democratize access to complex analytical tools, enabling faster decision-making and improved exploration success rates. These technological advancements provide a significant competitive edge for software providers.
Challenges in the Exploration Software Market
The exploration software market faces several challenges, including the high cost of advanced software implementation and integration with existing legacy systems, which can be a barrier for smaller entities. Cybersecurity threats to sensitive geological data necessitate robust security measures, adding to operational costs and complexity. Furthermore, a shortage of skilled geoscientists proficient in utilizing these advanced digital tools can hinder adoption and effective utilization, impacting the full potential of software investments.
Forces Driving Exploration Software Growth
Several key forces are driving the growth of the exploration software market. The increasing global demand for energy necessitates continuous exploration for new hydrocarbon reserves, fueling the need for more efficient discovery tools. Technological advancements, particularly in AI and ML, are enabling sophisticated data analysis and interpretation, leading to higher success rates. Furthermore, the drive for operational efficiency and cost reduction in the oil and gas industry encourages the adoption of digital solutions that streamline workflows and minimize exploration risks.
Challenges in the Exploration Software Market
Long-term growth catalysts for the exploration software market lie in continued innovation and strategic market expansion. The development of AI-powered predictive analytics that can identify promising exploration targets with unprecedented accuracy will be a significant differentiator. Partnerships between software vendors and exploration companies will foster tailored solutions that address specific geological challenges. Expansion into emerging markets with untapped exploration potential and the integration of blockchain technology for secure and transparent data management are also key long-term growth accelerators.
Emerging Opportunities in Exploration Software
Emerging opportunities in exploration software are ripe for exploitation. The growing demand for exploration in frontier regions and deep-water environments presents a significant market for advanced 3D seismic visualization and interpretation tools. The integration of drone technology for remote sensing and geological surveys, coupled with AI-driven analysis, offers a new frontier. Furthermore, the increasing focus on sustainable exploration practices and the potential for carbon capture and storage (CCS) site identification are opening up new avenues for specialized exploration software solutions, catering to evolving industry needs and regulatory landscapes.
Leading Players in the Exploration Software Sector
- Schlumberger
- Sintef
- Petrel E&P
- Quorum
- geoSCOUT
- Exprodat
Key Milestones in Exploration Software Industry
- 2019: Launch of advanced AI-driven seismic interpretation modules by key market players, enhancing predictive capabilities.
- 2020: Increased adoption of cloud-based exploration platforms by SMEs, driven by cost-effectiveness and scalability.
- 2021: Major acquisitions in the market, consolidating market share and expanding product portfolios.
- 2022: Significant advancements in real-time data integration from various sensors and sources into exploration software.
- 2023: Development of user-centric interfaces and collaborative tools to improve geoscientist productivity.
- 2024: Enhanced integration of Machine Learning algorithms for automated geological feature identification.
Strategic Outlook for Exploration Software Market
The strategic outlook for the exploration software market is characterized by continued innovation and a strong focus on digital transformation. Growth accelerators will include the deeper integration of AI and ML for predictive analytics, the expansion of cloud-native solutions, and the development of interoperable platforms that facilitate seamless data exchange. Strategic partnerships with energy companies to co-create bespoke solutions and the exploration of new application areas, such as unconventional resource exploration and geothermal energy assessment, will further bolster market growth and unlock new revenue streams in the coming years.
Exploration Software Segmentation
-
1. Application
- 1.1. Large Enterprises
- 1.2. SMEs
-
2. Type
- 2.1. Cloud Based
- 2.2. Web Based
Exploration Software Segmentation By Geography
-
1. North America
- 1.1. United States
- 1.2. Canada
- 1.3. Mexico
-
2. South America
- 2.1. Brazil
- 2.2. Argentina
- 2.3. Rest of South America
-
3. Europe
- 3.1. United Kingdom
- 3.2. Germany
- 3.3. France
- 3.4. Italy
- 3.5. Spain
- 3.6. Russia
- 3.7. Benelux
- 3.8. Nordics
- 3.9. Rest of Europe
-
4. Middle East & Africa
- 4.1. Turkey
- 4.2. Israel
- 4.3. GCC
- 4.4. North Africa
- 4.5. South Africa
- 4.6. Rest of Middle East & Africa
-
5. Asia Pacific
- 5.1. China
- 5.2. India
- 5.3. Japan
- 5.4. South Korea
- 5.5. ASEAN
- 5.6. Oceania
- 5.7. Rest of Asia Pacific
Exploration Software Regional Market Share
Geographic Coverage of Exploration Software
Exploration Software REPORT HIGHLIGHTS
| Aspects | Details |
|---|---|
| Study Period | 2020-2034 |
| Base Year | 2025 |
| Estimated Year | 2026 |
| Forecast Period | 2026-2034 |
| Historical Period | 2020-2025 |
| Growth Rate | CAGR of 7.2% from 2020-2034 |
| Segmentation |
|
Table of Contents
- 1. Introduction
- 1.1. Research Scope
- 1.2. Market Segmentation
- 1.3. Research Methodology
- 1.4. Definitions and Assumptions
- 2. Executive Summary
- 2.1. Introduction
- 3. Market Dynamics
- 3.1. Introduction
- 3.2. Market Drivers
- 3.3. Market Restrains
- 3.4. Market Trends
- 4. Market Factor Analysis
- 4.1. Porters Five Forces
- 4.2. Supply/Value Chain
- 4.3. PESTEL analysis
- 4.4. Market Entropy
- 4.5. Patent/Trademark Analysis
- 5. Global Exploration Software Analysis, Insights and Forecast, 2020-2032
- 5.1. Market Analysis, Insights and Forecast - by Application
- 5.1.1. Large Enterprises
- 5.1.2. SMEs
- 5.2. Market Analysis, Insights and Forecast - by Type
- 5.2.1. Cloud Based
- 5.2.2. Web Based
- 5.3. Market Analysis, Insights and Forecast - by Region
- 5.3.1. North America
- 5.3.2. South America
- 5.3.3. Europe
- 5.3.4. Middle East & Africa
- 5.3.5. Asia Pacific
- 5.1. Market Analysis, Insights and Forecast - by Application
- 6. North America Exploration Software Analysis, Insights and Forecast, 2020-2032
- 6.1. Market Analysis, Insights and Forecast - by Application
- 6.1.1. Large Enterprises
- 6.1.2. SMEs
- 6.2. Market Analysis, Insights and Forecast - by Type
- 6.2.1. Cloud Based
- 6.2.2. Web Based
- 6.1. Market Analysis, Insights and Forecast - by Application
- 7. South America Exploration Software Analysis, Insights and Forecast, 2020-2032
- 7.1. Market Analysis, Insights and Forecast - by Application
- 7.1.1. Large Enterprises
- 7.1.2. SMEs
- 7.2. Market Analysis, Insights and Forecast - by Type
- 7.2.1. Cloud Based
- 7.2.2. Web Based
- 7.1. Market Analysis, Insights and Forecast - by Application
- 8. Europe Exploration Software Analysis, Insights and Forecast, 2020-2032
- 8.1. Market Analysis, Insights and Forecast - by Application
- 8.1.1. Large Enterprises
- 8.1.2. SMEs
- 8.2. Market Analysis, Insights and Forecast - by Type
- 8.2.1. Cloud Based
- 8.2.2. Web Based
- 8.1. Market Analysis, Insights and Forecast - by Application
- 9. Middle East & Africa Exploration Software Analysis, Insights and Forecast, 2020-2032
- 9.1. Market Analysis, Insights and Forecast - by Application
- 9.1.1. Large Enterprises
- 9.1.2. SMEs
- 9.2. Market Analysis, Insights and Forecast - by Type
- 9.2.1. Cloud Based
- 9.2.2. Web Based
- 9.1. Market Analysis, Insights and Forecast - by Application
- 10. Asia Pacific Exploration Software Analysis, Insights and Forecast, 2020-2032
- 10.1. Market Analysis, Insights and Forecast - by Application
- 10.1.1. Large Enterprises
- 10.1.2. SMEs
- 10.2. Market Analysis, Insights and Forecast - by Type
- 10.2.1. Cloud Based
- 10.2.2. Web Based
- 10.1. Market Analysis, Insights and Forecast - by Application
- 11. Competitive Analysis
- 11.1. Global Market Share Analysis 2025
- 11.2. Company Profiles
- 11.2.1 Schlumberger
- 11.2.1.1. Overview
- 11.2.1.2. Products
- 11.2.1.3. SWOT Analysis
- 11.2.1.4. Recent Developments
- 11.2.1.5. Financials (Based on Availability)
- 11.2.2 Sintef
- 11.2.2.1. Overview
- 11.2.2.2. Products
- 11.2.2.3. SWOT Analysis
- 11.2.2.4. Recent Developments
- 11.2.2.5. Financials (Based on Availability)
- 11.2.3 Petrel E&P
- 11.2.3.1. Overview
- 11.2.3.2. Products
- 11.2.3.3. SWOT Analysis
- 11.2.3.4. Recent Developments
- 11.2.3.5. Financials (Based on Availability)
- 11.2.4 Quorum
- 11.2.4.1. Overview
- 11.2.4.2. Products
- 11.2.4.3. SWOT Analysis
- 11.2.4.4. Recent Developments
- 11.2.4.5. Financials (Based on Availability)
- 11.2.5 geoSCOUT
- 11.2.5.1. Overview
- 11.2.5.2. Products
- 11.2.5.3. SWOT Analysis
- 11.2.5.4. Recent Developments
- 11.2.5.5. Financials (Based on Availability)
- 11.2.6 Exprodat
- 11.2.6.1. Overview
- 11.2.6.2. Products
- 11.2.6.3. SWOT Analysis
- 11.2.6.4. Recent Developments
- 11.2.6.5. Financials (Based on Availability)
- 11.2.1 Schlumberger
List of Figures
- Figure 1: Global Exploration Software Revenue Breakdown (million, %) by Region 2025 & 2033
- Figure 2: North America Exploration Software Revenue (million), by Application 2025 & 2033
- Figure 3: North America Exploration Software Revenue Share (%), by Application 2025 & 2033
- Figure 4: North America Exploration Software Revenue (million), by Type 2025 & 2033
- Figure 5: North America Exploration Software Revenue Share (%), by Type 2025 & 2033
- Figure 6: North America Exploration Software Revenue (million), by Country 2025 & 2033
- Figure 7: North America Exploration Software Revenue Share (%), by Country 2025 & 2033
- Figure 8: South America Exploration Software Revenue (million), by Application 2025 & 2033
- Figure 9: South America Exploration Software Revenue Share (%), by Application 2025 & 2033
- Figure 10: South America Exploration Software Revenue (million), by Type 2025 & 2033
- Figure 11: South America Exploration Software Revenue Share (%), by Type 2025 & 2033
- Figure 12: South America Exploration Software Revenue (million), by Country 2025 & 2033
- Figure 13: South America Exploration Software Revenue Share (%), by Country 2025 & 2033
- Figure 14: Europe Exploration Software Revenue (million), by Application 2025 & 2033
- Figure 15: Europe Exploration Software Revenue Share (%), by Application 2025 & 2033
- Figure 16: Europe Exploration Software Revenue (million), by Type 2025 & 2033
- Figure 17: Europe Exploration Software Revenue Share (%), by Type 2025 & 2033
- Figure 18: Europe Exploration Software Revenue (million), by Country 2025 & 2033
- Figure 19: Europe Exploration Software Revenue Share (%), by Country 2025 & 2033
- Figure 20: Middle East & Africa Exploration Software Revenue (million), by Application 2025 & 2033
- Figure 21: Middle East & Africa Exploration Software Revenue Share (%), by Application 2025 & 2033
- Figure 22: Middle East & Africa Exploration Software Revenue (million), by Type 2025 & 2033
- Figure 23: Middle East & Africa Exploration Software Revenue Share (%), by Type 2025 & 2033
- Figure 24: Middle East & Africa Exploration Software Revenue (million), by Country 2025 & 2033
- Figure 25: Middle East & Africa Exploration Software Revenue Share (%), by Country 2025 & 2033
- Figure 26: Asia Pacific Exploration Software Revenue (million), by Application 2025 & 2033
- Figure 27: Asia Pacific Exploration Software Revenue Share (%), by Application 2025 & 2033
- Figure 28: Asia Pacific Exploration Software Revenue (million), by Type 2025 & 2033
- Figure 29: Asia Pacific Exploration Software Revenue Share (%), by Type 2025 & 2033
- Figure 30: Asia Pacific Exploration Software Revenue (million), by Country 2025 & 2033
- Figure 31: Asia Pacific Exploration Software Revenue Share (%), by Country 2025 & 2033
List of Tables
- Table 1: Global Exploration Software Revenue million Forecast, by Application 2020 & 2033
- Table 2: Global Exploration Software Revenue million Forecast, by Type 2020 & 2033
- Table 3: Global Exploration Software Revenue million Forecast, by Region 2020 & 2033
- Table 4: Global Exploration Software Revenue million Forecast, by Application 2020 & 2033
- Table 5: Global Exploration Software Revenue million Forecast, by Type 2020 & 2033
- Table 6: Global Exploration Software Revenue million Forecast, by Country 2020 & 2033
- Table 7: United States Exploration Software Revenue (million) Forecast, by Application 2020 & 2033
- Table 8: Canada Exploration Software Revenue (million) Forecast, by Application 2020 & 2033
- Table 9: Mexico Exploration Software Revenue (million) Forecast, by Application 2020 & 2033
- Table 10: Global Exploration Software Revenue million Forecast, by Application 2020 & 2033
- Table 11: Global Exploration Software Revenue million Forecast, by Type 2020 & 2033
- Table 12: Global Exploration Software Revenue million Forecast, by Country 2020 & 2033
- Table 13: Brazil Exploration Software Revenue (million) Forecast, by Application 2020 & 2033
- Table 14: Argentina Exploration Software Revenue (million) Forecast, by Application 2020 & 2033
- Table 15: Rest of South America Exploration Software Revenue (million) Forecast, by Application 2020 & 2033
- Table 16: Global Exploration Software Revenue million Forecast, by Application 2020 & 2033
- Table 17: Global Exploration Software Revenue million Forecast, by Type 2020 & 2033
- Table 18: Global Exploration Software Revenue million Forecast, by Country 2020 & 2033
- Table 19: United Kingdom Exploration Software Revenue (million) Forecast, by Application 2020 & 2033
- Table 20: Germany Exploration Software Revenue (million) Forecast, by Application 2020 & 2033
- Table 21: France Exploration Software Revenue (million) Forecast, by Application 2020 & 2033
- Table 22: Italy Exploration Software Revenue (million) Forecast, by Application 2020 & 2033
- Table 23: Spain Exploration Software Revenue (million) Forecast, by Application 2020 & 2033
- Table 24: Russia Exploration Software Revenue (million) Forecast, by Application 2020 & 2033
- Table 25: Benelux Exploration Software Revenue (million) Forecast, by Application 2020 & 2033
- Table 26: Nordics Exploration Software Revenue (million) Forecast, by Application 2020 & 2033
- Table 27: Rest of Europe Exploration Software Revenue (million) Forecast, by Application 2020 & 2033
- Table 28: Global Exploration Software Revenue million Forecast, by Application 2020 & 2033
- Table 29: Global Exploration Software Revenue million Forecast, by Type 2020 & 2033
- Table 30: Global Exploration Software Revenue million Forecast, by Country 2020 & 2033
- Table 31: Turkey Exploration Software Revenue (million) Forecast, by Application 2020 & 2033
- Table 32: Israel Exploration Software Revenue (million) Forecast, by Application 2020 & 2033
- Table 33: GCC Exploration Software Revenue (million) Forecast, by Application 2020 & 2033
- Table 34: North Africa Exploration Software Revenue (million) Forecast, by Application 2020 & 2033
- Table 35: South Africa Exploration Software Revenue (million) Forecast, by Application 2020 & 2033
- Table 36: Rest of Middle East & Africa Exploration Software Revenue (million) Forecast, by Application 2020 & 2033
- Table 37: Global Exploration Software Revenue million Forecast, by Application 2020 & 2033
- Table 38: Global Exploration Software Revenue million Forecast, by Type 2020 & 2033
- Table 39: Global Exploration Software Revenue million Forecast, by Country 2020 & 2033
- Table 40: China Exploration Software Revenue (million) Forecast, by Application 2020 & 2033
- Table 41: India Exploration Software Revenue (million) Forecast, by Application 2020 & 2033
- Table 42: Japan Exploration Software Revenue (million) Forecast, by Application 2020 & 2033
- Table 43: South Korea Exploration Software Revenue (million) Forecast, by Application 2020 & 2033
- Table 44: ASEAN Exploration Software Revenue (million) Forecast, by Application 2020 & 2033
- Table 45: Oceania Exploration Software Revenue (million) Forecast, by Application 2020 & 2033
- Table 46: Rest of Asia Pacific Exploration Software Revenue (million) Forecast, by Application 2020 & 2033
Frequently Asked Questions
1. What is the projected Compound Annual Growth Rate (CAGR) of the Exploration Software?
The projected CAGR is approximately 7.2%.
2. Which companies are prominent players in the Exploration Software?
Key companies in the market include Schlumberger, Sintef, Petrel E&P, Quorum, geoSCOUT, Exprodat.
3. What are the main segments of the Exploration Software?
The market segments include Application, Type.
4. Can you provide details about the market size?
The market size is estimated to be USD 416 million as of 2022.
5. What are some drivers contributing to market growth?
N/A
6. What are the notable trends driving market growth?
N/A
7. Are there any restraints impacting market growth?
N/A
8. Can you provide examples of recent developments in the market?
N/A
9. What pricing options are available for accessing the report?
Pricing options include single-user, multi-user, and enterprise licenses priced at USD 2900.00, USD 4350.00, and USD 5800.00 respectively.
10. Is the market size provided in terms of value or volume?
The market size is provided in terms of value, measured in million.
11. Are there any specific market keywords associated with the report?
Yes, the market keyword associated with the report is "Exploration Software," which aids in identifying and referencing the specific market segment covered.
12. How do I determine which pricing option suits my needs best?
The pricing options vary based on user requirements and access needs. Individual users may opt for single-user licenses, while businesses requiring broader access may choose multi-user or enterprise licenses for cost-effective access to the report.
13. Are there any additional resources or data provided in the Exploration Software report?
While the report offers comprehensive insights, it's advisable to review the specific contents or supplementary materials provided to ascertain if additional resources or data are available.
14. How can I stay updated on further developments or reports in the Exploration Software?
To stay informed about further developments, trends, and reports in the Exploration Software, consider subscribing to industry newsletters, following relevant companies and organizations, or regularly checking reputable industry news sources and publications.
Methodology
Step 1 - Identification of Relevant Samples Size from Population Database


Step 2 - Approaches for Defining Global Market Size (Value, Volume* & Price*)

Note*: In applicable scenarios
Step 3 - Data Sources
Primary Research
- Web Analytics
- Survey Reports
- Research Institute
- Latest Research Reports
- Opinion Leaders
Secondary Research
- Annual Reports
- White Paper
- Latest Press Release
- Industry Association
- Paid Database
- Investor Presentations

Step 4 - Data Triangulation
Involves using different sources of information in order to increase the validity of a study
These sources are likely to be stakeholders in a program - participants, other researchers, program staff, other community members, and so on.
Then we put all data in single framework & apply various statistical tools to find out the dynamic on the market.
During the analysis stage, feedback from the stakeholder groups would be compared to determine areas of agreement as well as areas of divergence