


Key Insights
The global Fintech App market is poised for substantial expansion, projected to reach approximately $250 billion by 2025, with a robust Compound Annual Growth Rate (CAGR) of around 25% anticipated throughout the forecast period of 2025-2033. This significant growth is propelled by a confluence of factors, including the escalating adoption of smartphones, increasing internet penetration worldwide, and a growing consumer demand for convenient, digital-first financial solutions. Key drivers underpinning this trend are the surging popularity of mobile banking apps offering seamless transaction capabilities and account management, alongside the rising prominence of personal finance apps that empower individuals to budget, track expenses, and manage investments more effectively. Furthermore, the Regtech App segment is gaining traction as financial institutions increasingly leverage technology to comply with complex regulatory frameworks, enhancing efficiency and reducing operational risks. This dynamic landscape is characterized by continuous innovation, with companies actively developing user-friendly interfaces and integrating advanced features like AI-powered financial advice and cryptocurrency management. The market's evolution is also shaped by a growing emphasis on financial inclusion, with fintech solutions catering to previously underserved populations and offering accessible financial services.
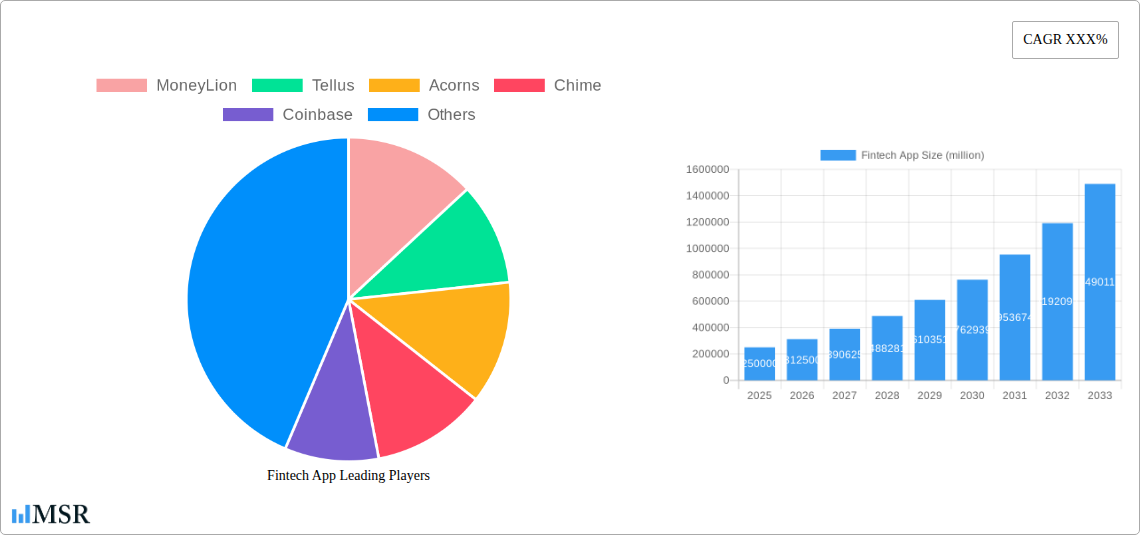
Fintech App Market Size (In Billion)

Despite the optimistic outlook, the Fintech App market faces certain restraints that could temper its growth trajectory. Intense competition among a growing number of established players and emerging startups necessitates significant investment in marketing and product development to capture market share. Cybersecurity concerns and data privacy issues remain paramount, as users entrust sensitive financial information to these platforms, demanding robust security measures and transparent data handling practices. Regulatory hurdles, varying across different regions, can also create complexities and slow down market penetration. However, the market's inherent agility and its capacity to adapt to evolving technological landscapes and consumer preferences suggest these challenges will be navigated. The segmentation of the market reveals a strong demand across both Personal and Enterprise applications, with Mobile Banking Apps and Personal Finance Apps leading the charge in consumer adoption, while Regtech Apps are crucial for business operations. Geographically, North America and Europe currently dominate the market, but the Asia Pacific region, particularly China and India, is demonstrating rapid growth potential, fueled by a burgeoning tech-savvy population and increasing smartphone penetration.
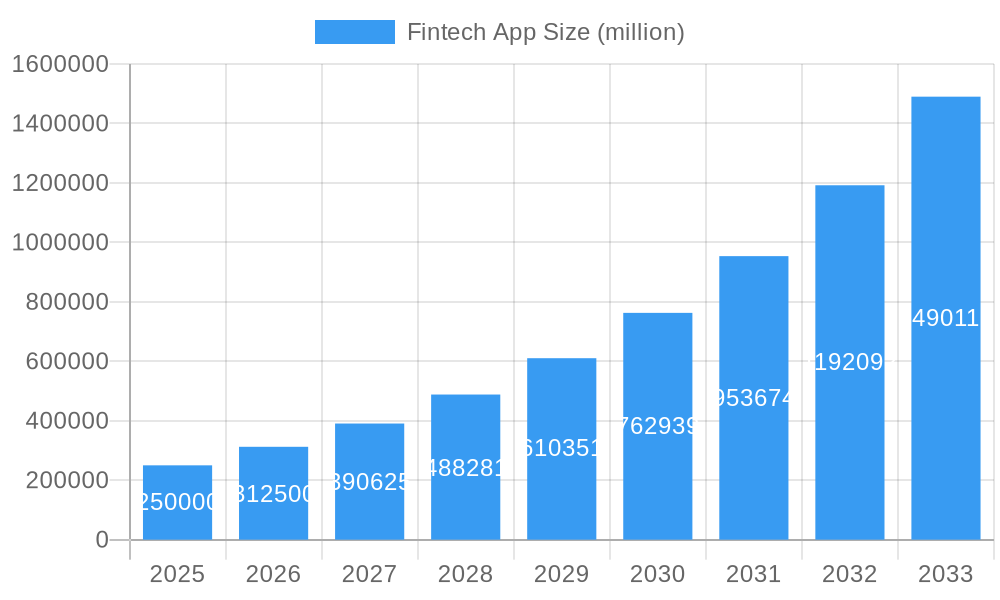
Fintech App Company Market Share
Fintech App Market Research Report: Unlocking Growth and Innovation (2019-2033)
Dive deep into the dynamic Fintech app market with this comprehensive report. Spanning from 2019 to 2033, with a base year of 2025, this analysis provides invaluable insights into market concentration, groundbreaking industry developments, and the leading players shaping the future of finance. Understand the intricate forces driving fintech app growth, identify emerging opportunities, and navigate the challenges for strategic success. This report is essential for financial technology investors, mobile banking app developers, personal finance app providers, and regtech app innovators.
Fintech App Market Concentration & Dynamics
The fintech app market exhibits a dynamic interplay of concentration and intense innovation. While a few dominant players like Chime, Robinhood, and Revolut command significant market share, the landscape is continually reshaped by agile startups and strategic acquisitions. The innovation ecosystem is fueled by advancements in AI, blockchain, and cloud computing, fostering the development of specialized personal finance apps and sophisticated enterprise fintech solutions. Regulatory frameworks, though evolving, present both opportunities and challenges, particularly for regtech apps aiming to streamline compliance. Substitute products, ranging from traditional banking services to emerging decentralized finance (DeFi) platforms, create a competitive pressure cooker. End-user trends are increasingly leaning towards seamless digital experiences, personalization, and democratized access to financial tools, as evidenced by the rise of apps like Acorns and Mint. Mergers and acquisitions (M&A) activity remains robust, with an estimated XX billion in deal value within the historical period (2019-2024), indicating a strong consolidation drive and the pursuit of synergistic growth. Key M&A deals include, but are not limited to, the acquisition of X by Y for an undisclosed sum, and Z's investment of XX million in startup A, demonstrating a consistent appetite for market expansion and technological integration.
Fintech App Industry Insights & Trends
The global fintech app market is poised for substantial expansion, projected to reach a market size of over $XXX billion by 2033, with a Compound Annual Growth Rate (CAGR) of xx.x% during the forecast period (2025–2033). This impressive growth is underpinned by several key factors. The increasing digitization of financial services is a primary driver, with consumers and businesses alike embracing the convenience and efficiency offered by mobile banking apps and personal finance apps. Technological disruptions are at the forefront, with the integration of artificial intelligence (AI) for personalized financial advice, machine learning for fraud detection, and blockchain technology for secure and transparent transactions. The rise of open banking APIs is further accelerating innovation, enabling seamless integration of services and fostering a more connected financial ecosystem. Evolving consumer behaviors, particularly among younger demographics, prioritize digital-first solutions, on-demand access to funds, and user-friendly interfaces. This shift is evident in the success of platforms like Nubank, SoFi, and PayPal, which have redefined customer expectations for banking and payment services. The demand for embedded finance solutions, where financial services are integrated into non-financial platforms, is also a significant trend, creating new revenue streams and expanding the reach of fintech solutions. Furthermore, the growing adoption of buy now, pay later (BNPL) services, exemplified by players like Klarna (not explicitly listed but a significant market force), signals a paradigm shift in consumer spending habits. The increasing focus on financial wellness and education, addressed by apps such as Personal Capital and YNAB, also contributes to market growth as individuals seek tools to manage their finances more effectively. The regtech app segment is also experiencing robust growth, driven by the increasing complexity of financial regulations and the need for automated compliance solutions for enterprises.
Key Markets & Segments Leading Fintech App
North America currently leads the fintech app market, driven by a mature technological infrastructure, high smartphone penetration, and a favorable regulatory environment for innovation. The United States, in particular, is a hotbed for fintech app development, with major hubs in Silicon Valley and New York City fostering a vibrant ecosystem. The dominance of this region is attributed to:
- Economic Growth and Disposable Income: High disposable incomes in developed economies translate to greater consumer spending on digital financial services and investment platforms.
- Technological Infrastructure: Advanced internet penetration and widespread smartphone adoption create a fertile ground for the widespread use of mobile banking apps and personal finance apps.
- Venture Capital Investment: Significant venture capital funding fuels research and development, enabling rapid innovation and scaling of fintech startups across segments.
In terms of Application, the Personal segment is the primary revenue generator, encompassing a wide array of personal finance apps, mobile banking apps, and investment platforms like Acorns, Robinhood, and Stash. The ease of use and personalized features of these apps resonate strongly with individual consumers seeking to manage their money, save, and invest. The Enterprise segment, while smaller, is exhibiting rapid growth, driven by the increasing demand for regtech apps and business-focused financial management tools. Companies are leveraging fintech solutions to optimize payments, streamline accounting, and enhance regulatory compliance.
Within the Type segment, Mobile Banking Apps and Personal Finance Apps collectively hold the largest market share. Apps such as Chime, Revolut, and Nubank are revolutionizing traditional banking with their intuitive interfaces and feature-rich offerings. Similarly, Mint, Personal Capital, and YNAB empower individuals with comprehensive budgeting, tracking, and financial planning tools. The Regtech App segment is experiencing accelerated growth due to escalating regulatory complexities worldwide, with companies like Finch and Prism offering innovative solutions for compliance automation and risk management. The "Others" category, encompassing niche solutions like peer-to-peer lending platforms and cryptocurrency exchanges (e.g., Coinbase), also contributes to the market's diversity and growth trajectory.
Fintech App Product Developments
The fintech app market is characterized by continuous product innovation, with companies like MoneyLion, Tellus, Emma, and Honeydue consistently enhancing their offerings. Key advancements include the integration of AI-powered chatbots for customer support, personalized financial insights, and automated investment strategies. The development of seamless user experiences, intuitive interfaces, and robust security features remains paramount. Furthermore, the emergence of embedded finance solutions and the expansion of cryptocurrency functionalities within existing platforms are significant trends, expanding the market relevance and competitive edge of these fintech solutions. The focus is on creating holistic financial ecosystems that cater to diverse user needs, from basic banking to advanced wealth management.
Challenges in the Fintech App Market
Despite robust growth, the fintech app market faces several challenges that could impede its trajectory. Regulatory hurdles remain a significant concern, with evolving compliance requirements and data privacy laws demanding continuous adaptation. Supply chain issues, particularly concerning hardware components for some fintech devices and the dependence on third-party service providers for cloud infrastructure, can impact development and deployment timelines. Competitive pressures are also intense, with established financial institutions increasingly launching their own digital offerings and new startups constantly emerging. These challenges, if not effectively addressed, could lead to increased operational costs and slower market penetration, potentially impacting market valuation by an estimated XX%.
Forces Driving Fintech App Growth
The relentless growth of the fintech app market is propelled by a confluence of powerful forces. Technologically, advancements in AI, blockchain, and cloud computing enable the creation of more sophisticated, secure, and personalized financial solutions. Economically, the increasing demand for financial inclusion and the desire for convenient, accessible financial services, particularly in emerging markets, are major catalysts. Regulatory factors, such as the push for open banking and the establishment of clear frameworks for digital assets, also foster innovation and market expansion. These drivers collectively contribute to the significant market expansion observed across mobile banking apps, personal finance apps, and regtech apps.
Challenges in the Fintech App Market
Long-term growth in the fintech app market hinges on strategic adaptations to evolving landscapes. Sustained innovation in areas like decentralized finance (DeFi), embedded finance, and hyper-personalization will be crucial. Strategic partnerships between traditional financial institutions and fintech firms are essential for broader market reach and enhanced credibility. Furthermore, successful market expansions into underserved regions, coupled with a strong focus on building trust and educating consumers about the benefits of digital finance, will be key to unlocking future potential and solidifying the market's sustained expansion.
Emerging Opportunities in Fintech App
The fintech app market is ripe with emerging opportunities for forward-thinking companies. The expansion of embedded finance into non-financial sectors, offering seamless payment and lending solutions, presents a significant growth avenue. The increasing adoption of sustainable finance and ESG (Environmental, Social, and Governance) investing principles creates a demand for specialized personal finance apps and investment platforms focused on these areas. Furthermore, the growing cryptocurrency and digital asset landscape offers opportunities for innovative platforms that provide secure and user-friendly access to these markets. The development of AI-driven financial advisory services tailored for specific demographics and niche financial needs also represents a promising frontier.
Leading Players in the Fintech App Sector
- MoneyLion
- Tellus
- Acorns
- Chime
- Coinbase
- Finch
- Mint
- Robinhood
- Revolut
- Emma
- Nubank
- Prism
- Cuvva
- Earnin
- N26
- Matador
- Honeydue
- Penfold
- Planto
- Lemonade
- SoFi
- Personal Capital
- YNAB
- Qapital
- Betterment
- PayPal
- Stash
Key Milestones in Fintech App Industry
- 2019: Significant growth in neobanks and challenger banks gaining substantial user bases.
- 2020: Surge in adoption of digital payment solutions due to global events, impacting PayPal and similar platforms.
- 2021: Increased venture funding for regtech apps and compliance solutions, with companies like Finch seeing notable investment.
- 2022: Expansion of Buy Now, Pay Later (BNPL) services, with Acorns and Stash diversifying their offerings.
- 2023: Growing interest in DeFi applications and the integration of crypto features into mainstream fintech apps.
- 2024 (projected): Increased focus on AI-driven personalization and predictive analytics in personal finance apps.
- 2025 (forecast): Continued consolidation through M&A as larger players acquire innovative startups.
- 2026-2033 (forecast): Maturation of embedded finance, widespread adoption of quantum-resistant cryptography for enhanced security.
Strategic Outlook for Fintech App Market
The strategic outlook for the fintech app market is exceptionally positive, characterized by sustained innovation and expanding market reach. Growth accelerators will include the deepening integration of AI for hyper-personalized financial services, the continued proliferation of embedded finance solutions across diverse industries, and the increasing demand for specialized regtech apps to navigate complex global regulations. Partnerships between traditional financial institutions and agile fintech firms will unlock new customer segments and distribution channels. Furthermore, a strong focus on user education and trust-building will be paramount to driving adoption in emerging markets and for newer technologies like decentralized finance. Companies that prioritize a seamless user experience, robust security, and a commitment to financial inclusion will be best positioned to capitalize on the immense future potential of this dynamic sector.
Fintech App Segmentation
-
1. Application
- 1.1. Personal
- 1.2. Enterprise
-
2. Type
- 2.1. Mobile Banking App
- 2.2. Personal Finance App
- 2.3. Regtech App
- 2.4. Others
Fintech App Segmentation By Geography
-
1. North America
- 1.1. United States
- 1.2. Canada
- 1.3. Mexico
-
2. South America
- 2.1. Brazil
- 2.2. Argentina
- 2.3. Rest of South America
-
3. Europe
- 3.1. United Kingdom
- 3.2. Germany
- 3.3. France
- 3.4. Italy
- 3.5. Spain
- 3.6. Russia
- 3.7. Benelux
- 3.8. Nordics
- 3.9. Rest of Europe
-
4. Middle East & Africa
- 4.1. Turkey
- 4.2. Israel
- 4.3. GCC
- 4.4. North Africa
- 4.5. South Africa
- 4.6. Rest of Middle East & Africa
-
5. Asia Pacific
- 5.1. China
- 5.2. India
- 5.3. Japan
- 5.4. South Korea
- 5.5. ASEAN
- 5.6. Oceania
- 5.7. Rest of Asia Pacific
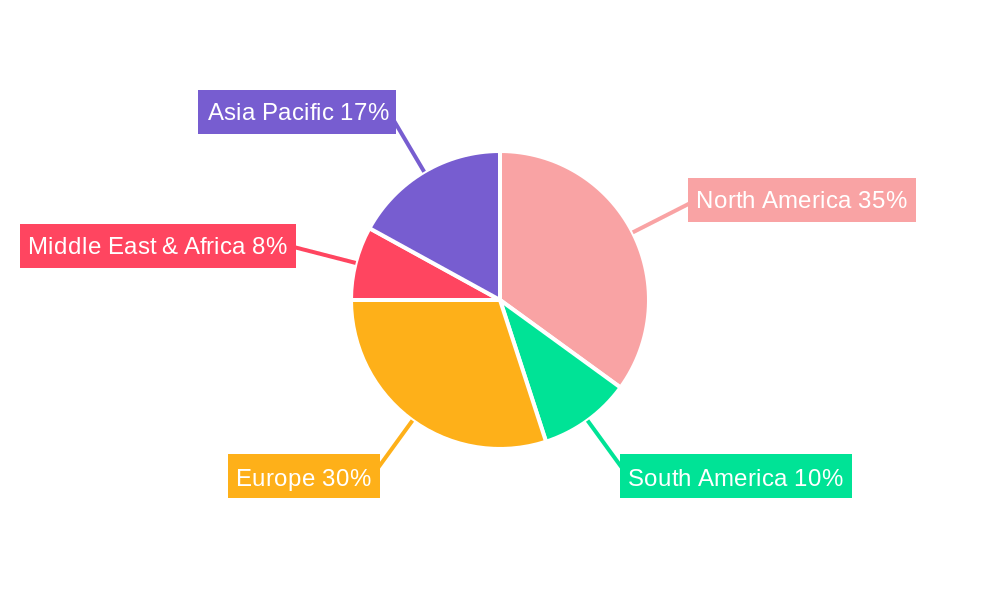
Fintech App Regional Market Share
Geographic Coverage of Fintech App
Fintech App REPORT HIGHLIGHTS
| Aspects | Details |
|---|---|
| Study Period | 2020-2034 |
| Base Year | 2025 |
| Estimated Year | 2026 |
| Forecast Period | 2026-2034 |
| Historical Period | 2020-2025 |
| Growth Rate | CAGR of 16.3% from 2020-2034 |
| Segmentation |
|
Table of Contents
- 1. Introduction
- 1.1. Research Scope
- 1.2. Market Segmentation
- 1.3. Research Objective
- 1.4. Definitions and Assumptions
- 2. Executive Summary
- 2.1. Market Snapshot
- 3. Market Dynamics
- 3.1. Market Drivers
- 3.2. Market Restrains
- 3.3. Market Trends
- 3.4. Market Opportunities
- 4. Market Factor Analysis
- 4.1. Porters Five Forces
- 4.1.1. Bargaining Power of Suppliers
- 4.1.2. Bargaining Power of Buyers
- 4.1.3. Threat of New Entrants
- 4.1.4. Threat of Substitutes
- 4.1.5. Competitive Rivalry
- 4.2. PESTEL analysis
- 4.3. BCG Analysis
- 4.3.1. Stars (High Growth, High Market Share)
- 4.3.2. Cash Cows (Low Growth, High Market Share)
- 4.3.3. Question Mark (High Growth, Low Market Share)
- 4.3.4. Dogs (Low Growth, Low Market Share)
- 4.4. Ansoff Matrix Analysis
- 4.5. Supply Chain Analysis
- 4.6. Regulatory Landscape
- 4.7. Current Market Potential and Opportunity Assessment (TAM–SAM–SOM Framework)
- 4.8. MSR Analyst Note
- 4.1. Porters Five Forces
- 5. Market Analysis, Insights and Forecast 2021-2033
- 5.1. Market Analysis, Insights and Forecast - by Application
- 5.1.1. Personal
- 5.1.2. Enterprise
- 5.2. Market Analysis, Insights and Forecast - by Type
- 5.2.1. Mobile Banking App
- 5.2.2. Personal Finance App
- 5.2.3. Regtech App
- 5.2.4. Others
- 5.3. Market Analysis, Insights and Forecast - by Region
- 5.3.1. North America
- 5.3.2. South America
- 5.3.3. Europe
- 5.3.4. Middle East & Africa
- 5.3.5. Asia Pacific
- 5.1. Market Analysis, Insights and Forecast - by Application
- 6. Global Fintech App Analysis, Insights and Forecast, 2021-2033
- 6.1. Market Analysis, Insights and Forecast - by Application
- 6.1.1. Personal
- 6.1.2. Enterprise
- 6.2. Market Analysis, Insights and Forecast - by Type
- 6.2.1. Mobile Banking App
- 6.2.2. Personal Finance App
- 6.2.3. Regtech App
- 6.2.4. Others
- 6.1. Market Analysis, Insights and Forecast - by Application
- 7. North America Fintech App Analysis, Insights and Forecast, 2020-2032
- 7.1. Market Analysis, Insights and Forecast - by Application
- 7.1.1. Personal
- 7.1.2. Enterprise
- 7.2. Market Analysis, Insights and Forecast - by Type
- 7.2.1. Mobile Banking App
- 7.2.2. Personal Finance App
- 7.2.3. Regtech App
- 7.2.4. Others
- 7.1. Market Analysis, Insights and Forecast - by Application
- 8. South America Fintech App Analysis, Insights and Forecast, 2020-2032
- 8.1. Market Analysis, Insights and Forecast - by Application
- 8.1.1. Personal
- 8.1.2. Enterprise
- 8.2. Market Analysis, Insights and Forecast - by Type
- 8.2.1. Mobile Banking App
- 8.2.2. Personal Finance App
- 8.2.3. Regtech App
- 8.2.4. Others
- 8.1. Market Analysis, Insights and Forecast - by Application
- 9. Europe Fintech App Analysis, Insights and Forecast, 2020-2032
- 9.1. Market Analysis, Insights and Forecast - by Application
- 9.1.1. Personal
- 9.1.2. Enterprise
- 9.2. Market Analysis, Insights and Forecast - by Type
- 9.2.1. Mobile Banking App
- 9.2.2. Personal Finance App
- 9.2.3. Regtech App
- 9.2.4. Others
- 9.1. Market Analysis, Insights and Forecast - by Application
- 10. Middle East & Africa Fintech App Analysis, Insights and Forecast, 2020-2032
- 10.1. Market Analysis, Insights and Forecast - by Application
- 10.1.1. Personal
- 10.1.2. Enterprise
- 10.2. Market Analysis, Insights and Forecast - by Type
- 10.2.1. Mobile Banking App
- 10.2.2. Personal Finance App
- 10.2.3. Regtech App
- 10.2.4. Others
- 10.1. Market Analysis, Insights and Forecast - by Application
- 11. Asia Pacific Fintech App Analysis, Insights and Forecast, 2020-2032
- 11.1. Market Analysis, Insights and Forecast - by Application
- 11.1.1. Personal
- 11.1.2. Enterprise
- 11.2. Market Analysis, Insights and Forecast - by Type
- 11.2.1. Mobile Banking App
- 11.2.2. Personal Finance App
- 11.2.3. Regtech App
- 11.2.4. Others
- 11.1. Market Analysis, Insights and Forecast - by Application
- 12. Competitive Analysis
- 12.1. Company Profiles
- 12.1.1 MoneyLion
- 12.1.1.1. Company Overview
- 12.1.1.2. Products
- 12.1.1.3. Company Financials
- 12.1.1.4. SWOT Analysis
- 12.1.2 Tellus
- 12.1.2.1. Company Overview
- 12.1.2.2. Products
- 12.1.2.3. Company Financials
- 12.1.2.4. SWOT Analysis
- 12.1.3 Acorns
- 12.1.3.1. Company Overview
- 12.1.3.2. Products
- 12.1.3.3. Company Financials
- 12.1.3.4. SWOT Analysis
- 12.1.4 Chime
- 12.1.4.1. Company Overview
- 12.1.4.2. Products
- 12.1.4.3. Company Financials
- 12.1.4.4. SWOT Analysis
- 12.1.5 Coinbase
- 12.1.5.1. Company Overview
- 12.1.5.2. Products
- 12.1.5.3. Company Financials
- 12.1.5.4. SWOT Analysis
- 12.1.6 Finch
- 12.1.6.1. Company Overview
- 12.1.6.2. Products
- 12.1.6.3. Company Financials
- 12.1.6.4. SWOT Analysis
- 12.1.7 Mint
- 12.1.7.1. Company Overview
- 12.1.7.2. Products
- 12.1.7.3. Company Financials
- 12.1.7.4. SWOT Analysis
- 12.1.8 Robinhood
- 12.1.8.1. Company Overview
- 12.1.8.2. Products
- 12.1.8.3. Company Financials
- 12.1.8.4. SWOT Analysis
- 12.1.9 Revolut
- 12.1.9.1. Company Overview
- 12.1.9.2. Products
- 12.1.9.3. Company Financials
- 12.1.9.4. SWOT Analysis
- 12.1.10 Emma
- 12.1.10.1. Company Overview
- 12.1.10.2. Products
- 12.1.10.3. Company Financials
- 12.1.10.4. SWOT Analysis
- 12.1.11 Nubank
- 12.1.11.1. Company Overview
- 12.1.11.2. Products
- 12.1.11.3. Company Financials
- 12.1.11.4. SWOT Analysis
- 12.1.12 Prism
- 12.1.12.1. Company Overview
- 12.1.12.2. Products
- 12.1.12.3. Company Financials
- 12.1.12.4. SWOT Analysis
- 12.1.13 Cuvva
- 12.1.13.1. Company Overview
- 12.1.13.2. Products
- 12.1.13.3. Company Financials
- 12.1.13.4. SWOT Analysis
- 12.1.14 Earnin
- 12.1.14.1. Company Overview
- 12.1.14.2. Products
- 12.1.14.3. Company Financials
- 12.1.14.4. SWOT Analysis
- 12.1.15 N26
- 12.1.15.1. Company Overview
- 12.1.15.2. Products
- 12.1.15.3. Company Financials
- 12.1.15.4. SWOT Analysis
- 12.1.16 Matador
- 12.1.16.1. Company Overview
- 12.1.16.2. Products
- 12.1.16.3. Company Financials
- 12.1.16.4. SWOT Analysis
- 12.1.17 Honeydue
- 12.1.17.1. Company Overview
- 12.1.17.2. Products
- 12.1.17.3. Company Financials
- 12.1.17.4. SWOT Analysis
- 12.1.18 Penfold
- 12.1.18.1. Company Overview
- 12.1.18.2. Products
- 12.1.18.3. Company Financials
- 12.1.18.4. SWOT Analysis
- 12.1.19 Planto
- 12.1.19.1. Company Overview
- 12.1.19.2. Products
- 12.1.19.3. Company Financials
- 12.1.19.4. SWOT Analysis
- 12.1.20 Lemonade
- 12.1.20.1. Company Overview
- 12.1.20.2. Products
- 12.1.20.3. Company Financials
- 12.1.20.4. SWOT Analysis
- 12.1.21 SoFi
- 12.1.21.1. Company Overview
- 12.1.21.2. Products
- 12.1.21.3. Company Financials
- 12.1.21.4. SWOT Analysis
- 12.1.22 Personal Capital
- 12.1.22.1. Company Overview
- 12.1.22.2. Products
- 12.1.22.3. Company Financials
- 12.1.22.4. SWOT Analysis
- 12.1.23 YNAB
- 12.1.23.1. Company Overview
- 12.1.23.2. Products
- 12.1.23.3. Company Financials
- 12.1.23.4. SWOT Analysis
- 12.1.24 Qapital
- 12.1.24.1. Company Overview
- 12.1.24.2. Products
- 12.1.24.3. Company Financials
- 12.1.24.4. SWOT Analysis
- 12.1.25 Betterment
- 12.1.25.1. Company Overview
- 12.1.25.2. Products
- 12.1.25.3. Company Financials
- 12.1.25.4. SWOT Analysis
- 12.1.26 PayPal
- 12.1.26.1. Company Overview
- 12.1.26.2. Products
- 12.1.26.3. Company Financials
- 12.1.26.4. SWOT Analysis
- 12.1.27 Stash
- 12.1.27.1. Company Overview
- 12.1.27.2. Products
- 12.1.27.3. Company Financials
- 12.1.27.4. SWOT Analysis
- 12.1.1 MoneyLion
- 12.2. Market Entropy
- 12.2.1 Company's Key Areas Served
- 12.2.2 Recent Developments
- 12.3. Company Market Share Analysis 2025
- 12.3.1 Top 5 Companies Market Share Analysis
- 12.3.2 Top 3 Companies Market Share Analysis
- 12.4. List of Potential Customers
- 13. Research Methodology
List of Figures
- Figure 1: Global Fintech App Revenue Breakdown (billion, %) by Region 2025 & 2033
- Figure 2: North America Fintech App Revenue (billion), by Application 2025 & 2033
- Figure 3: North America Fintech App Revenue Share (%), by Application 2025 & 2033
- Figure 4: North America Fintech App Revenue (billion), by Type 2025 & 2033
- Figure 5: North America Fintech App Revenue Share (%), by Type 2025 & 2033
- Figure 6: North America Fintech App Revenue (billion), by Country 2025 & 2033
- Figure 7: North America Fintech App Revenue Share (%), by Country 2025 & 2033
- Figure 8: South America Fintech App Revenue (billion), by Application 2025 & 2033
- Figure 9: South America Fintech App Revenue Share (%), by Application 2025 & 2033
- Figure 10: South America Fintech App Revenue (billion), by Type 2025 & 2033
- Figure 11: South America Fintech App Revenue Share (%), by Type 2025 & 2033
- Figure 12: South America Fintech App Revenue (billion), by Country 2025 & 2033
- Figure 13: South America Fintech App Revenue Share (%), by Country 2025 & 2033
- Figure 14: Europe Fintech App Revenue (billion), by Application 2025 & 2033
- Figure 15: Europe Fintech App Revenue Share (%), by Application 2025 & 2033
- Figure 16: Europe Fintech App Revenue (billion), by Type 2025 & 2033
- Figure 17: Europe Fintech App Revenue Share (%), by Type 2025 & 2033
- Figure 18: Europe Fintech App Revenue (billion), by Country 2025 & 2033
- Figure 19: Europe Fintech App Revenue Share (%), by Country 2025 & 2033
- Figure 20: Middle East & Africa Fintech App Revenue (billion), by Application 2025 & 2033
- Figure 21: Middle East & Africa Fintech App Revenue Share (%), by Application 2025 & 2033
- Figure 22: Middle East & Africa Fintech App Revenue (billion), by Type 2025 & 2033
- Figure 23: Middle East & Africa Fintech App Revenue Share (%), by Type 2025 & 2033
- Figure 24: Middle East & Africa Fintech App Revenue (billion), by Country 2025 & 2033
- Figure 25: Middle East & Africa Fintech App Revenue Share (%), by Country 2025 & 2033
- Figure 26: Asia Pacific Fintech App Revenue (billion), by Application 2025 & 2033
- Figure 27: Asia Pacific Fintech App Revenue Share (%), by Application 2025 & 2033
- Figure 28: Asia Pacific Fintech App Revenue (billion), by Type 2025 & 2033
- Figure 29: Asia Pacific Fintech App Revenue Share (%), by Type 2025 & 2033
- Figure 30: Asia Pacific Fintech App Revenue (billion), by Country 2025 & 2033
- Figure 31: Asia Pacific Fintech App Revenue Share (%), by Country 2025 & 2033
List of Tables
- Table 1: Global Fintech App Revenue billion Forecast, by Application 2020 & 2033
- Table 2: Global Fintech App Revenue billion Forecast, by Type 2020 & 2033
- Table 3: Global Fintech App Revenue billion Forecast, by Region 2020 & 2033
- Table 4: Global Fintech App Revenue billion Forecast, by Application 2020 & 2033
- Table 5: Global Fintech App Revenue billion Forecast, by Type 2020 & 2033
- Table 6: Global Fintech App Revenue billion Forecast, by Country 2020 & 2033
- Table 7: United States Fintech App Revenue (billion) Forecast, by Application 2020 & 2033
- Table 8: Canada Fintech App Revenue (billion) Forecast, by Application 2020 & 2033
- Table 9: Mexico Fintech App Revenue (billion) Forecast, by Application 2020 & 2033
- Table 10: Global Fintech App Revenue billion Forecast, by Application 2020 & 2033
- Table 11: Global Fintech App Revenue billion Forecast, by Type 2020 & 2033
- Table 12: Global Fintech App Revenue billion Forecast, by Country 2020 & 2033
- Table 13: Brazil Fintech App Revenue (billion) Forecast, by Application 2020 & 2033
- Table 14: Argentina Fintech App Revenue (billion) Forecast, by Application 2020 & 2033
- Table 15: Rest of South America Fintech App Revenue (billion) Forecast, by Application 2020 & 2033
- Table 16: Global Fintech App Revenue billion Forecast, by Application 2020 & 2033
- Table 17: Global Fintech App Revenue billion Forecast, by Type 2020 & 2033
- Table 18: Global Fintech App Revenue billion Forecast, by Country 2020 & 2033
- Table 19: United Kingdom Fintech App Revenue (billion) Forecast, by Application 2020 & 2033
- Table 20: Germany Fintech App Revenue (billion) Forecast, by Application 2020 & 2033
- Table 21: France Fintech App Revenue (billion) Forecast, by Application 2020 & 2033
- Table 22: Italy Fintech App Revenue (billion) Forecast, by Application 2020 & 2033
- Table 23: Spain Fintech App Revenue (billion) Forecast, by Application 2020 & 2033
- Table 24: Russia Fintech App Revenue (billion) Forecast, by Application 2020 & 2033
- Table 25: Benelux Fintech App Revenue (billion) Forecast, by Application 2020 & 2033
- Table 26: Nordics Fintech App Revenue (billion) Forecast, by Application 2020 & 2033
- Table 27: Rest of Europe Fintech App Revenue (billion) Forecast, by Application 2020 & 2033
- Table 28: Global Fintech App Revenue billion Forecast, by Application 2020 & 2033
- Table 29: Global Fintech App Revenue billion Forecast, by Type 2020 & 2033
- Table 30: Global Fintech App Revenue billion Forecast, by Country 2020 & 2033
- Table 31: Turkey Fintech App Revenue (billion) Forecast, by Application 2020 & 2033
- Table 32: Israel Fintech App Revenue (billion) Forecast, by Application 2020 & 2033
- Table 33: GCC Fintech App Revenue (billion) Forecast, by Application 2020 & 2033
- Table 34: North Africa Fintech App Revenue (billion) Forecast, by Application 2020 & 2033
- Table 35: South Africa Fintech App Revenue (billion) Forecast, by Application 2020 & 2033
- Table 36: Rest of Middle East & Africa Fintech App Revenue (billion) Forecast, by Application 2020 & 2033
- Table 37: Global Fintech App Revenue billion Forecast, by Application 2020 & 2033
- Table 38: Global Fintech App Revenue billion Forecast, by Type 2020 & 2033
- Table 39: Global Fintech App Revenue billion Forecast, by Country 2020 & 2033
- Table 40: China Fintech App Revenue (billion) Forecast, by Application 2020 & 2033
- Table 41: India Fintech App Revenue (billion) Forecast, by Application 2020 & 2033
- Table 42: Japan Fintech App Revenue (billion) Forecast, by Application 2020 & 2033
- Table 43: South Korea Fintech App Revenue (billion) Forecast, by Application 2020 & 2033
- Table 44: ASEAN Fintech App Revenue (billion) Forecast, by Application 2020 & 2033
- Table 45: Oceania Fintech App Revenue (billion) Forecast, by Application 2020 & 2033
- Table 46: Rest of Asia Pacific Fintech App Revenue (billion) Forecast, by Application 2020 & 2033
Frequently Asked Questions
1. What is the projected Compound Annual Growth Rate (CAGR) of the Fintech App?
The projected CAGR is approximately 16.3%.
2. Which companies are prominent players in the Fintech App?
Key companies in the market include MoneyLion, Tellus, Acorns, Chime, Coinbase, Finch, Mint, Robinhood, Revolut, Emma, Nubank, Prism, Cuvva, Earnin, N26, Matador, Honeydue, Penfold, Planto, Lemonade, SoFi, Personal Capital, YNAB, Qapital, Betterment, PayPal, Stash.
3. What are the main segments of the Fintech App?
The market segments include Application, Type.
4. Can you provide details about the market size?
The market size is estimated to be USD 395.38 billion as of 2022.
5. What are some drivers contributing to market growth?
N/A
6. What are the notable trends driving market growth?
N/A
7. Are there any restraints impacting market growth?
N/A
8. Can you provide examples of recent developments in the market?
N/A
9. What pricing options are available for accessing the report?
Pricing options include single-user, multi-user, and enterprise licenses priced at USD 3950.00, USD 5925.00, and USD 7900.00 respectively.
10. Is the market size provided in terms of value or volume?
The market size is provided in terms of value, measured in billion.
11. Are there any specific market keywords associated with the report?
Yes, the market keyword associated with the report is "Fintech App," which aids in identifying and referencing the specific market segment covered.
12. How do I determine which pricing option suits my needs best?
The pricing options vary based on user requirements and access needs. Individual users may opt for single-user licenses, while businesses requiring broader access may choose multi-user or enterprise licenses for cost-effective access to the report.
13. Are there any additional resources or data provided in the Fintech App report?
While the report offers comprehensive insights, it's advisable to review the specific contents or supplementary materials provided to ascertain if additional resources or data are available.
14. How can I stay updated on further developments or reports in the Fintech App?
To stay informed about further developments, trends, and reports in the Fintech App, consider subscribing to industry newsletters, following relevant companies and organizations, or regularly checking reputable industry news sources and publications.
Methodology
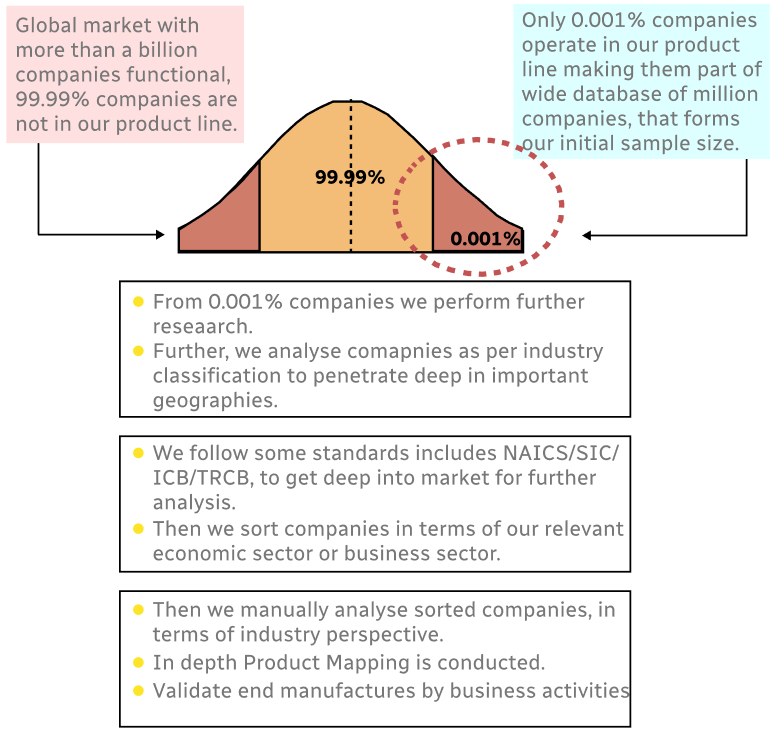
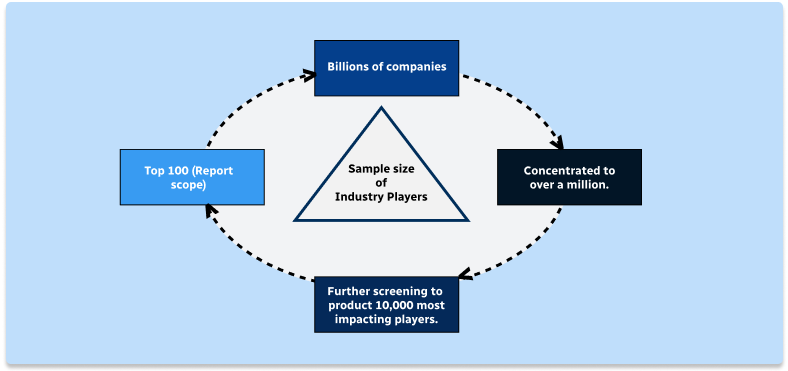
Step 1 - Identification of Relevant Samples Size from Population Database
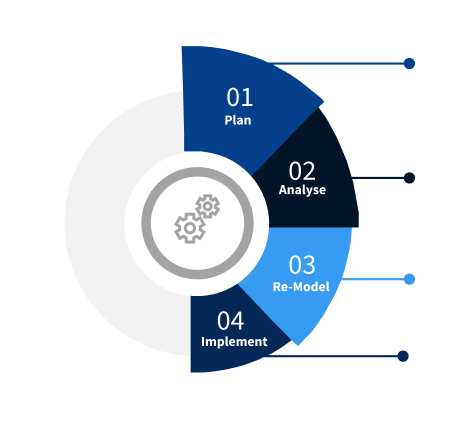
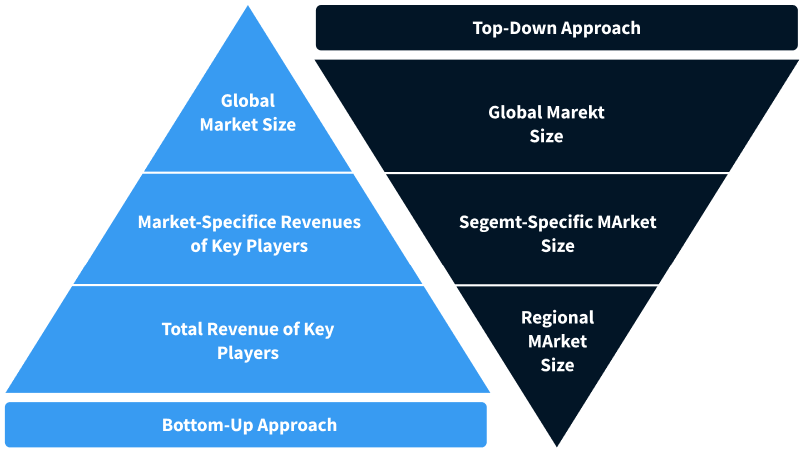
Step 2 - Approaches for Defining Global Market Size (Value, Volume* & Price*)
Note*: In applicable scenarios
Step 3 - Data Sources
Primary Research
- Web Analytics
- Survey Reports
- Research Institute
- Latest Research Reports
- Opinion Leaders
Secondary Research
- Annual Reports
- White Paper
- Latest Press Release
- Industry Association
- Paid Database
- Investor Presentations
Step 4 - Data Triangulation
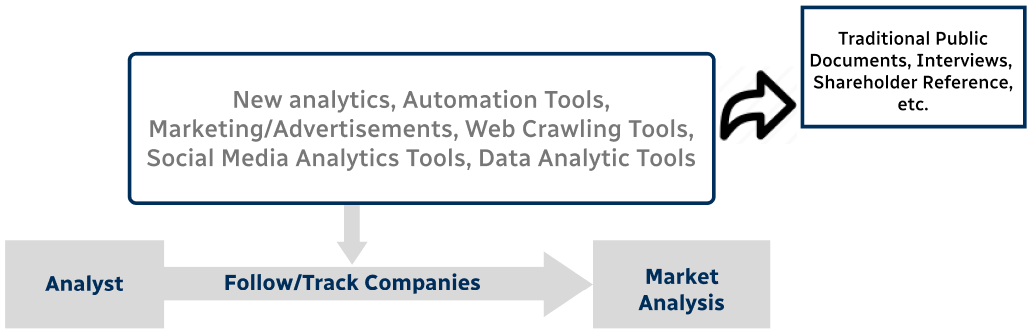
Involves using different sources of information in order to increase the validity of a study
These sources are likely to be stakeholders in a program - participants, other researchers, program staff, other community members, and so on.
Then we put all data in single framework & apply various statistical tools to find out the dynamic on the market.
During the analysis stage, feedback from the stakeholder groups would be compared to determine areas of agreement as well as areas of divergence