

Key Insights
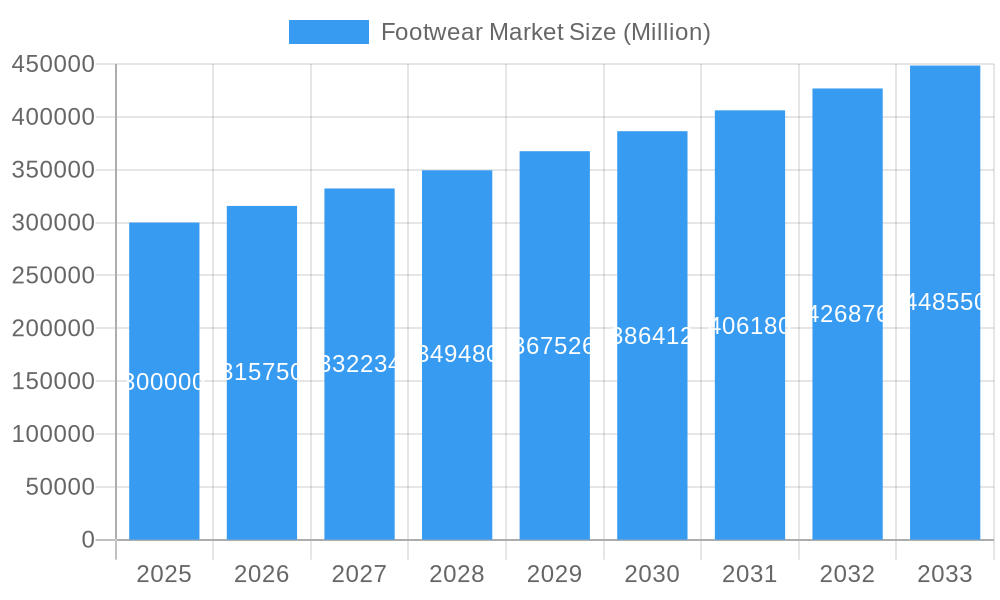
The global footwear market, projected to reach $495.46 billion by 2025, is anticipated to expand at a Compound Annual Growth Rate (CAGR) of 6.88% from 2025 to 2033. This growth trajectory is propelled by rising disposable incomes, particularly in emerging economies, driving demand for both athletic and non-athletic footwear. Evolving fashion trends, celebrity endorsements, and increased participation in sports and fitness activities also significantly influence consumer preferences. E-commerce platforms are crucial enablers, enhancing accessibility and convenience for a broad consumer base. Potential restraints include raw material price volatility, intense market competition, and economic fluctuations. The market is segmented by footwear type (athletic, non-athletic), end-user (men, women, children), and distribution channels (offline, online). Key industry players like Nike, Adidas, and Puma are engaged in continuous innovation in design, technology, and marketing.
Footwear Market Market Size (In Billion)
Regional analysis indicates that North America and Europe currently dominate the market, supported by mature consumer bases and strong brand recognition. However, the Asia-Pacific region is expected to witness substantial growth, driven by rapid economic development and an expanding middle class in key economies such as China and India. This region offers significant opportunities for footwear manufacturers due to its large population and increasing purchasing power. South America and the Middle East represent developing markets with notable growth potential, though economic conditions and consumer preferences will shape their expansion. Competition varies regionally, influenced by local brands, trade dynamics, and specific consumer demands for style and performance. The forecast period of 2025-2033 projects sustained market expansion, fueled by ongoing consumer trends and anticipated increases in global disposable income.
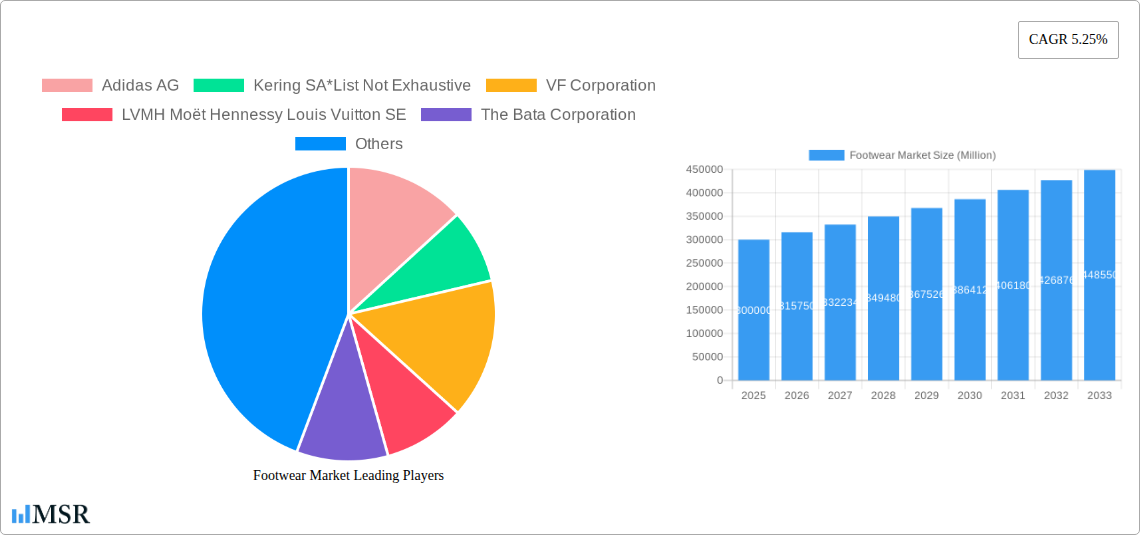
Footwear Market Company Market Share
Footwear Market Report: A Comprehensive Analysis (2019-2033)
This in-depth report provides a comprehensive analysis of the global footwear market, encompassing market dynamics, industry trends, key segments, leading players, and future growth opportunities. The study period covers 2019-2033, with 2025 as the base and estimated year. This report is invaluable for industry stakeholders, investors, and market researchers seeking actionable insights into this dynamic sector. The global footwear market size is projected to reach xx Million by 2033, exhibiting a CAGR of xx% during the forecast period (2025-2033).
Footwear Market Concentration & Dynamics
The global footwear market is characterized by a moderately concentrated structure, with a few dominant players controlling a significant market share. Nike Inc., Adidas AG, and Puma SE, among others, hold substantial market positions. However, the market also accommodates numerous smaller players and niche brands, fostering a dynamic competitive landscape. Market share fluctuations are influenced by factors such as product innovation, marketing strategies, and brand loyalty.
The footwear industry exhibits a robust innovation ecosystem driven by advancements in materials science, manufacturing processes, and design aesthetics. Regulatory frameworks, including those related to labor practices, environmental sustainability, and product safety, significantly impact the industry. Substitute products, such as minimalist footwear and customized options, continuously challenge traditional market offerings. Evolving consumer preferences, especially towards sustainable and ethically produced footwear, are shaping market demand.
Mergers and acquisitions (M&A) activities play a pivotal role in market consolidation and expansion. The number of M&A deals in the footwear industry fluctuated between xx and xx per year during the historical period (2019-2024), with an estimated xx deals in 2025. These transactions often involve strategic acquisitions of smaller brands by larger corporations to enhance product portfolios, expand market reach, and access new technologies.
- Market Share: Nike Inc. (xx%), Adidas AG (xx%), Puma SE (xx%), Others (xx%)
- M&A Deal Counts (2019-2024): Average xx per year.
- Estimated M&A Deals (2025): xx
Footwear Market Industry Insights & Trends
The global footwear market is experiencing significant growth, driven by several key factors. Rising disposable incomes, particularly in developing economies, are fueling increased demand for footwear. Changing lifestyles and increased participation in sports and fitness activities contribute to the growth of athletic footwear segments. E-commerce platforms have revolutionized footwear distribution, offering consumers greater convenience and wider choices.
Technological advancements, such as 3D printing and the use of innovative materials (e.g., recycled materials, bio-based materials), are transforming footwear design and manufacturing. Sustainability concerns are increasingly influencing consumer purchasing decisions, with a rising preference for eco-friendly footwear options. Furthermore, the increasing focus on personalized experiences is shaping the industry, leading to customized footwear solutions and data-driven product development.
Key Markets & Segments Leading Footwear Market
The North American and European regions currently dominate the global footwear market. However, the Asia-Pacific region is expected to witness robust growth in the coming years, fueled by rapid economic expansion and a burgeoning middle class.
Within footwear types, athletic footwear accounts for a larger market share compared to non-athletic footwear, primarily due to rising health consciousness and fitness trends. Men's footwear generally holds a slightly higher market share than women's and children's footwear, although the gap is narrowing as women's athletic footwear gains traction. Offline retail stores continue to dominate distribution channels, but online retail is gaining significant market share due to the convenience it offers.
- Dominant Region: North America
- Fastest-Growing Region: Asia-Pacific
- Largest Segment (Type): Athletic Footwear
- Largest Segment (End-User): Men
- Largest Segment (Distribution Channel): Offline Retail Stores
Drivers for Growth by Region:
- North America: Strong consumer spending, established retail infrastructure.
- Europe: Fashion-conscious consumers, high disposable incomes.
- Asia-Pacific: Rapid economic growth, rising middle class, increased participation in sports.
Footwear Market Product Developments
Recent years have witnessed significant product innovation within the footwear industry. Brands are incorporating advanced materials, such as graphene-enhanced soles for enhanced durability and comfort, and utilizing innovative manufacturing techniques, such as 3D knitting, for customized fits. Sustainable and ethically sourced materials are becoming increasingly important in new product development. This emphasis on innovation is shaping competitive landscapes, with brands competing on factors like sustainability, comfort, technological advancements, and design aesthetics.
Challenges in the Footwear Market Market
The footwear market faces several challenges, including fluctuating raw material prices, particularly for synthetic and natural materials. Supply chain disruptions, global trade policies, and increasing labor costs pose significant operational challenges. Intense competition from established and emerging brands necessitates continuous product innovation and efficient marketing strategies to maintain market share. Stringent environmental regulations and growing consumer demand for sustainable products present both challenges and opportunities.
Forces Driving Footwear Market Growth
Several factors are driving growth in the footwear market: increasing disposable incomes, expanding middle class in developing economies, growing interest in fitness and athletic activities, and the rise of e-commerce. Technological advancements in materials and manufacturing processes contribute to product innovation and consumer demand. Favorable government policies and infrastructure development in some regions also promote market growth.
Challenges in the Footwear Market Market
Long-term growth in the footwear market depends on addressing sustainability concerns through eco-friendly manufacturing and materials sourcing. Collaborations and partnerships with technology companies to drive innovation and improve manufacturing processes are crucial. Expanding into new markets and regions with potential for growth will be essential for long-term success.
Emerging Opportunities in Footwear Market
The increasing demand for personalized and customized footwear presents a significant opportunity for market expansion. Technological advancements in areas such as smart footwear and wearable technology create new avenues for growth. Focusing on sustainable and ethically produced footwear, catering to environmentally conscious consumers, will unlock new market segments.
Leading Players in the Footwear Market Sector
- Adidas AG
- Kering SA
- VF Corporation
- LVMH Moët Hennessy Louis Vuitton SE
- The Bata Corporation
- Fila Holdings Corp
- Asics Corporation
- Puma SE
- Nike Inc
- Under Armour
- New Balance Athletics Inc
Key Milestones in Footwear Market Industry
- September 2022: Asics Corporation launched the Novablast 3 running shoe, featuring a unique Origami design and advanced cushioning technology.
- September 2023: Nike Inc. introduced the Luka 2 basketball shoe collection, incorporating recycled materials and sustainable manufacturing processes.
- September 2023: Puma SA launched a new collection in collaboration with Rihanna under the Fenty x Puma line, featuring a football-inspired shoe made from vintage leather.
Strategic Outlook for Footwear Market Market
The footwear market is poised for continued growth, driven by factors like rising disposable incomes, technological advancements, and evolving consumer preferences. Companies focusing on innovation, sustainability, and personalized experiences will be best positioned to capitalize on future market opportunities. Strategic partnerships and collaborations will be crucial for navigating the evolving competitive landscape and ensuring long-term success.
Footwear Market Segmentation
-
1. Type
-
1.1. Athletic Footwear
- 1.1.1. Running Shoes
- 1.1.2. Sports Shoes
- 1.1.3. Trekking/Hiking Shoes
- 1.1.4. Other Athletic Footwear Types
-
1.2. Non-athletic Footwear
- 1.2.1. Boots
- 1.2.2. Flip-Flops/Slippers
- 1.2.3. Sneakers
- 1.2.4. Other Non-athletic Footwear
-
1.1. Athletic Footwear
-
2. End-User
- 2.1. Men
- 2.2. Women
- 2.3. Kids
-
3. Distribution Channel
- 3.1. Offline Retail Stores
- 3.2. Online Retail Stores
Footwear Market Segmentation By Geography
-
1. North America
- 1.1. United States
- 1.2. Canada
- 1.3. Mexico
- 1.4. Rest of North America
-
2. Europe
- 2.1. Germany
- 2.2. United Kingdom
- 2.3. France
- 2.4. Russia
- 2.5. Spain
- 2.6. Italy
- 2.7. Rest of Europe
-
3. Asia Pacific
- 3.1. China
- 3.2. Japan
- 3.3. India
- 3.4. Australia
- 3.5. Rest of Asia Pacific
-
4. South America
- 4.1. Brazil
- 4.2. Colombia
- 4.3. Rest of South America
- 5. Middle East
-
6. South Africa
- 6.1. Saudi Arabia
- 6.2. Rest of Middle East
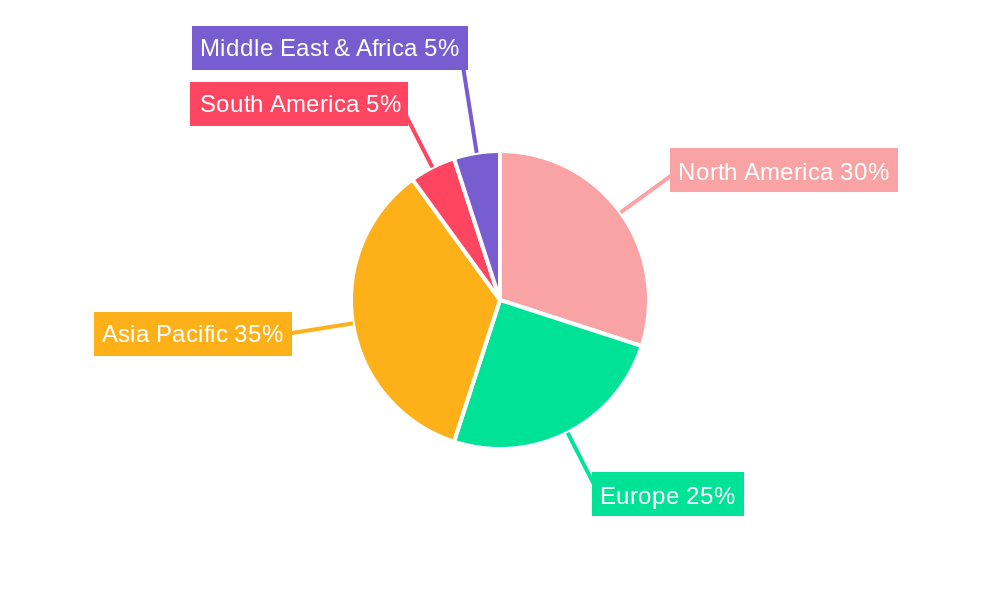
Footwear Market Regional Market Share
Geographic Coverage of Footwear Market
Footwear Market REPORT HIGHLIGHTS
| Aspects | Details |
|---|---|
| Study Period | 2020-2034 |
| Base Year | 2025 |
| Estimated Year | 2026 |
| Forecast Period | 2026-2034 |
| Historical Period | 2020-2025 |
| Growth Rate | CAGR of 6.88% from 2020-2034 |
| Segmentation |
|
Table of Contents
- 1. Introduction
- 1.1. Research Scope
- 1.2. Market Segmentation
- 1.3. Research Objective
- 1.4. Definitions and Assumptions
- 2. Executive Summary
- 2.1. Market Snapshot
- 3. Market Dynamics
- 3.1. Market Drivers
- 3.2. Market Restrains
- 3.3. Market Trends
- 3.4. Market Opportunities
- 4. Market Factor Analysis
- 4.1. Porters Five Forces
- 4.1.1. Bargaining Power of Suppliers
- 4.1.2. Bargaining Power of Buyers
- 4.1.3. Threat of New Entrants
- 4.1.4. Threat of Substitutes
- 4.1.5. Competitive Rivalry
- 4.2. PESTEL analysis
- 4.3. BCG Analysis
- 4.3.1. Stars (High Growth, High Market Share)
- 4.3.2. Cash Cows (Low Growth, High Market Share)
- 4.3.3. Question Mark (High Growth, Low Market Share)
- 4.3.4. Dogs (Low Growth, Low Market Share)
- 4.4. Ansoff Matrix Analysis
- 4.5. Supply Chain Analysis
- 4.6. Regulatory Landscape
- 4.7. Current Market Potential and Opportunity Assessment (TAM–SAM–SOM Framework)
- 4.8. MSR Analyst Note
- 4.1. Porters Five Forces
- 5. Market Analysis, Insights and Forecast 2021-2033
- 5.1. Market Analysis, Insights and Forecast - by Type
- 5.1.1. Athletic Footwear
- 5.1.1.1. Running Shoes
- 5.1.1.2. Sports Shoes
- 5.1.1.3. Trekking/Hiking Shoes
- 5.1.1.4. Other Athletic Footwear Types
- 5.1.2. Non-athletic Footwear
- 5.1.2.1. Boots
- 5.1.2.2. Flip-Flops/Slippers
- 5.1.2.3. Sneakers
- 5.1.2.4. Other Non-athletic Footwear
- 5.1.1. Athletic Footwear
- 5.2. Market Analysis, Insights and Forecast - by End-User
- 5.2.1. Men
- 5.2.2. Women
- 5.2.3. Kids
- 5.3. Market Analysis, Insights and Forecast - by Distribution Channel
- 5.3.1. Offline Retail Stores
- 5.3.2. Online Retail Stores
- 5.4. Market Analysis, Insights and Forecast - by Region
- 5.4.1. North America
- 5.4.2. Europe
- 5.4.3. Asia Pacific
- 5.4.4. South America
- 5.4.5. Middle East
- 5.4.6. South Africa
- 5.1. Market Analysis, Insights and Forecast - by Type
- 6. Global Footwear Market Analysis, Insights and Forecast, 2021-2033
- 6.1. Market Analysis, Insights and Forecast - by Type
- 6.1.1. Athletic Footwear
- 6.1.1.1. Running Shoes
- 6.1.1.2. Sports Shoes
- 6.1.1.3. Trekking/Hiking Shoes
- 6.1.1.4. Other Athletic Footwear Types
- 6.1.2. Non-athletic Footwear
- 6.1.2.1. Boots
- 6.1.2.2. Flip-Flops/Slippers
- 6.1.2.3. Sneakers
- 6.1.2.4. Other Non-athletic Footwear
- 6.1.1. Athletic Footwear
- 6.2. Market Analysis, Insights and Forecast - by End-User
- 6.2.1. Men
- 6.2.2. Women
- 6.2.3. Kids
- 6.3. Market Analysis, Insights and Forecast - by Distribution Channel
- 6.3.1. Offline Retail Stores
- 6.3.2. Online Retail Stores
- 6.1. Market Analysis, Insights and Forecast - by Type
- 7. North America Footwear Market Analysis, Insights and Forecast, 2020-2032
- 7.1. Market Analysis, Insights and Forecast - by Type
- 7.1.1. Athletic Footwear
- 7.1.1.1. Running Shoes
- 7.1.1.2. Sports Shoes
- 7.1.1.3. Trekking/Hiking Shoes
- 7.1.1.4. Other Athletic Footwear Types
- 7.1.2. Non-athletic Footwear
- 7.1.2.1. Boots
- 7.1.2.2. Flip-Flops/Slippers
- 7.1.2.3. Sneakers
- 7.1.2.4. Other Non-athletic Footwear
- 7.1.1. Athletic Footwear
- 7.2. Market Analysis, Insights and Forecast - by End-User
- 7.2.1. Men
- 7.2.2. Women
- 7.2.3. Kids
- 7.3. Market Analysis, Insights and Forecast - by Distribution Channel
- 7.3.1. Offline Retail Stores
- 7.3.2. Online Retail Stores
- 7.1. Market Analysis, Insights and Forecast - by Type
- 8. Europe Footwear Market Analysis, Insights and Forecast, 2020-2032
- 8.1. Market Analysis, Insights and Forecast - by Type
- 8.1.1. Athletic Footwear
- 8.1.1.1. Running Shoes
- 8.1.1.2. Sports Shoes
- 8.1.1.3. Trekking/Hiking Shoes
- 8.1.1.4. Other Athletic Footwear Types
- 8.1.2. Non-athletic Footwear
- 8.1.2.1. Boots
- 8.1.2.2. Flip-Flops/Slippers
- 8.1.2.3. Sneakers
- 8.1.2.4. Other Non-athletic Footwear
- 8.1.1. Athletic Footwear
- 8.2. Market Analysis, Insights and Forecast - by End-User
- 8.2.1. Men
- 8.2.2. Women
- 8.2.3. Kids
- 8.3. Market Analysis, Insights and Forecast - by Distribution Channel
- 8.3.1. Offline Retail Stores
- 8.3.2. Online Retail Stores
- 8.1. Market Analysis, Insights and Forecast - by Type
- 9. Asia Pacific Footwear Market Analysis, Insights and Forecast, 2020-2032
- 9.1. Market Analysis, Insights and Forecast - by Type
- 9.1.1. Athletic Footwear
- 9.1.1.1. Running Shoes
- 9.1.1.2. Sports Shoes
- 9.1.1.3. Trekking/Hiking Shoes
- 9.1.1.4. Other Athletic Footwear Types
- 9.1.2. Non-athletic Footwear
- 9.1.2.1. Boots
- 9.1.2.2. Flip-Flops/Slippers
- 9.1.2.3. Sneakers
- 9.1.2.4. Other Non-athletic Footwear
- 9.1.1. Athletic Footwear
- 9.2. Market Analysis, Insights and Forecast - by End-User
- 9.2.1. Men
- 9.2.2. Women
- 9.2.3. Kids
- 9.3. Market Analysis, Insights and Forecast - by Distribution Channel
- 9.3.1. Offline Retail Stores
- 9.3.2. Online Retail Stores
- 9.1. Market Analysis, Insights and Forecast - by Type
- 10. South America Footwear Market Analysis, Insights and Forecast, 2020-2032
- 10.1. Market Analysis, Insights and Forecast - by Type
- 10.1.1. Athletic Footwear
- 10.1.1.1. Running Shoes
- 10.1.1.2. Sports Shoes
- 10.1.1.3. Trekking/Hiking Shoes
- 10.1.1.4. Other Athletic Footwear Types
- 10.1.2. Non-athletic Footwear
- 10.1.2.1. Boots
- 10.1.2.2. Flip-Flops/Slippers
- 10.1.2.3. Sneakers
- 10.1.2.4. Other Non-athletic Footwear
- 10.1.1. Athletic Footwear
- 10.2. Market Analysis, Insights and Forecast - by End-User
- 10.2.1. Men
- 10.2.2. Women
- 10.2.3. Kids
- 10.3. Market Analysis, Insights and Forecast - by Distribution Channel
- 10.3.1. Offline Retail Stores
- 10.3.2. Online Retail Stores
- 10.1. Market Analysis, Insights and Forecast - by Type
- 11. Middle East Footwear Market Analysis, Insights and Forecast, 2020-2032
- 11.1. Market Analysis, Insights and Forecast - by Type
- 11.1.1. Athletic Footwear
- 11.1.1.1. Running Shoes
- 11.1.1.2. Sports Shoes
- 11.1.1.3. Trekking/Hiking Shoes
- 11.1.1.4. Other Athletic Footwear Types
- 11.1.2. Non-athletic Footwear
- 11.1.2.1. Boots
- 11.1.2.2. Flip-Flops/Slippers
- 11.1.2.3. Sneakers
- 11.1.2.4. Other Non-athletic Footwear
- 11.1.1. Athletic Footwear
- 11.2. Market Analysis, Insights and Forecast - by End-User
- 11.2.1. Men
- 11.2.2. Women
- 11.2.3. Kids
- 11.3. Market Analysis, Insights and Forecast - by Distribution Channel
- 11.3.1. Offline Retail Stores
- 11.3.2. Online Retail Stores
- 11.1. Market Analysis, Insights and Forecast - by Type
- 12. South Africa Footwear Market Analysis, Insights and Forecast, 2020-2032
- 12.1. Market Analysis, Insights and Forecast - by Type
- 12.1.1. Athletic Footwear
- 12.1.1.1. Running Shoes
- 12.1.1.2. Sports Shoes
- 12.1.1.3. Trekking/Hiking Shoes
- 12.1.1.4. Other Athletic Footwear Types
- 12.1.2. Non-athletic Footwear
- 12.1.2.1. Boots
- 12.1.2.2. Flip-Flops/Slippers
- 12.1.2.3. Sneakers
- 12.1.2.4. Other Non-athletic Footwear
- 12.1.1. Athletic Footwear
- 12.2. Market Analysis, Insights and Forecast - by End-User
- 12.2.1. Men
- 12.2.2. Women
- 12.2.3. Kids
- 12.3. Market Analysis, Insights and Forecast - by Distribution Channel
- 12.3.1. Offline Retail Stores
- 12.3.2. Online Retail Stores
- 12.1. Market Analysis, Insights and Forecast - by Type
- 13. Competitive Analysis
- 13.1. Company Profiles
- 13.1.1 Adidas AG
- 13.1.1.1. Company Overview
- 13.1.1.2. Products
- 13.1.1.3. Company Financials
- 13.1.1.4. SWOT Analysis
- 13.1.2 Kering SA*List Not Exhaustive
- 13.1.2.1. Company Overview
- 13.1.2.2. Products
- 13.1.2.3. Company Financials
- 13.1.2.4. SWOT Analysis
- 13.1.3 VF Corporation
- 13.1.3.1. Company Overview
- 13.1.3.2. Products
- 13.1.3.3. Company Financials
- 13.1.3.4. SWOT Analysis
- 13.1.4 LVMH Moët Hennessy Louis Vuitton SE
- 13.1.4.1. Company Overview
- 13.1.4.2. Products
- 13.1.4.3. Company Financials
- 13.1.4.4. SWOT Analysis
- 13.1.5 The Bata Corporation
- 13.1.5.1. Company Overview
- 13.1.5.2. Products
- 13.1.5.3. Company Financials
- 13.1.5.4. SWOT Analysis
- 13.1.6 Fila Holdings Corp
- 13.1.6.1. Company Overview
- 13.1.6.2. Products
- 13.1.6.3. Company Financials
- 13.1.6.4. SWOT Analysis
- 13.1.7 Asics Corporation
- 13.1.7.1. Company Overview
- 13.1.7.2. Products
- 13.1.7.3. Company Financials
- 13.1.7.4. SWOT Analysis
- 13.1.8 Puma SE
- 13.1.8.1. Company Overview
- 13.1.8.2. Products
- 13.1.8.3. Company Financials
- 13.1.8.4. SWOT Analysis
- 13.1.9 Nike Inc
- 13.1.9.1. Company Overview
- 13.1.9.2. Products
- 13.1.9.3. Company Financials
- 13.1.9.4. SWOT Analysis
- 13.1.10 Under Armour
- 13.1.10.1. Company Overview
- 13.1.10.2. Products
- 13.1.10.3. Company Financials
- 13.1.10.4. SWOT Analysis
- 13.1.11 New Balance Athletics Inc
- 13.1.11.1. Company Overview
- 13.1.11.2. Products
- 13.1.11.3. Company Financials
- 13.1.11.4. SWOT Analysis
- 13.1.1 Adidas AG
- 13.2. Market Entropy
- 13.2.1 Company's Key Areas Served
- 13.2.2 Recent Developments
- 13.3. Company Market Share Analysis 2025
- 13.3.1 Top 5 Companies Market Share Analysis
- 13.3.2 Top 3 Companies Market Share Analysis
- 13.4. List of Potential Customers
- 14. Research Methodology
List of Figures
- Figure 1: Global Footwear Market Revenue Breakdown (billion, %) by Region 2025 & 2033
- Figure 2: Global Footwear Market Volume Breakdown (K Units, %) by Region 2025 & 2033
- Figure 3: North America Footwear Market Revenue (billion), by Type 2025 & 2033
- Figure 4: North America Footwear Market Volume (K Units), by Type 2025 & 2033
- Figure 5: North America Footwear Market Revenue Share (%), by Type 2025 & 2033
- Figure 6: North America Footwear Market Volume Share (%), by Type 2025 & 2033
- Figure 7: North America Footwear Market Revenue (billion), by End-User 2025 & 2033
- Figure 8: North America Footwear Market Volume (K Units), by End-User 2025 & 2033
- Figure 9: North America Footwear Market Revenue Share (%), by End-User 2025 & 2033
- Figure 10: North America Footwear Market Volume Share (%), by End-User 2025 & 2033
- Figure 11: North America Footwear Market Revenue (billion), by Distribution Channel 2025 & 2033
- Figure 12: North America Footwear Market Volume (K Units), by Distribution Channel 2025 & 2033
- Figure 13: North America Footwear Market Revenue Share (%), by Distribution Channel 2025 & 2033
- Figure 14: North America Footwear Market Volume Share (%), by Distribution Channel 2025 & 2033
- Figure 15: North America Footwear Market Revenue (billion), by Country 2025 & 2033
- Figure 16: North America Footwear Market Volume (K Units), by Country 2025 & 2033
- Figure 17: North America Footwear Market Revenue Share (%), by Country 2025 & 2033
- Figure 18: North America Footwear Market Volume Share (%), by Country 2025 & 2033
- Figure 19: Europe Footwear Market Revenue (billion), by Type 2025 & 2033
- Figure 20: Europe Footwear Market Volume (K Units), by Type 2025 & 2033
- Figure 21: Europe Footwear Market Revenue Share (%), by Type 2025 & 2033
- Figure 22: Europe Footwear Market Volume Share (%), by Type 2025 & 2033
- Figure 23: Europe Footwear Market Revenue (billion), by End-User 2025 & 2033
- Figure 24: Europe Footwear Market Volume (K Units), by End-User 2025 & 2033
- Figure 25: Europe Footwear Market Revenue Share (%), by End-User 2025 & 2033
- Figure 26: Europe Footwear Market Volume Share (%), by End-User 2025 & 2033
- Figure 27: Europe Footwear Market Revenue (billion), by Distribution Channel 2025 & 2033
- Figure 28: Europe Footwear Market Volume (K Units), by Distribution Channel 2025 & 2033
- Figure 29: Europe Footwear Market Revenue Share (%), by Distribution Channel 2025 & 2033
- Figure 30: Europe Footwear Market Volume Share (%), by Distribution Channel 2025 & 2033
- Figure 31: Europe Footwear Market Revenue (billion), by Country 2025 & 2033
- Figure 32: Europe Footwear Market Volume (K Units), by Country 2025 & 2033
- Figure 33: Europe Footwear Market Revenue Share (%), by Country 2025 & 2033
- Figure 34: Europe Footwear Market Volume Share (%), by Country 2025 & 2033
- Figure 35: Asia Pacific Footwear Market Revenue (billion), by Type 2025 & 2033
- Figure 36: Asia Pacific Footwear Market Volume (K Units), by Type 2025 & 2033
- Figure 37: Asia Pacific Footwear Market Revenue Share (%), by Type 2025 & 2033
- Figure 38: Asia Pacific Footwear Market Volume Share (%), by Type 2025 & 2033
- Figure 39: Asia Pacific Footwear Market Revenue (billion), by End-User 2025 & 2033
- Figure 40: Asia Pacific Footwear Market Volume (K Units), by End-User 2025 & 2033
- Figure 41: Asia Pacific Footwear Market Revenue Share (%), by End-User 2025 & 2033
- Figure 42: Asia Pacific Footwear Market Volume Share (%), by End-User 2025 & 2033
- Figure 43: Asia Pacific Footwear Market Revenue (billion), by Distribution Channel 2025 & 2033
- Figure 44: Asia Pacific Footwear Market Volume (K Units), by Distribution Channel 2025 & 2033
- Figure 45: Asia Pacific Footwear Market Revenue Share (%), by Distribution Channel 2025 & 2033
- Figure 46: Asia Pacific Footwear Market Volume Share (%), by Distribution Channel 2025 & 2033
- Figure 47: Asia Pacific Footwear Market Revenue (billion), by Country 2025 & 2033
- Figure 48: Asia Pacific Footwear Market Volume (K Units), by Country 2025 & 2033
- Figure 49: Asia Pacific Footwear Market Revenue Share (%), by Country 2025 & 2033
- Figure 50: Asia Pacific Footwear Market Volume Share (%), by Country 2025 & 2033
- Figure 51: South America Footwear Market Revenue (billion), by Type 2025 & 2033
- Figure 52: South America Footwear Market Volume (K Units), by Type 2025 & 2033
- Figure 53: South America Footwear Market Revenue Share (%), by Type 2025 & 2033
- Figure 54: South America Footwear Market Volume Share (%), by Type 2025 & 2033
- Figure 55: South America Footwear Market Revenue (billion), by End-User 2025 & 2033
- Figure 56: South America Footwear Market Volume (K Units), by End-User 2025 & 2033
- Figure 57: South America Footwear Market Revenue Share (%), by End-User 2025 & 2033
- Figure 58: South America Footwear Market Volume Share (%), by End-User 2025 & 2033
- Figure 59: South America Footwear Market Revenue (billion), by Distribution Channel 2025 & 2033
- Figure 60: South America Footwear Market Volume (K Units), by Distribution Channel 2025 & 2033
- Figure 61: South America Footwear Market Revenue Share (%), by Distribution Channel 2025 & 2033
- Figure 62: South America Footwear Market Volume Share (%), by Distribution Channel 2025 & 2033
- Figure 63: South America Footwear Market Revenue (billion), by Country 2025 & 2033
- Figure 64: South America Footwear Market Volume (K Units), by Country 2025 & 2033
- Figure 65: South America Footwear Market Revenue Share (%), by Country 2025 & 2033
- Figure 66: South America Footwear Market Volume Share (%), by Country 2025 & 2033
- Figure 67: Middle East Footwear Market Revenue (billion), by Type 2025 & 2033
- Figure 68: Middle East Footwear Market Volume (K Units), by Type 2025 & 2033
- Figure 69: Middle East Footwear Market Revenue Share (%), by Type 2025 & 2033
- Figure 70: Middle East Footwear Market Volume Share (%), by Type 2025 & 2033
- Figure 71: Middle East Footwear Market Revenue (billion), by End-User 2025 & 2033
- Figure 72: Middle East Footwear Market Volume (K Units), by End-User 2025 & 2033
- Figure 73: Middle East Footwear Market Revenue Share (%), by End-User 2025 & 2033
- Figure 74: Middle East Footwear Market Volume Share (%), by End-User 2025 & 2033
- Figure 75: Middle East Footwear Market Revenue (billion), by Distribution Channel 2025 & 2033
- Figure 76: Middle East Footwear Market Volume (K Units), by Distribution Channel 2025 & 2033
- Figure 77: Middle East Footwear Market Revenue Share (%), by Distribution Channel 2025 & 2033
- Figure 78: Middle East Footwear Market Volume Share (%), by Distribution Channel 2025 & 2033
- Figure 79: Middle East Footwear Market Revenue (billion), by Country 2025 & 2033
- Figure 80: Middle East Footwear Market Volume (K Units), by Country 2025 & 2033
- Figure 81: Middle East Footwear Market Revenue Share (%), by Country 2025 & 2033
- Figure 82: Middle East Footwear Market Volume Share (%), by Country 2025 & 2033
- Figure 83: South Africa Footwear Market Revenue (billion), by Type 2025 & 2033
- Figure 84: South Africa Footwear Market Volume (K Units), by Type 2025 & 2033
- Figure 85: South Africa Footwear Market Revenue Share (%), by Type 2025 & 2033
- Figure 86: South Africa Footwear Market Volume Share (%), by Type 2025 & 2033
- Figure 87: South Africa Footwear Market Revenue (billion), by End-User 2025 & 2033
- Figure 88: South Africa Footwear Market Volume (K Units), by End-User 2025 & 2033
- Figure 89: South Africa Footwear Market Revenue Share (%), by End-User 2025 & 2033
- Figure 90: South Africa Footwear Market Volume Share (%), by End-User 2025 & 2033
- Figure 91: South Africa Footwear Market Revenue (billion), by Distribution Channel 2025 & 2033
- Figure 92: South Africa Footwear Market Volume (K Units), by Distribution Channel 2025 & 2033
- Figure 93: South Africa Footwear Market Revenue Share (%), by Distribution Channel 2025 & 2033
- Figure 94: South Africa Footwear Market Volume Share (%), by Distribution Channel 2025 & 2033
- Figure 95: South Africa Footwear Market Revenue (billion), by Country 2025 & 2033
- Figure 96: South Africa Footwear Market Volume (K Units), by Country 2025 & 2033
- Figure 97: South Africa Footwear Market Revenue Share (%), by Country 2025 & 2033
- Figure 98: South Africa Footwear Market Volume Share (%), by Country 2025 & 2033
List of Tables
- Table 1: Global Footwear Market Revenue billion Forecast, by Type 2020 & 2033
- Table 2: Global Footwear Market Volume K Units Forecast, by Type 2020 & 2033
- Table 3: Global Footwear Market Revenue billion Forecast, by End-User 2020 & 2033
- Table 4: Global Footwear Market Volume K Units Forecast, by End-User 2020 & 2033
- Table 5: Global Footwear Market Revenue billion Forecast, by Distribution Channel 2020 & 2033
- Table 6: Global Footwear Market Volume K Units Forecast, by Distribution Channel 2020 & 2033
- Table 7: Global Footwear Market Revenue billion Forecast, by Region 2020 & 2033
- Table 8: Global Footwear Market Volume K Units Forecast, by Region 2020 & 2033
- Table 9: Global Footwear Market Revenue billion Forecast, by Type 2020 & 2033
- Table 10: Global Footwear Market Volume K Units Forecast, by Type 2020 & 2033
- Table 11: Global Footwear Market Revenue billion Forecast, by End-User 2020 & 2033
- Table 12: Global Footwear Market Volume K Units Forecast, by End-User 2020 & 2033
- Table 13: Global Footwear Market Revenue billion Forecast, by Distribution Channel 2020 & 2033
- Table 14: Global Footwear Market Volume K Units Forecast, by Distribution Channel 2020 & 2033
- Table 15: Global Footwear Market Revenue billion Forecast, by Country 2020 & 2033
- Table 16: Global Footwear Market Volume K Units Forecast, by Country 2020 & 2033
- Table 17: United States Footwear Market Revenue (billion) Forecast, by Application 2020 & 2033
- Table 18: United States Footwear Market Volume (K Units) Forecast, by Application 2020 & 2033
- Table 19: Canada Footwear Market Revenue (billion) Forecast, by Application 2020 & 2033
- Table 20: Canada Footwear Market Volume (K Units) Forecast, by Application 2020 & 2033
- Table 21: Mexico Footwear Market Revenue (billion) Forecast, by Application 2020 & 2033
- Table 22: Mexico Footwear Market Volume (K Units) Forecast, by Application 2020 & 2033
- Table 23: Rest of North America Footwear Market Revenue (billion) Forecast, by Application 2020 & 2033
- Table 24: Rest of North America Footwear Market Volume (K Units) Forecast, by Application 2020 & 2033
- Table 25: Global Footwear Market Revenue billion Forecast, by Type 2020 & 2033
- Table 26: Global Footwear Market Volume K Units Forecast, by Type 2020 & 2033
- Table 27: Global Footwear Market Revenue billion Forecast, by End-User 2020 & 2033
- Table 28: Global Footwear Market Volume K Units Forecast, by End-User 2020 & 2033
- Table 29: Global Footwear Market Revenue billion Forecast, by Distribution Channel 2020 & 2033
- Table 30: Global Footwear Market Volume K Units Forecast, by Distribution Channel 2020 & 2033
- Table 31: Global Footwear Market Revenue billion Forecast, by Country 2020 & 2033
- Table 32: Global Footwear Market Volume K Units Forecast, by Country 2020 & 2033
- Table 33: Germany Footwear Market Revenue (billion) Forecast, by Application 2020 & 2033
- Table 34: Germany Footwear Market Volume (K Units) Forecast, by Application 2020 & 2033
- Table 35: United Kingdom Footwear Market Revenue (billion) Forecast, by Application 2020 & 2033
- Table 36: United Kingdom Footwear Market Volume (K Units) Forecast, by Application 2020 & 2033
- Table 37: France Footwear Market Revenue (billion) Forecast, by Application 2020 & 2033
- Table 38: France Footwear Market Volume (K Units) Forecast, by Application 2020 & 2033
- Table 39: Russia Footwear Market Revenue (billion) Forecast, by Application 2020 & 2033
- Table 40: Russia Footwear Market Volume (K Units) Forecast, by Application 2020 & 2033
- Table 41: Spain Footwear Market Revenue (billion) Forecast, by Application 2020 & 2033
- Table 42: Spain Footwear Market Volume (K Units) Forecast, by Application 2020 & 2033
- Table 43: Italy Footwear Market Revenue (billion) Forecast, by Application 2020 & 2033
- Table 44: Italy Footwear Market Volume (K Units) Forecast, by Application 2020 & 2033
- Table 45: Rest of Europe Footwear Market Revenue (billion) Forecast, by Application 2020 & 2033
- Table 46: Rest of Europe Footwear Market Volume (K Units) Forecast, by Application 2020 & 2033
- Table 47: Global Footwear Market Revenue billion Forecast, by Type 2020 & 2033
- Table 48: Global Footwear Market Volume K Units Forecast, by Type 2020 & 2033
- Table 49: Global Footwear Market Revenue billion Forecast, by End-User 2020 & 2033
- Table 50: Global Footwear Market Volume K Units Forecast, by End-User 2020 & 2033
- Table 51: Global Footwear Market Revenue billion Forecast, by Distribution Channel 2020 & 2033
- Table 52: Global Footwear Market Volume K Units Forecast, by Distribution Channel 2020 & 2033
- Table 53: Global Footwear Market Revenue billion Forecast, by Country 2020 & 2033
- Table 54: Global Footwear Market Volume K Units Forecast, by Country 2020 & 2033
- Table 55: China Footwear Market Revenue (billion) Forecast, by Application 2020 & 2033
- Table 56: China Footwear Market Volume (K Units) Forecast, by Application 2020 & 2033
- Table 57: Japan Footwear Market Revenue (billion) Forecast, by Application 2020 & 2033
- Table 58: Japan Footwear Market Volume (K Units) Forecast, by Application 2020 & 2033
- Table 59: India Footwear Market Revenue (billion) Forecast, by Application 2020 & 2033
- Table 60: India Footwear Market Volume (K Units) Forecast, by Application 2020 & 2033
- Table 61: Australia Footwear Market Revenue (billion) Forecast, by Application 2020 & 2033
- Table 62: Australia Footwear Market Volume (K Units) Forecast, by Application 2020 & 2033
- Table 63: Rest of Asia Pacific Footwear Market Revenue (billion) Forecast, by Application 2020 & 2033
- Table 64: Rest of Asia Pacific Footwear Market Volume (K Units) Forecast, by Application 2020 & 2033
- Table 65: Global Footwear Market Revenue billion Forecast, by Type 2020 & 2033
- Table 66: Global Footwear Market Volume K Units Forecast, by Type 2020 & 2033
- Table 67: Global Footwear Market Revenue billion Forecast, by End-User 2020 & 2033
- Table 68: Global Footwear Market Volume K Units Forecast, by End-User 2020 & 2033
- Table 69: Global Footwear Market Revenue billion Forecast, by Distribution Channel 2020 & 2033
- Table 70: Global Footwear Market Volume K Units Forecast, by Distribution Channel 2020 & 2033
- Table 71: Global Footwear Market Revenue billion Forecast, by Country 2020 & 2033
- Table 72: Global Footwear Market Volume K Units Forecast, by Country 2020 & 2033
- Table 73: Brazil Footwear Market Revenue (billion) Forecast, by Application 2020 & 2033
- Table 74: Brazil Footwear Market Volume (K Units) Forecast, by Application 2020 & 2033
- Table 75: Colombia Footwear Market Revenue (billion) Forecast, by Application 2020 & 2033
- Table 76: Colombia Footwear Market Volume (K Units) Forecast, by Application 2020 & 2033
- Table 77: Rest of South America Footwear Market Revenue (billion) Forecast, by Application 2020 & 2033
- Table 78: Rest of South America Footwear Market Volume (K Units) Forecast, by Application 2020 & 2033
- Table 79: Global Footwear Market Revenue billion Forecast, by Type 2020 & 2033
- Table 80: Global Footwear Market Volume K Units Forecast, by Type 2020 & 2033
- Table 81: Global Footwear Market Revenue billion Forecast, by End-User 2020 & 2033
- Table 82: Global Footwear Market Volume K Units Forecast, by End-User 2020 & 2033
- Table 83: Global Footwear Market Revenue billion Forecast, by Distribution Channel 2020 & 2033
- Table 84: Global Footwear Market Volume K Units Forecast, by Distribution Channel 2020 & 2033
- Table 85: Global Footwear Market Revenue billion Forecast, by Country 2020 & 2033
- Table 86: Global Footwear Market Volume K Units Forecast, by Country 2020 & 2033
- Table 87: Global Footwear Market Revenue billion Forecast, by Type 2020 & 2033
- Table 88: Global Footwear Market Volume K Units Forecast, by Type 2020 & 2033
- Table 89: Global Footwear Market Revenue billion Forecast, by End-User 2020 & 2033
- Table 90: Global Footwear Market Volume K Units Forecast, by End-User 2020 & 2033
- Table 91: Global Footwear Market Revenue billion Forecast, by Distribution Channel 2020 & 2033
- Table 92: Global Footwear Market Volume K Units Forecast, by Distribution Channel 2020 & 2033
- Table 93: Global Footwear Market Revenue billion Forecast, by Country 2020 & 2033
- Table 94: Global Footwear Market Volume K Units Forecast, by Country 2020 & 2033
- Table 95: Saudi Arabia Footwear Market Revenue (billion) Forecast, by Application 2020 & 2033
- Table 96: Saudi Arabia Footwear Market Volume (K Units) Forecast, by Application 2020 & 2033
- Table 97: Rest of Middle East Footwear Market Revenue (billion) Forecast, by Application 2020 & 2033
- Table 98: Rest of Middle East Footwear Market Volume (K Units) Forecast, by Application 2020 & 2033
Frequently Asked Questions
1. What is the projected Compound Annual Growth Rate (CAGR) of the Footwear Market?
The projected CAGR is approximately 6.88%.
2. Which companies are prominent players in the Footwear Market?
Key companies in the market include Adidas AG, Kering SA*List Not Exhaustive, VF Corporation, LVMH Moët Hennessy Louis Vuitton SE, The Bata Corporation, Fila Holdings Corp, Asics Corporation, Puma SE, Nike Inc, Under Armour, New Balance Athletics Inc.
3. What are the main segments of the Footwear Market?
The market segments include Type, End-User, Distribution Channel.
4. Can you provide details about the market size?
The market size is estimated to be USD 495.46 billion as of 2022.
5. What are some drivers contributing to market growth?
Surging Demand for Athleisure Footwear; Aggressive Marketing by Brands.
6. What are the notable trends driving market growth?
Potential Increase in Demand for the Athletic Footwear Segment.
7. Are there any restraints impacting market growth?
Extensive Availability of Counterfeit Products.
8. Can you provide examples of recent developments in the market?
September 2023: Puma SA unveiled an exciting collaboration with the renowned pop sensation Rihanna, marking the launch of their latest collection of athletic footwear and sportswear under the exclusive Fenty * Puma product line. The standout piece within this collection is a football-inspired shoe, drawing inspiration from the avant-garde, boasting a distinct football trend design, and crafted from sumptuously soft vintage leather.
9. What pricing options are available for accessing the report?
Pricing options include single-user, multi-user, and enterprise licenses priced at USD 3800, USD 4500, and USD 5800 respectively.
10. Is the market size provided in terms of value or volume?
The market size is provided in terms of value, measured in billion and volume, measured in K Units.
11. Are there any specific market keywords associated with the report?
Yes, the market keyword associated with the report is "Footwear Market," which aids in identifying and referencing the specific market segment covered.
12. How do I determine which pricing option suits my needs best?
The pricing options vary based on user requirements and access needs. Individual users may opt for single-user licenses, while businesses requiring broader access may choose multi-user or enterprise licenses for cost-effective access to the report.
13. Are there any additional resources or data provided in the Footwear Market report?
While the report offers comprehensive insights, it's advisable to review the specific contents or supplementary materials provided to ascertain if additional resources or data are available.
14. How can I stay updated on further developments or reports in the Footwear Market?
To stay informed about further developments, trends, and reports in the Footwear Market, consider subscribing to industry newsletters, following relevant companies and organizations, or regularly checking reputable industry news sources and publications.
Methodology
Step 1 - Identification of Relevant Samples Size from Population Database


Step 2 - Approaches for Defining Global Market Size (Value, Volume* & Price*)

Note*: In applicable scenarios
Step 3 - Data Sources
Primary Research
- Web Analytics
- Survey Reports
- Research Institute
- Latest Research Reports
- Opinion Leaders
Secondary Research
- Annual Reports
- White Paper
- Latest Press Release
- Industry Association
- Paid Database
- Investor Presentations

Step 4 - Data Triangulation
Involves using different sources of information in order to increase the validity of a study
These sources are likely to be stakeholders in a program - participants, other researchers, program staff, other community members, and so on.
Then we put all data in single framework & apply various statistical tools to find out the dynamic on the market.
During the analysis stage, feedback from the stakeholder groups would be compared to determine areas of agreement as well as areas of divergence