

Key Insights
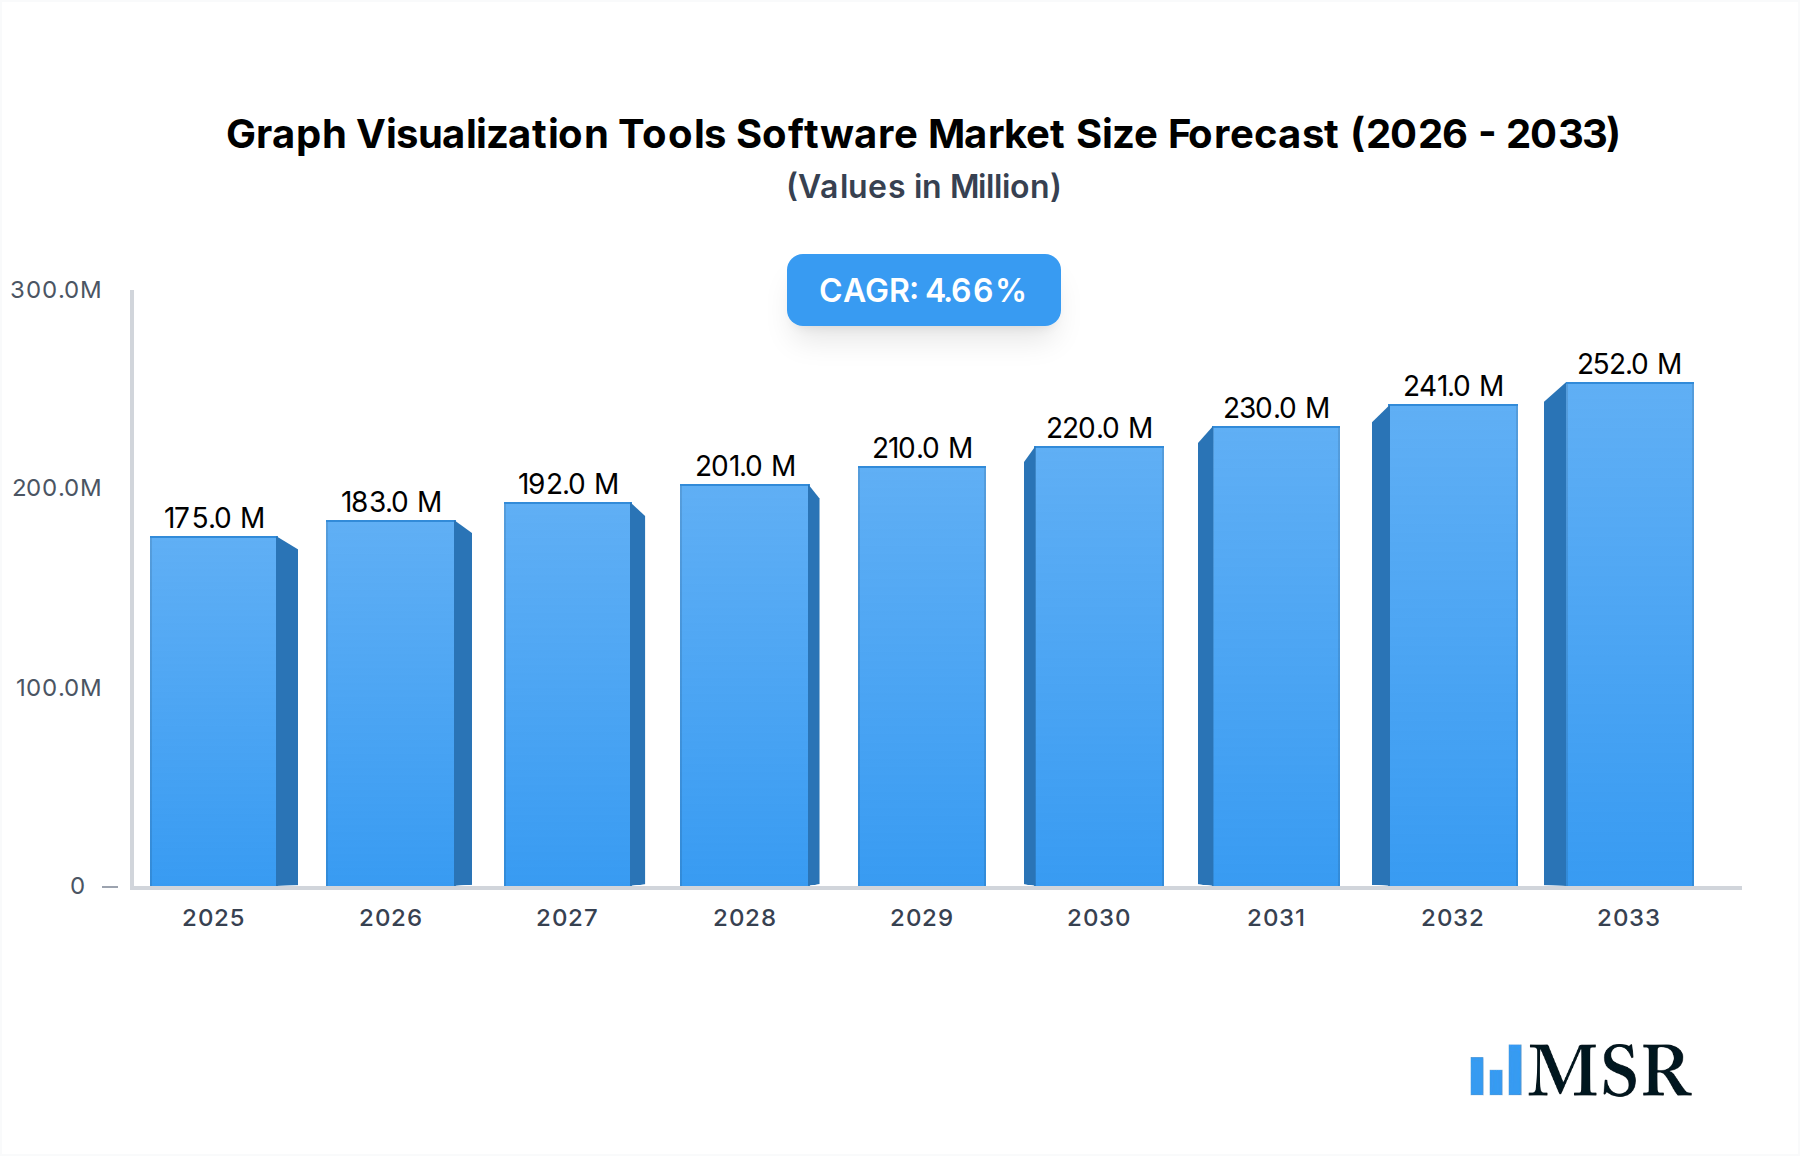
The Graph Visualization Tools Software market is poised for significant expansion, projected to reach $175 million by 2025, exhibiting a robust Compound Annual Growth Rate (CAGR) of 4.8% during the forecast period of 2025-2033. This growth is fundamentally driven by the increasing need for businesses to decipher complex relationships within their data, moving beyond traditional tabular formats to gain deeper insights. Key drivers include the escalating volume of Big Data, the growing adoption of advanced analytics, and the rising demand for interactive data exploration tools across various industries. The trend towards visual data storytelling and the critical role of graph analytics in areas like fraud detection, network analysis, and customer journey mapping are further accelerating market penetration. Moreover, the integration of AI and machine learning within graph visualization platforms is enhancing their analytical capabilities, making them indispensable for informed decision-making.

Graph Visualization Tools Software Market Size (In Million)
Despite the promising outlook, certain restraints could temper the growth trajectory. The initial cost of implementing sophisticated graph visualization solutions and the scarcity of skilled professionals capable of leveraging these tools effectively present challenges. Furthermore, data privacy concerns and the complexity of integrating graph databases with existing enterprise systems can act as barriers to widespread adoption, particularly for Small and Medium-sized Enterprises (SMEs). However, the market is actively addressing these issues through the development of more user-friendly interfaces, cloud-based solutions that reduce upfront investment, and an increasing emphasis on training and support. The market is segmented by application, with Large Enterprises and SMEs being key beneficiaries, and by deployment type, where Cloud-based solutions are gaining considerable traction due to their scalability and cost-effectiveness, signaling a dynamic and evolving landscape for graph visualization tools.
Graph Visualization Tools Software Company Market Share
Unveiling the Power of Connections: Graph Visualization Tools Software Market Report (2019–2033)
This comprehensive report offers an in-depth analysis of the Graph Visualization Tools Software market, projecting a dynamic growth trajectory from 2019 to 2033. With a base year of 2025 and an estimated year of 2025, this study provides critical insights for industry stakeholders navigating the evolving landscape of data visualization. Our forecast period (2025–2033) details the anticipated market expansion, building upon the historical period (2019–2024). We explore the intricate web of graph database visualization, network analysis software, and interactive graph visualization solutions that are revolutionizing how businesses understand complex relationships.
Graph Visualization Tools Software Market Concentration & Dynamics
The graph visualization tools software market exhibits a moderate to high level of concentration, driven by a mix of established players and innovative startups. The innovation ecosystem is vibrant, with companies continuously pushing the boundaries of visual analytics, big data visualization, and real-time graph rendering. Regulatory frameworks, while not overly restrictive, often touch upon data privacy and security, influencing the development and deployment of solutions, especially for sensitive industries. Substitute products, such as traditional 2D charts and dashboards, are gradually being augmented or replaced by the superior relational insights offered by graph visualization. End-user trends are rapidly shifting towards data-driven decision-making, demanding more intuitive and powerful tools for exploring complex datasets. Merger and acquisition (M&A) activities are a significant indicator of market dynamism, with an estimated XX M&A deals recorded during the historical period, fostering consolidation and strategic expansion. Companies are actively seeking to acquire innovative technologies and expand their market reach through strategic partnerships. The market share distribution is varied, with a few dominant players holding substantial portions, while a long tail of niche providers cater to specific industry needs.
Graph Visualization Tools Software Industry Insights & Trends
The graph visualization tools software market is experiencing robust growth, projected to reach a substantial market size of over $XX million by 2025, with a Compound Annual Growth Rate (CAGR) of XX% anticipated during the forecast period. This expansion is fueled by a confluence of technological advancements and increasing reliance on data-driven decision-making across all sectors. The proliferation of complex datasets, from social networks and supply chains to financial transactions and cybersecurity threats, necessitates sophisticated tools that can effectively represent and analyze these intricate relationships. Interactive graph visualization, real-time data visualization, and network graph analysis are no longer niche functionalities but are becoming core requirements for businesses seeking a competitive edge.
Key market growth drivers include the rising adoption of graph databases and the demand for advanced network analysis software in fields like fraud detection, cybersecurity, and customer 360 initiatives. Furthermore, the integration of Artificial Intelligence (AI) and Machine Learning (ML) within graph visualization platforms is unlocking new possibilities for predictive analytics and automated insights, significantly enhancing the value proposition. The trend towards cloud-based graph visualization solutions continues to accelerate, offering scalability, accessibility, and cost-effectiveness, particularly for Small and Medium-sized Enterprises (SMEs). However, the increasing sophistication of these tools also presents a challenge, requiring skilled professionals to leverage their full potential.
Technological disruptions are primarily centered around enhancing performance, usability, and the depth of analysis. Innovations in rendering technologies are enabling the visualization of colossal graphs with millions of nodes and edges, while advancements in user interface (UI) and user experience (UX) design are making these powerful tools more accessible to a broader audience. Evolving consumer behaviors are characterized by a growing expectation for immediate, actionable insights derived directly from data. This translates into a demand for dynamic graph visualization and real-time dashboards that can adapt to changing conditions and highlight critical patterns. The shift from static reporting to interactive exploration is a defining trend, pushing vendors to develop more agile and user-friendly platforms. The increasing emphasis on link analysis software and relationship mapping tools underscores the market's maturation and its pivotal role in understanding interconnected systems.
Key Markets & Segments Leading Graph Visualization Tools Software
The Graph Visualization Tools Software market is witnessing significant traction across various geographical regions and industry segments. Dominance is observed in regions characterized by a high concentration of technology adoption and robust digital infrastructure, with North America and Europe leading the charge. The United States, in particular, stands out due to its strong presence of large enterprises and a thriving startup ecosystem investing heavily in advanced analytics and data science.
Application Segments Dominance:
Large Enterprises: These organizations are the primary drivers of market growth, leveraging graph visualization for complex use cases such as fraud detection, cybersecurity, supply chain optimization, and customer analytics. The sheer volume and complexity of data generated by large enterprises necessitate sophisticated relationship visualization and network analysis tools. Their significant IT budgets and established data governance frameworks allow for the adoption of advanced solutions, including both cloud-based graph visualization and sophisticated on-premise graph visualization deployments. The need for comprehensive entity resolution and knowledge graph visualization further solidifies their position as key consumers.
- Drivers:
- Need for advanced fraud detection and prevention strategies.
- Increasingly complex cybersecurity threats requiring detailed network mapping.
- Demand for enhanced customer 360-degree views and personalized experiences.
- Optimization of intricate global supply chains.
- Leveraging AI/ML for predictive analytics on interconnected data.
- Drivers:
SMEs (Small and Medium-sized Enterprises): While historically lagging behind large enterprises, SMEs are increasingly adopting graph visualization tools, particularly cloud-based solutions, due to their cost-effectiveness and scalability. The growing awareness of the benefits of understanding relationships within their data, from customer interactions to operational workflows, is driving this adoption. Interactive graph visualization and network mapping software are empowering SMEs to compete more effectively by unlocking hidden insights previously accessible only to larger organizations.
- Drivers:
- Cost-effective scalability of cloud-based graph visualization.
- Democratization of advanced data analytics capabilities.
- Need to understand customer behavior and optimize marketing efforts.
- Improving operational efficiency through process mapping.
- Growing availability of user-friendly, no-code/low-code graph visualization platforms.
- Drivers:
Type Segments Dominance:
Cloud-based: This segment is experiencing exponential growth, driven by the inherent advantages of flexibility, accessibility, and reduced upfront investment. Businesses of all sizes are migrating towards SaaS graph visualization offerings, enabling them to scale their operations seamlessly and access cutting-edge features without the burden of extensive IT infrastructure management. The ease of deployment and integration with existing cloud ecosystems further bolsters its dominance.
- Drivers:
- Reduced IT infrastructure costs and maintenance.
- Enhanced scalability and flexibility to adapt to changing data volumes.
- Improved accessibility for remote and distributed teams.
- Faster deployment and time-to-value.
- Seamless integration with other cloud-based services.
- Drivers:
On-premise: While the cloud segment is growing faster, on-premise graph visualization remains critical for organizations with stringent data security and compliance requirements, particularly in government, defense, and highly regulated industries. These solutions offer maximum control over data and infrastructure. The need for highly customized deployments and integration with legacy systems also supports the continued relevance of on-premise solutions.
- Drivers:
- Strict data security and regulatory compliance requirements.
- Complete control over data and infrastructure.
- Integration with existing on-premise IT environments and legacy systems.
- Customization needs for highly specialized applications.
- Drivers:
Graph Visualization Tools Software Product Developments
Product developments in the graph visualization tools software sector are characterized by a strong emphasis on enhancing interactive graph visualization capabilities, improving performance for large-scale datasets, and integrating advanced AI/ML functionalities. Innovations include more intuitive user interfaces for easier network exploration, real-time rendering engines for dynamic data updates, and sophisticated algorithms for relationship discovery and pattern recognition. Companies are also focusing on cross-platform compatibility and seamless integration with a wider array of data sources, including various graph databases and traditional data warehouses. The market relevance is driven by the increasing demand for actionable insights derived from complex, interconnected data, making these tools indispensable for fields like cybersecurity, fraud detection, and scientific research.
Challenges in the Graph Visualization Tools Software Market
Despite its promising growth, the graph visualization tools software market faces several challenges. A significant barrier is the steep learning curve associated with advanced graph analytics, often requiring specialized skills and expertise, which can limit adoption for SMEs. Data integration complexities with diverse data sources and existing IT infrastructures can also pose hurdles, leading to extended implementation times and increased costs. Furthermore, concerns around data privacy and security, particularly for sensitive information, necessitate robust solutions and compliance adherence, adding to development and operational overhead. Competitive pressures from numerous vendors offering overlapping functionalities also drive price sensitivity and demand for demonstrable ROI.
Forces Driving Graph Visualization Tools Software Growth
Several key forces are propelling the growth of the graph visualization tools software market. The exponential increase in big data and the growing recognition of its value are paramount. As organizations generate and collect more interconnected data, the need for effective tools to understand these relationships becomes critical. Technological advancements, including the maturation of graph databases, the development of more efficient rendering engines, and the integration of AI/ML, are making graph visualization more powerful and accessible. The increasing demand for advanced analytics in critical sectors like cybersecurity, fraud detection, financial services, and supply chain management is a significant catalyst. Furthermore, the growing emphasis on data-driven decision-making and the quest for competitive advantage are pushing businesses to invest in solutions that offer deeper insights into complex interdependencies.
Challenges in the Graph Visualization Tools Software Market
Long-term growth catalysts for the graph visualization tools software market lie in continuous innovation and strategic market expansion. The development of more sophisticated AI-powered insights and predictive capabilities will further embed these tools into core business processes. Increased focus on user-friendliness and the creation of no-code/low-code visualization platforms will democratize access and drive broader adoption across different skill sets. Strategic partnerships with cloud providers and data integration specialists will streamline deployment and enhance interoperability. Furthermore, exploring emerging markets and niche industry applications beyond the traditional sectors will unlock new revenue streams and solidify the market's widespread impact.
Emerging Opportunities in Graph Visualization Tools Software
Emerging opportunities in the graph visualization tools software market are abundant, driven by evolving technological landscapes and new application frontiers. The burgeoning field of knowledge graph creation and management presents a significant avenue for growth, as organizations seek to build interconnected repositories of information. The integration of explainable AI (XAI) with graph visualizations offers a powerful way to understand complex model decisions, enhancing trust and transparency. Furthermore, the expanding use of graph visualization in the Internet of Things (IoT) for monitoring and analyzing interconnected device data, as well as its application in biotechnology and drug discovery for understanding molecular interactions, represent substantial untapped potential. The growing demand for real-time anomaly detection in dynamic environments also provides a fertile ground for innovative solutions.
Leading Players in the Graph Visualization Tools Software Sector
- Graphviz
- AntV
- Arcade Analytics
- Cytospace
- Gephi
- GoJS
- Graphistry
- i2 Analyze
- Linkurious
- Maltego Graph
- Quantexa
- Tom Sawyer Explorations
- ZoomCharts
Key Milestones in Graph Visualization Tools Software Industry
- 2019: Significant advancements in rendering technologies enabling visualization of larger and more complex graphs.
- 2020: Increased adoption of cloud-based graph visualization solutions by SMEs, driven by scalability and cost-effectiveness.
- 2021: Integration of AI/ML capabilities for automated insight generation and predictive analytics within graph visualization platforms.
- 2022: Rise of open-source graph visualization libraries and frameworks, fostering community-driven innovation.
- 2023: Growing demand for specialized graph visualization tools in cybersecurity and fraud detection applications.
- 2024: Enhanced focus on user experience and the development of no-code/low-code graph visualization tools to broaden accessibility.
- 2025 (Estimated): Widespread adoption of interactive and real-time graph visualization for dynamic data exploration.
Strategic Outlook for Graph Visualization Tools Software Market
The strategic outlook for the graph visualization tools software market is exceptionally bright, underpinned by continuous technological innovation and expanding application horizons. Growth accelerators include the deepening integration of AI and ML for advanced predictive analytics and automated insight discovery, along with the simplification of complex interfaces to cater to a broader user base through no-code/low-code solutions. Strategic partnerships with cloud service providers and data analytics platforms will further enhance market penetration and interoperability. The increasing recognition of graph visualization’s ability to solve complex problems in critical sectors like cybersecurity, finance, and healthcare positions the market for sustained, robust growth and significant future potential.
Graph Visualization Tools Software Segmentation
-
1. Application
- 1.1. Large Enterprised
- 1.2. SMEs
-
2. Type
- 2.1. Cloud-based
- 2.2. On-premise
Graph Visualization Tools Software Segmentation By Geography
-
1. North America
- 1.1. United States
- 1.2. Canada
- 1.3. Mexico
-
2. South America
- 2.1. Brazil
- 2.2. Argentina
- 2.3. Rest of South America
-
3. Europe
- 3.1. United Kingdom
- 3.2. Germany
- 3.3. France
- 3.4. Italy
- 3.5. Spain
- 3.6. Russia
- 3.7. Benelux
- 3.8. Nordics
- 3.9. Rest of Europe
-
4. Middle East & Africa
- 4.1. Turkey
- 4.2. Israel
- 4.3. GCC
- 4.4. North Africa
- 4.5. South Africa
- 4.6. Rest of Middle East & Africa
-
5. Asia Pacific
- 5.1. China
- 5.2. India
- 5.3. Japan
- 5.4. South Korea
- 5.5. ASEAN
- 5.6. Oceania
- 5.7. Rest of Asia Pacific
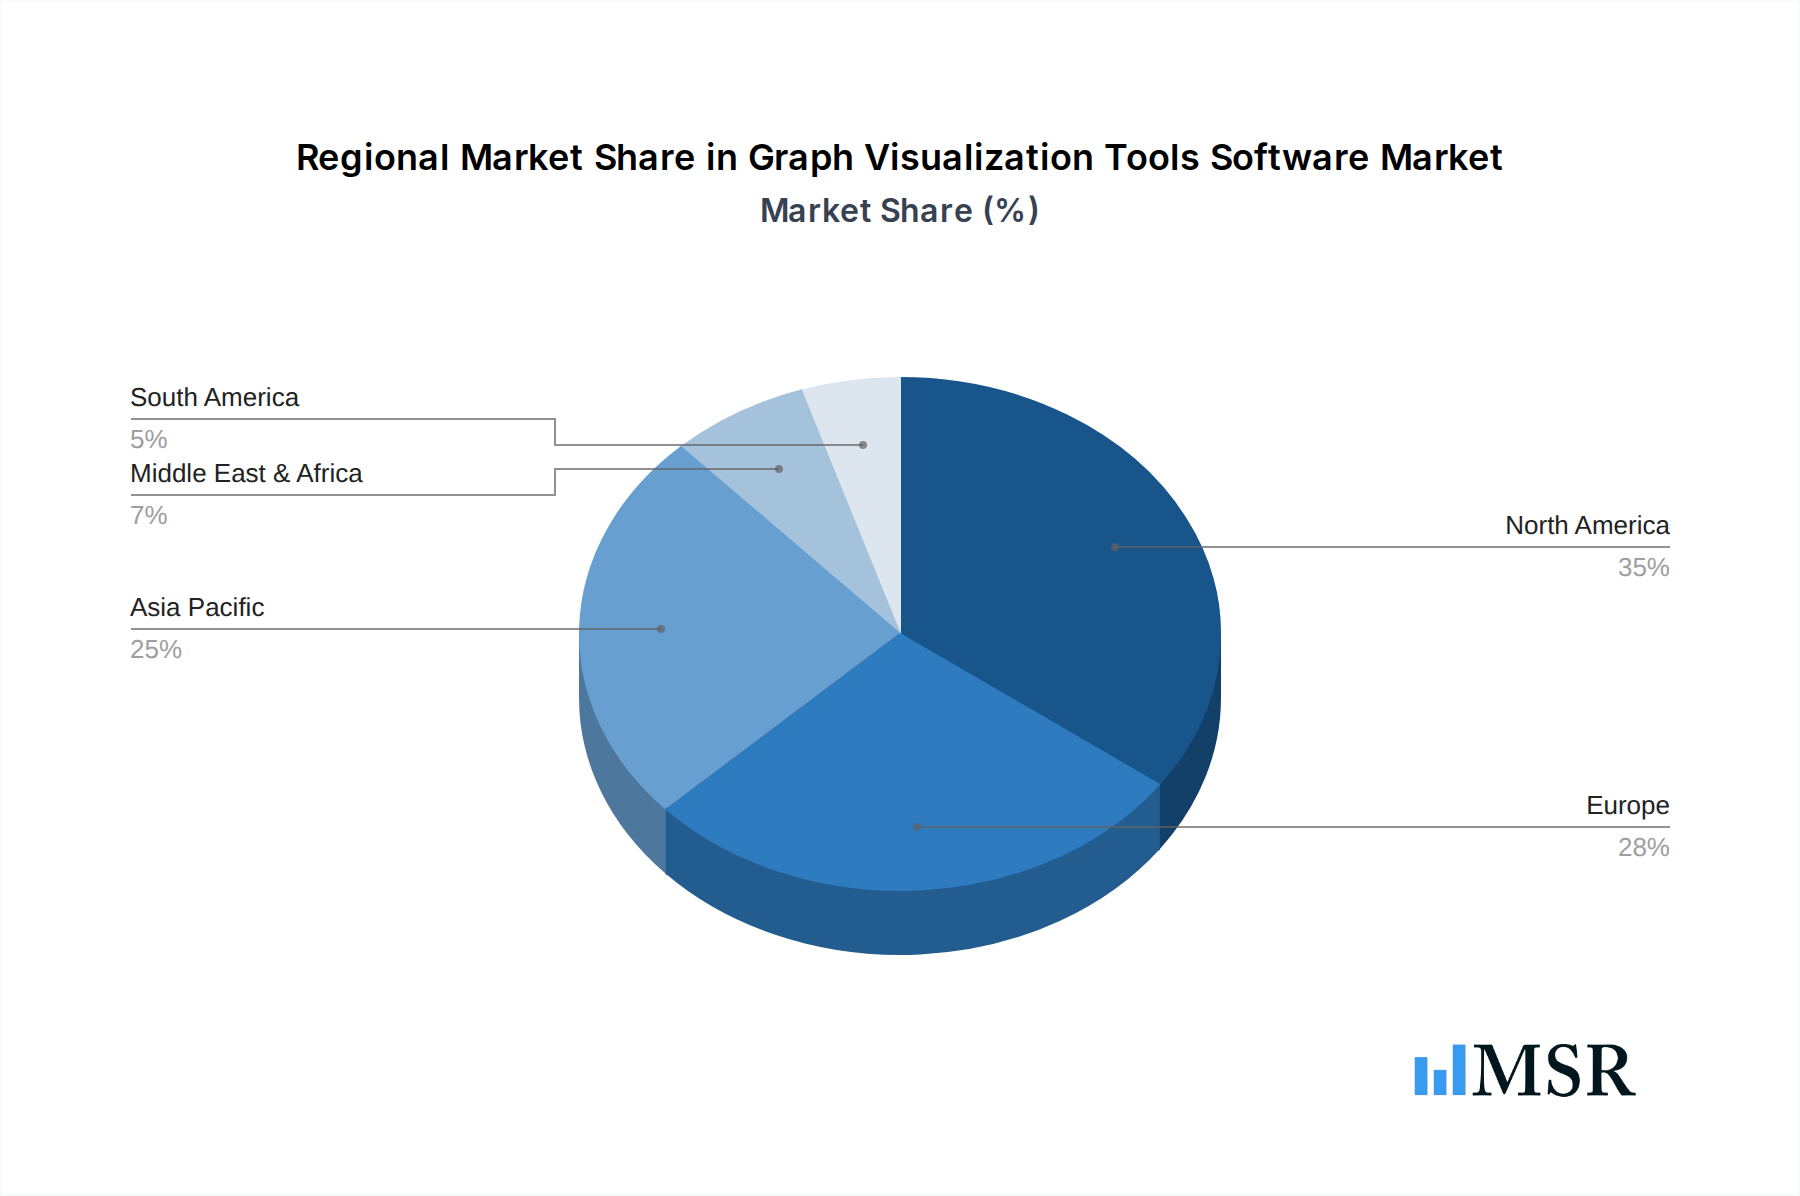
Graph Visualization Tools Software Regional Market Share
Geographic Coverage of Graph Visualization Tools Software
Graph Visualization Tools Software REPORT HIGHLIGHTS
| Aspects | Details |
|---|---|
| Study Period | 2020-2034 |
| Base Year | 2025 |
| Estimated Year | 2026 |
| Forecast Period | 2026-2034 |
| Historical Period | 2020-2025 |
| Growth Rate | CAGR of 4.8% from 2020-2034 |
| Segmentation |
|
Table of Contents
- 1. Introduction
- 1.1. Research Scope
- 1.2. Market Segmentation
- 1.3. Research Objective
- 1.4. Definitions and Assumptions
- 2. Executive Summary
- 2.1. Market Snapshot
- 3. Market Dynamics
- 3.1. Market Drivers
- 3.2. Market Restrains
- 3.3. Market Trends
- 3.4. Market Opportunities
- 4. Market Factor Analysis
- 4.1. Porters Five Forces
- 4.1.1. Bargaining Power of Suppliers
- 4.1.2. Bargaining Power of Buyers
- 4.1.3. Threat of New Entrants
- 4.1.4. Threat of Substitutes
- 4.1.5. Competitive Rivalry
- 4.2. PESTEL analysis
- 4.3. BCG Analysis
- 4.3.1. Stars (High Growth, High Market Share)
- 4.3.2. Cash Cows (Low Growth, High Market Share)
- 4.3.3. Question Mark (High Growth, Low Market Share)
- 4.3.4. Dogs (Low Growth, Low Market Share)
- 4.4. Ansoff Matrix Analysis
- 4.5. Supply Chain Analysis
- 4.6. Regulatory Landscape
- 4.7. Current Market Potential and Opportunity Assessment (TAM–SAM–SOM Framework)
- 4.8. MSR Analyst Note
- 4.1. Porters Five Forces
- 5. Market Analysis, Insights and Forecast 2021-2033
- 5.1. Market Analysis, Insights and Forecast - by Application
- 5.1.1. Large Enterprised
- 5.1.2. SMEs
- 5.2. Market Analysis, Insights and Forecast - by Type
- 5.2.1. Cloud-based
- 5.2.2. On-premise
- 5.3. Market Analysis, Insights and Forecast - by Region
- 5.3.1. North America
- 5.3.2. South America
- 5.3.3. Europe
- 5.3.4. Middle East & Africa
- 5.3.5. Asia Pacific
- 5.1. Market Analysis, Insights and Forecast - by Application
- 6. Global Graph Visualization Tools Software Analysis, Insights and Forecast, 2021-2033
- 6.1. Market Analysis, Insights and Forecast - by Application
- 6.1.1. Large Enterprised
- 6.1.2. SMEs
- 6.2. Market Analysis, Insights and Forecast - by Type
- 6.2.1. Cloud-based
- 6.2.2. On-premise
- 6.1. Market Analysis, Insights and Forecast - by Application
- 7. North America Graph Visualization Tools Software Analysis, Insights and Forecast, 2020-2032
- 7.1. Market Analysis, Insights and Forecast - by Application
- 7.1.1. Large Enterprised
- 7.1.2. SMEs
- 7.2. Market Analysis, Insights and Forecast - by Type
- 7.2.1. Cloud-based
- 7.2.2. On-premise
- 7.1. Market Analysis, Insights and Forecast - by Application
- 8. South America Graph Visualization Tools Software Analysis, Insights and Forecast, 2020-2032
- 8.1. Market Analysis, Insights and Forecast - by Application
- 8.1.1. Large Enterprised
- 8.1.2. SMEs
- 8.2. Market Analysis, Insights and Forecast - by Type
- 8.2.1. Cloud-based
- 8.2.2. On-premise
- 8.1. Market Analysis, Insights and Forecast - by Application
- 9. Europe Graph Visualization Tools Software Analysis, Insights and Forecast, 2020-2032
- 9.1. Market Analysis, Insights and Forecast - by Application
- 9.1.1. Large Enterprised
- 9.1.2. SMEs
- 9.2. Market Analysis, Insights and Forecast - by Type
- 9.2.1. Cloud-based
- 9.2.2. On-premise
- 9.1. Market Analysis, Insights and Forecast - by Application
- 10. Middle East & Africa Graph Visualization Tools Software Analysis, Insights and Forecast, 2020-2032
- 10.1. Market Analysis, Insights and Forecast - by Application
- 10.1.1. Large Enterprised
- 10.1.2. SMEs
- 10.2. Market Analysis, Insights and Forecast - by Type
- 10.2.1. Cloud-based
- 10.2.2. On-premise
- 10.1. Market Analysis, Insights and Forecast - by Application
- 11. Asia Pacific Graph Visualization Tools Software Analysis, Insights and Forecast, 2020-2032
- 11.1. Market Analysis, Insights and Forecast - by Application
- 11.1.1. Large Enterprised
- 11.1.2. SMEs
- 11.2. Market Analysis, Insights and Forecast - by Type
- 11.2.1. Cloud-based
- 11.2.2. On-premise
- 11.1. Market Analysis, Insights and Forecast - by Application
- 12. Competitive Analysis
- 12.1. Company Profiles
- 12.1.1 Graphviz
- 12.1.1.1. Company Overview
- 12.1.1.2. Products
- 12.1.1.3. Company Financials
- 12.1.1.4. SWOT Analysis
- 12.1.2 AntV
- 12.1.2.1. Company Overview
- 12.1.2.2. Products
- 12.1.2.3. Company Financials
- 12.1.2.4. SWOT Analysis
- 12.1.3 Arcade Analytics
- 12.1.3.1. Company Overview
- 12.1.3.2. Products
- 12.1.3.3. Company Financials
- 12.1.3.4. SWOT Analysis
- 12.1.4 Cytospace
- 12.1.4.1. Company Overview
- 12.1.4.2. Products
- 12.1.4.3. Company Financials
- 12.1.4.4. SWOT Analysis
- 12.1.5 Gephi
- 12.1.5.1. Company Overview
- 12.1.5.2. Products
- 12.1.5.3. Company Financials
- 12.1.5.4. SWOT Analysis
- 12.1.6 GoJS
- 12.1.6.1. Company Overview
- 12.1.6.2. Products
- 12.1.6.3. Company Financials
- 12.1.6.4. SWOT Analysis
- 12.1.7 Graphistry
- 12.1.7.1. Company Overview
- 12.1.7.2. Products
- 12.1.7.3. Company Financials
- 12.1.7.4. SWOT Analysis
- 12.1.8 i2 Analyze
- 12.1.8.1. Company Overview
- 12.1.8.2. Products
- 12.1.8.3. Company Financials
- 12.1.8.4. SWOT Analysis
- 12.1.9 Linkurious
- 12.1.9.1. Company Overview
- 12.1.9.2. Products
- 12.1.9.3. Company Financials
- 12.1.9.4. SWOT Analysis
- 12.1.10 Maltego Graph
- 12.1.10.1. Company Overview
- 12.1.10.2. Products
- 12.1.10.3. Company Financials
- 12.1.10.4. SWOT Analysis
- 12.1.11 Quantexa
- 12.1.11.1. Company Overview
- 12.1.11.2. Products
- 12.1.11.3. Company Financials
- 12.1.11.4. SWOT Analysis
- 12.1.12 Tom Sawyer Explorations
- 12.1.12.1. Company Overview
- 12.1.12.2. Products
- 12.1.12.3. Company Financials
- 12.1.12.4. SWOT Analysis
- 12.1.13 ZoomCharts
- 12.1.13.1. Company Overview
- 12.1.13.2. Products
- 12.1.13.3. Company Financials
- 12.1.13.4. SWOT Analysis
- 12.1.1 Graphviz
- 12.2. Market Entropy
- 12.2.1 Company's Key Areas Served
- 12.2.2 Recent Developments
- 12.3. Company Market Share Analysis 2025
- 12.3.1 Top 5 Companies Market Share Analysis
- 12.3.2 Top 3 Companies Market Share Analysis
- 12.4. List of Potential Customers
- 13. Research Methodology
List of Figures
- Figure 1: Global Graph Visualization Tools Software Revenue Breakdown (million, %) by Region 2025 & 2033
- Figure 2: North America Graph Visualization Tools Software Revenue (million), by Application 2025 & 2033
- Figure 3: North America Graph Visualization Tools Software Revenue Share (%), by Application 2025 & 2033
- Figure 4: North America Graph Visualization Tools Software Revenue (million), by Type 2025 & 2033
- Figure 5: North America Graph Visualization Tools Software Revenue Share (%), by Type 2025 & 2033
- Figure 6: North America Graph Visualization Tools Software Revenue (million), by Country 2025 & 2033
- Figure 7: North America Graph Visualization Tools Software Revenue Share (%), by Country 2025 & 2033
- Figure 8: South America Graph Visualization Tools Software Revenue (million), by Application 2025 & 2033
- Figure 9: South America Graph Visualization Tools Software Revenue Share (%), by Application 2025 & 2033
- Figure 10: South America Graph Visualization Tools Software Revenue (million), by Type 2025 & 2033
- Figure 11: South America Graph Visualization Tools Software Revenue Share (%), by Type 2025 & 2033
- Figure 12: South America Graph Visualization Tools Software Revenue (million), by Country 2025 & 2033
- Figure 13: South America Graph Visualization Tools Software Revenue Share (%), by Country 2025 & 2033
- Figure 14: Europe Graph Visualization Tools Software Revenue (million), by Application 2025 & 2033
- Figure 15: Europe Graph Visualization Tools Software Revenue Share (%), by Application 2025 & 2033
- Figure 16: Europe Graph Visualization Tools Software Revenue (million), by Type 2025 & 2033
- Figure 17: Europe Graph Visualization Tools Software Revenue Share (%), by Type 2025 & 2033
- Figure 18: Europe Graph Visualization Tools Software Revenue (million), by Country 2025 & 2033
- Figure 19: Europe Graph Visualization Tools Software Revenue Share (%), by Country 2025 & 2033
- Figure 20: Middle East & Africa Graph Visualization Tools Software Revenue (million), by Application 2025 & 2033
- Figure 21: Middle East & Africa Graph Visualization Tools Software Revenue Share (%), by Application 2025 & 2033
- Figure 22: Middle East & Africa Graph Visualization Tools Software Revenue (million), by Type 2025 & 2033
- Figure 23: Middle East & Africa Graph Visualization Tools Software Revenue Share (%), by Type 2025 & 2033
- Figure 24: Middle East & Africa Graph Visualization Tools Software Revenue (million), by Country 2025 & 2033
- Figure 25: Middle East & Africa Graph Visualization Tools Software Revenue Share (%), by Country 2025 & 2033
- Figure 26: Asia Pacific Graph Visualization Tools Software Revenue (million), by Application 2025 & 2033
- Figure 27: Asia Pacific Graph Visualization Tools Software Revenue Share (%), by Application 2025 & 2033
- Figure 28: Asia Pacific Graph Visualization Tools Software Revenue (million), by Type 2025 & 2033
- Figure 29: Asia Pacific Graph Visualization Tools Software Revenue Share (%), by Type 2025 & 2033
- Figure 30: Asia Pacific Graph Visualization Tools Software Revenue (million), by Country 2025 & 2033
- Figure 31: Asia Pacific Graph Visualization Tools Software Revenue Share (%), by Country 2025 & 2033
List of Tables
- Table 1: Global Graph Visualization Tools Software Revenue million Forecast, by Application 2020 & 2033
- Table 2: Global Graph Visualization Tools Software Revenue million Forecast, by Type 2020 & 2033
- Table 3: Global Graph Visualization Tools Software Revenue million Forecast, by Region 2020 & 2033
- Table 4: Global Graph Visualization Tools Software Revenue million Forecast, by Application 2020 & 2033
- Table 5: Global Graph Visualization Tools Software Revenue million Forecast, by Type 2020 & 2033
- Table 6: Global Graph Visualization Tools Software Revenue million Forecast, by Country 2020 & 2033
- Table 7: United States Graph Visualization Tools Software Revenue (million) Forecast, by Application 2020 & 2033
- Table 8: Canada Graph Visualization Tools Software Revenue (million) Forecast, by Application 2020 & 2033
- Table 9: Mexico Graph Visualization Tools Software Revenue (million) Forecast, by Application 2020 & 2033
- Table 10: Global Graph Visualization Tools Software Revenue million Forecast, by Application 2020 & 2033
- Table 11: Global Graph Visualization Tools Software Revenue million Forecast, by Type 2020 & 2033
- Table 12: Global Graph Visualization Tools Software Revenue million Forecast, by Country 2020 & 2033
- Table 13: Brazil Graph Visualization Tools Software Revenue (million) Forecast, by Application 2020 & 2033
- Table 14: Argentina Graph Visualization Tools Software Revenue (million) Forecast, by Application 2020 & 2033
- Table 15: Rest of South America Graph Visualization Tools Software Revenue (million) Forecast, by Application 2020 & 2033
- Table 16: Global Graph Visualization Tools Software Revenue million Forecast, by Application 2020 & 2033
- Table 17: Global Graph Visualization Tools Software Revenue million Forecast, by Type 2020 & 2033
- Table 18: Global Graph Visualization Tools Software Revenue million Forecast, by Country 2020 & 2033
- Table 19: United Kingdom Graph Visualization Tools Software Revenue (million) Forecast, by Application 2020 & 2033
- Table 20: Germany Graph Visualization Tools Software Revenue (million) Forecast, by Application 2020 & 2033
- Table 21: France Graph Visualization Tools Software Revenue (million) Forecast, by Application 2020 & 2033
- Table 22: Italy Graph Visualization Tools Software Revenue (million) Forecast, by Application 2020 & 2033
- Table 23: Spain Graph Visualization Tools Software Revenue (million) Forecast, by Application 2020 & 2033
- Table 24: Russia Graph Visualization Tools Software Revenue (million) Forecast, by Application 2020 & 2033
- Table 25: Benelux Graph Visualization Tools Software Revenue (million) Forecast, by Application 2020 & 2033
- Table 26: Nordics Graph Visualization Tools Software Revenue (million) Forecast, by Application 2020 & 2033
- Table 27: Rest of Europe Graph Visualization Tools Software Revenue (million) Forecast, by Application 2020 & 2033
- Table 28: Global Graph Visualization Tools Software Revenue million Forecast, by Application 2020 & 2033
- Table 29: Global Graph Visualization Tools Software Revenue million Forecast, by Type 2020 & 2033
- Table 30: Global Graph Visualization Tools Software Revenue million Forecast, by Country 2020 & 2033
- Table 31: Turkey Graph Visualization Tools Software Revenue (million) Forecast, by Application 2020 & 2033
- Table 32: Israel Graph Visualization Tools Software Revenue (million) Forecast, by Application 2020 & 2033
- Table 33: GCC Graph Visualization Tools Software Revenue (million) Forecast, by Application 2020 & 2033
- Table 34: North Africa Graph Visualization Tools Software Revenue (million) Forecast, by Application 2020 & 2033
- Table 35: South Africa Graph Visualization Tools Software Revenue (million) Forecast, by Application 2020 & 2033
- Table 36: Rest of Middle East & Africa Graph Visualization Tools Software Revenue (million) Forecast, by Application 2020 & 2033
- Table 37: Global Graph Visualization Tools Software Revenue million Forecast, by Application 2020 & 2033
- Table 38: Global Graph Visualization Tools Software Revenue million Forecast, by Type 2020 & 2033
- Table 39: Global Graph Visualization Tools Software Revenue million Forecast, by Country 2020 & 2033
- Table 40: China Graph Visualization Tools Software Revenue (million) Forecast, by Application 2020 & 2033
- Table 41: India Graph Visualization Tools Software Revenue (million) Forecast, by Application 2020 & 2033
- Table 42: Japan Graph Visualization Tools Software Revenue (million) Forecast, by Application 2020 & 2033
- Table 43: South Korea Graph Visualization Tools Software Revenue (million) Forecast, by Application 2020 & 2033
- Table 44: ASEAN Graph Visualization Tools Software Revenue (million) Forecast, by Application 2020 & 2033
- Table 45: Oceania Graph Visualization Tools Software Revenue (million) Forecast, by Application 2020 & 2033
- Table 46: Rest of Asia Pacific Graph Visualization Tools Software Revenue (million) Forecast, by Application 2020 & 2033
Frequently Asked Questions
1. What is the projected Compound Annual Growth Rate (CAGR) of the Graph Visualization Tools Software?
The projected CAGR is approximately 4.8%.
2. Which companies are prominent players in the Graph Visualization Tools Software?
Key companies in the market include Graphviz, AntV, Arcade Analytics, Cytospace, Gephi, GoJS, Graphistry, i2 Analyze, Linkurious, Maltego Graph, Quantexa, Tom Sawyer Explorations, ZoomCharts.
3. What are the main segments of the Graph Visualization Tools Software?
The market segments include Application, Type.
4. Can you provide details about the market size?
The market size is estimated to be USD 175 million as of 2022.
5. What are some drivers contributing to market growth?
N/A
6. What are the notable trends driving market growth?
N/A
7. Are there any restraints impacting market growth?
N/A
8. Can you provide examples of recent developments in the market?
N/A
9. What pricing options are available for accessing the report?
Pricing options include single-user, multi-user, and enterprise licenses priced at USD 2900.00, USD 4350.00, and USD 5800.00 respectively.
10. Is the market size provided in terms of value or volume?
The market size is provided in terms of value, measured in million.
11. Are there any specific market keywords associated with the report?
Yes, the market keyword associated with the report is "Graph Visualization Tools Software," which aids in identifying and referencing the specific market segment covered.
12. How do I determine which pricing option suits my needs best?
The pricing options vary based on user requirements and access needs. Individual users may opt for single-user licenses, while businesses requiring broader access may choose multi-user or enterprise licenses for cost-effective access to the report.
13. Are there any additional resources or data provided in the Graph Visualization Tools Software report?
While the report offers comprehensive insights, it's advisable to review the specific contents or supplementary materials provided to ascertain if additional resources or data are available.
14. How can I stay updated on further developments or reports in the Graph Visualization Tools Software?
To stay informed about further developments, trends, and reports in the Graph Visualization Tools Software, consider subscribing to industry newsletters, following relevant companies and organizations, or regularly checking reputable industry news sources and publications.
Methodology
Step 1 - Identification of Relevant Samples Size from Population Database


Step 2 - Approaches for Defining Global Market Size (Value, Volume* & Price*)

Note*: In applicable scenarios
Step 3 - Data Sources
Primary Research
- Web Analytics
- Survey Reports
- Research Institute
- Latest Research Reports
- Opinion Leaders
Secondary Research
- Annual Reports
- White Paper
- Latest Press Release
- Industry Association
- Paid Database
- Investor Presentations

Step 4 - Data Triangulation
Involves using different sources of information in order to increase the validity of a study
These sources are likely to be stakeholders in a program - participants, other researchers, program staff, other community members, and so on.
Then we put all data in single framework & apply various statistical tools to find out the dynamic on the market.
During the analysis stage, feedback from the stakeholder groups would be compared to determine areas of agreement as well as areas of divergence