

Key Insights
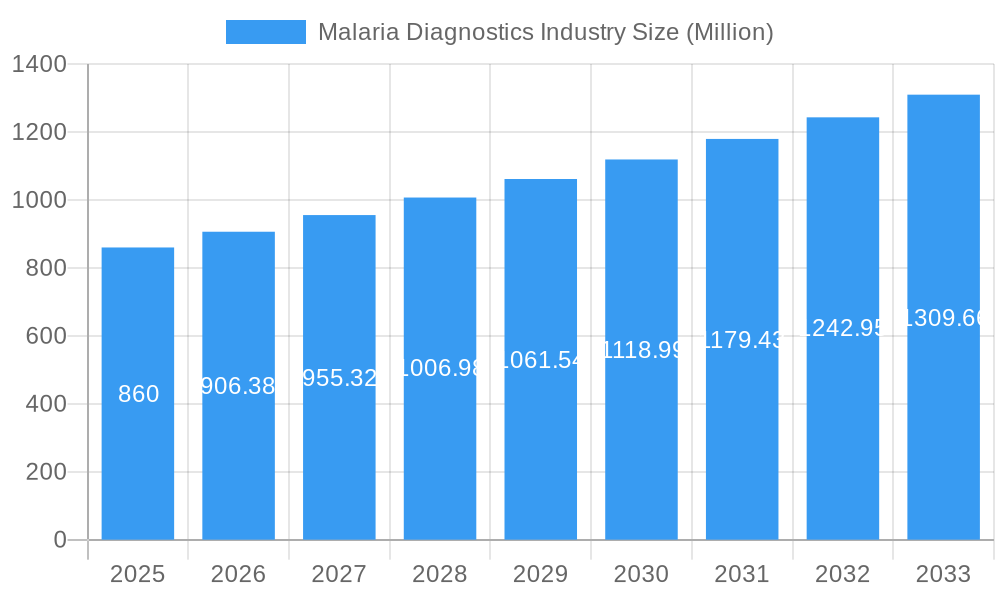
The global malaria diagnostics market, valued at $0.86 billion in 2025, is projected to experience robust growth, driven by increasing malaria prevalence in endemic regions, particularly in sub-Saharan Africa and Southeast Asia. A compound annual growth rate (CAGR) of 5.23% from 2025 to 2033 indicates a significant market expansion over the forecast period. This growth is fueled by several key factors. Firstly, heightened awareness of the disease and its devastating impact on public health is leading to increased investment in diagnostic infrastructure and improved access to testing. Secondly, technological advancements in rapid diagnostic tests (RDTs) and molecular diagnostics are providing faster, more accurate, and user-friendly testing solutions, particularly in resource-limited settings. Furthermore, government initiatives and public-private partnerships aimed at malaria eradication are significantly contributing to market expansion. The market segmentation reveals that RDTs are currently dominating the technology segment due to their ease of use and affordability, while molecular diagnostics are anticipated to witness substantial growth due to their high sensitivity and specificity. Geographic expansion is predominantly witnessed in developing nations where malaria is endemic, although developed countries contribute to the market through research and development activities and production of advanced diagnostic technologies. However, challenges such as uneven distribution of resources, reliance on outdated diagnostic methods in some areas, and the emergence of drug-resistant malaria strains pose potential restraints to market growth. These challenges, although significant, are unlikely to significantly impede the overall positive trajectory of the malaria diagnostics market in the coming years.
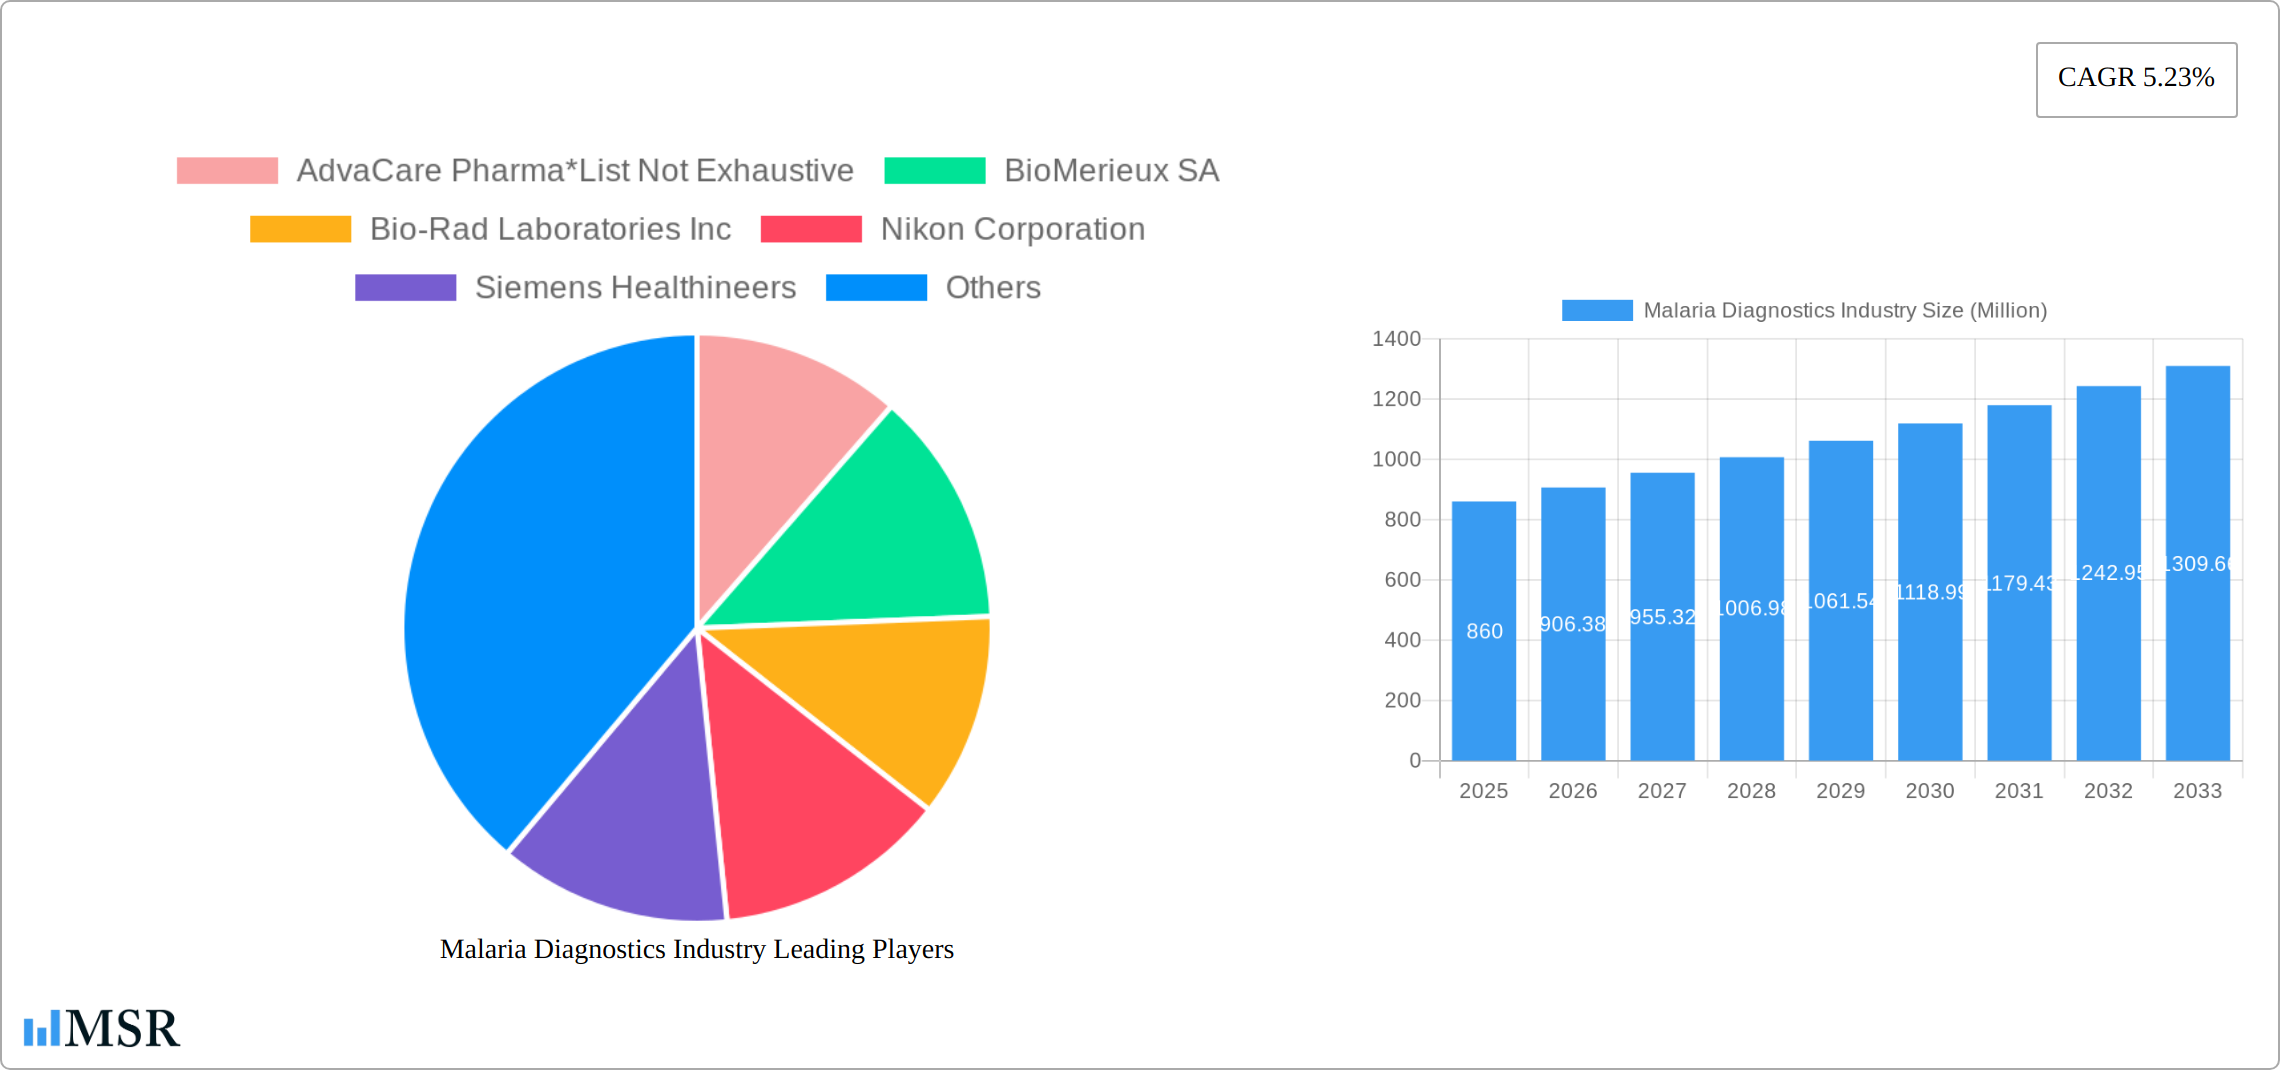
Malaria Diagnostics Industry Market Size (In Million)
The leading players in the malaria diagnostics market, including Abbott Laboratories, Bio-Rad Laboratories, and Thermo Fisher Scientific, are actively engaged in developing advanced diagnostic tools and expanding their global reach. These companies are strategically investing in R&D, forging partnerships, and expanding their distribution networks to capitalize on the growing demand. Competition is expected to intensify as new entrants enter the market and existing players innovate to improve the accuracy, speed, and affordability of their products. The market is also influenced by the ongoing efforts to develop point-of-care diagnostics, aiming to provide rapid and accessible testing in remote and underserved areas. This drive towards improved access, combined with technological advancements and supportive government policies, will continue to shape the future of the malaria diagnostics industry, paving the way for more effective disease control and eradication strategies.
Malaria Diagnostics Industry Company Market Share
Malaria Diagnostics Industry Market Report: 2019-2033
This comprehensive report provides an in-depth analysis of the Malaria Diagnostics Industry, encompassing market dynamics, technological advancements, key players, and future growth prospects. The study period covers 2019-2033, with 2025 as the base and estimated year. The report offers actionable insights for industry stakeholders, investors, and researchers, forecasting market trends and opportunities until 2033. The global market size is projected to reach xx Million USD by 2033, exhibiting a CAGR of xx% during the forecast period (2025-2033).
Malaria Diagnostics Industry Market Concentration & Dynamics
The Malaria Diagnostics market exhibits a moderately consolidated structure, with several key players holding significant market share. The market is characterized by intense competition, driven by technological innovation and the continuous demand for improved diagnostic accuracy. The top 10 companies account for approximately xx% of the global market share in 2025. Leading players include BioMérieux SA, Bio-Rad Laboratories Inc, Nikon Corporation, Siemens Healthineers, Abbott Laboratories, Ortho Clinical Diagnostics, and Thermo Fisher Scientific. Other significant players include AdvaCare Pharma, Premier Medical Corporation Pvt Ltd, Advy Chemical Pvt Ltd, Zephyr Biomedicals, and Access Bio Inc.
- Market Share: Top 5 players hold approximately xx% market share (2025).
- M&A Activity: The industry has witnessed xx M&A deals in the historical period (2019-2024), primarily focused on expanding product portfolios and geographical reach. A significant increase in M&A activity is expected during the forecast period.
- Innovation Ecosystem: A robust ecosystem of research institutions, startups, and established players fosters continuous innovation in diagnostic technologies.
- Regulatory Frameworks: Stringent regulatory approvals impact market entry and product lifecycle.
- Substitute Products: Limited substitutes exist, strengthening market demand for specialized malaria diagnostic solutions.
- End-User Trends: Increasing demand from hospitals, clinics, and research institutions in endemic regions drives market growth.
Malaria Diagnostics Industry Industry Insights & Trends
The Malaria Diagnostics market is driven by several factors, including the increasing prevalence of malaria, growing demand for rapid and accurate diagnostic tools, and advancements in diagnostic technologies. The market is witnessing a shift towards molecular diagnostics and rapid diagnostic tests (RDTs) due to their improved sensitivity and ease of use. Government initiatives aimed at malaria eradication and control programs, coupled with rising healthcare expenditure, further stimulate market growth. The market is projected to reach xx Million USD by 2033, demonstrating substantial growth. The market is also influenced by evolving consumer behaviors, with a growing preference for point-of-care diagnostics and home-based testing solutions. Technological disruptions, such as the development of advanced molecular diagnostic platforms and artificial intelligence (AI)-powered diagnostic tools, are reshaping the market landscape. These technological advancements offer enhanced sensitivity, specificity, and speed, improving diagnostic capabilities. The market is experiencing technological disruptions, with significant investments in R&D leading to the development of advanced technologies like CRISPR-based diagnostics, improving accuracy and reducing testing times.
Key Markets & Segments Leading Malaria Diagnostics Industry
Sub-Saharan Africa remains the epicenter of the malaria diagnostics market, owing to the high prevalence of the disease and ongoing efforts to strengthen healthcare infrastructure. Other key markets include South Asia and Southeast Asia, regions grappling with significant malaria burdens. The market is segmented by technology, with Rapid Diagnostic Tests (RDTs) currently holding the largest market share due to their ease of use, affordability, and portability, making them ideal for resource-limited settings. However, Molecular Diagnostics is exhibiting rapid growth, driven by its superior sensitivity and specificity, particularly in identifying drug-resistant strains of malaria. This segment is poised for significant expansion as access to advanced technology increases and healthcare infrastructure improves.
Key Market Drivers:
- High Prevalence of Malaria: Sub-Saharan Africa continues to bear the brunt of the global malaria burden.
- Robust Government Initiatives & Funding: Significant investments from organizations like the Global Fund are crucial in driving demand for improved diagnostic tools.
- Expanding Healthcare Infrastructure: Investments in healthcare infrastructure, particularly in underserved regions, are broadening access to diagnostic services.
- Increased Healthcare Expenditure: Rising healthcare spending globally is making advanced diagnostic technologies more accessible.
- Technological Advancements: Continuous innovation in diagnostic technologies is driving market growth and improving diagnostic capabilities.
Segment Dominance Analysis:
While RDTs currently dominate due to cost-effectiveness and ease of use, molecular diagnostics are gaining significant traction. Their superior accuracy in identifying drug-resistant strains and their potential for earlier detection are driving adoption. The clinical diagnostics segment, encompassing laboratory-based testing, is also experiencing robust growth, mirroring the expansion of healthcare infrastructure and increased access to diagnostic facilities.
Malaria Diagnostics Industry Product Developments
Recent innovations are focused on enhancing the performance and accessibility of malaria diagnostics. Significant efforts are underway to improve the sensitivity and specificity of RDTs, making them even more reliable in identifying malaria infections. Simultaneously, there is a strong push to develop more affordable and portable molecular diagnostic platforms, expanding access to these advanced technologies, particularly in remote and underserved areas. The integration of AI is revolutionizing diagnostic workflows, offering the potential for faster, more accurate results, and automated analysis. A key focus is on the development and deployment of point-of-care diagnostics, enabling rapid testing and immediate treatment decisions at the point of patient contact, optimizing care delivery and improving health outcomes.
Challenges in the Malaria Diagnostics Industry Market
The malaria diagnostics market faces several challenges, including regulatory hurdles for new product approvals, complex supply chains prone to disruptions, and intense competition among established and emerging players. These factors affect market access, pricing strategies, and the overall availability of diagnostics. For example, supply chain disruptions can result in shortages of critical diagnostic components, leading to testing delays and impacting diagnostic capacity. Furthermore, stringent regulatory approvals and varied regulations across different countries can create delays in product launches and increase associated costs. These factors contribute to the overall challenges in expanding access to high-quality and reliable malaria diagnostics.
Forces Driving Malaria Diagnostics Industry Growth
The market is primarily propelled by technological advancements leading to more accurate, rapid, and affordable diagnostic tools. Increased government funding for malaria eradication programs, like the USD 16 Billion invested by the Global Fund, further stimulates market growth. The rising prevalence of malaria in many parts of the world creates substantial demand for reliable diagnostics. Furthermore, evolving consumer behaviors, with increasing awareness and demand for better healthcare services, support the expansion of this market.
Long-Term Growth Catalysts in the Malaria Diagnostics Industry
Continued investment in R&D for developing advanced diagnostic technologies like CRISPR-based diagnostics and AI integration promises to drive future growth. Strategic partnerships between governments, NGOs, and private sector companies are crucial for ensuring accessibility to diagnostic solutions in underserved regions. Expansion into new markets with high malaria prevalence and increasing healthcare infrastructure will unlock significant growth opportunities.
Emerging Opportunities in Malaria Diagnostics Industry
Significant opportunities exist in developing and deploying point-of-care diagnostics, leveraging AI and big data analytics for improved diagnostic accuracy and predictive modeling, and tailoring diagnostic solutions for specific populations or disease strains. Further, exploring novel diagnostic technologies like digital microscopy and microfluidics offers considerable potential for improving efficiency, accuracy, and accessibility.
Leading Players in the Malaria Diagnostics Industry Sector
- AdvaCare Pharma
- BioMérieux SA
- Bio-Rad Laboratories Inc
- Nikon Corporation
- Siemens Healthineers
- Abbott Laboratories
- Ortho Clinical Diagnostics
- Premier Medical Corporation Pvt Ltd
- Advy Chemical Pvt Ltd
- Zephyr Biomedicals
- Access Bio Inc
- Thermo Fisher Scientific
Key Milestones in Malaria Diagnostics Industry Industry
- June 2022: The partnership between SC Johnson and the Global Fund to combat malaria underscores the significant global commitment to malaria eradication and control. The Global Fund's substantial investment of over USD 16 Billion highlights the scale of this effort.
- February 2022: The launch of the Plasmochek diagnostic kit by the Kenya Medical Research Institute (KEMRI) exemplifies the growing capacity for local innovation in diagnostic solutions.
- [Add other relevant milestones with dates and brief descriptions]
Strategic Outlook for Malaria Diagnostics Industry Market
The malaria diagnostics market presents significant opportunities for growth, driven by the sustained need for accurate and timely diagnosis, ongoing technological advancements, and the unwavering commitment of global health organizations to malaria elimination. Key strategic considerations for market players include forging strategic partnerships to leverage expertise and resources, expanding into new and underserved markets, and focusing on developing affordable and accessible diagnostic solutions to maximize global impact. The convergence of technological innovation, increased funding, and a global commitment to malaria control positions the market for robust and sustained growth in the coming years.
Malaria Diagnostics Industry Segmentation
-
1. Technology
- 1.1. Clinical Diagnostics
- 1.2. Microscopic Diagnostics
- 1.3. Rapid Diagnostic Tests (RDTs)
- 1.4. Molecular Diagnostics
- 1.5. Other Technologies
Malaria Diagnostics Industry Segmentation By Geography
-
1. Americas
- 1.1. Venezuela
- 1.2. Brazil
- 1.3. Colombia
- 1.4. Rest of the Americas
-
2. Europe
- 2.1. Germany
- 2.2. United Kingdom
- 2.3. France
- 2.4. Turkey
- 2.5. Spain
- 2.6. Rest of Europe
- 3. Asia Pacific
-
4. India
- 4.1. Myanmar
- 4.2. Indonesia
- 4.3. Pakistan
- 4.4. China
- 4.5. Papua New Guinea
- 4.6. Cambodia
- 4.7. Rest of Asia Pacific
-
5. Africa
- 5.1. Democratic Republic of Congo
- 5.2. Nigeria
- 5.3. Uganda
- 5.4. Rest of Africa
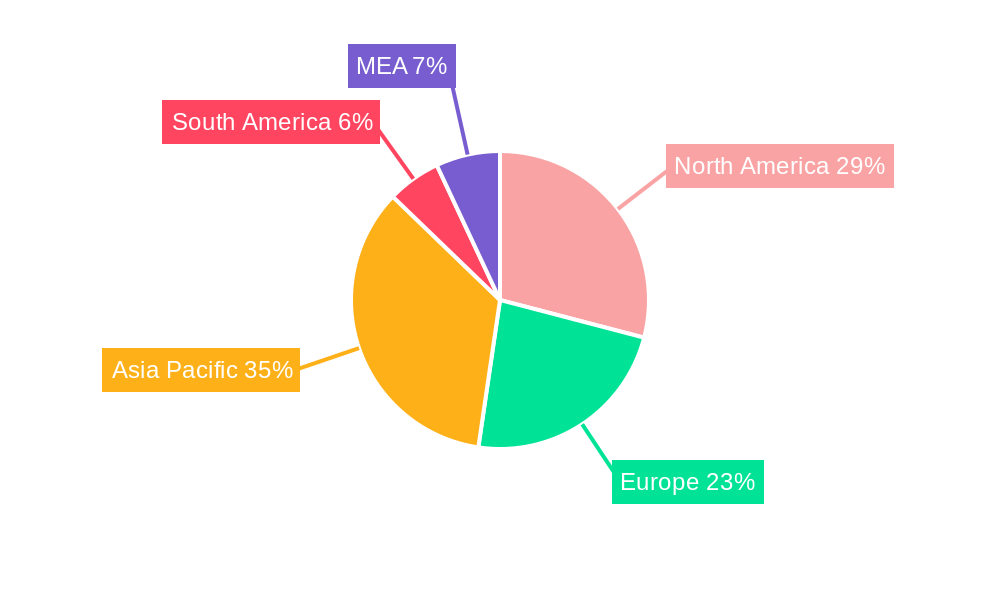
Malaria Diagnostics Industry Regional Market Share
Geographic Coverage of Malaria Diagnostics Industry
Malaria Diagnostics Industry REPORT HIGHLIGHTS
| Aspects | Details |
|---|---|
| Study Period | 2020-2034 |
| Base Year | 2025 |
| Estimated Year | 2026 |
| Forecast Period | 2026-2034 |
| Historical Period | 2020-2025 |
| Growth Rate | CAGR of 5.23% from 2020-2034 |
| Segmentation |
|
Table of Contents
- 1. Introduction
- 1.1. Research Scope
- 1.2. Market Segmentation
- 1.3. Research Objective
- 1.4. Definitions and Assumptions
- 2. Executive Summary
- 2.1. Market Snapshot
- 3. Market Dynamics
- 3.1. Market Drivers
- 3.2. Market Restrains
- 3.3. Market Trends
- 3.4. Market Opportunities
- 4. Market Factor Analysis
- 4.1. Porters Five Forces
- 4.1.1. Bargaining Power of Suppliers
- 4.1.2. Bargaining Power of Buyers
- 4.1.3. Threat of New Entrants
- 4.1.4. Threat of Substitutes
- 4.1.5. Competitive Rivalry
- 4.2. PESTEL analysis
- 4.3. BCG Analysis
- 4.3.1. Stars (High Growth, High Market Share)
- 4.3.2. Cash Cows (Low Growth, High Market Share)
- 4.3.3. Question Mark (High Growth, Low Market Share)
- 4.3.4. Dogs (Low Growth, Low Market Share)
- 4.4. Ansoff Matrix Analysis
- 4.5. Supply Chain Analysis
- 4.6. Regulatory Landscape
- 4.7. Current Market Potential and Opportunity Assessment (TAM–SAM–SOM Framework)
- 4.8. MSR Analyst Note
- 4.1. Porters Five Forces
- 5. Market Analysis, Insights and Forecast 2021-2033
- 5.1. Market Analysis, Insights and Forecast - by Technology
- 5.1.1. Clinical Diagnostics
- 5.1.2. Microscopic Diagnostics
- 5.1.3. Rapid Diagnostic Tests (RDTs)
- 5.1.4. Molecular Diagnostics
- 5.1.5. Other Technologies
- 5.2. Market Analysis, Insights and Forecast - by Region
- 5.2.1. Americas
- 5.2.2. Europe
- 5.2.3. Asia Pacific
- 5.2.4. India
- 5.2.5. Africa
- 5.1. Market Analysis, Insights and Forecast - by Technology
- 6. Global Malaria Diagnostics Industry Analysis, Insights and Forecast, 2021-2033
- 6.1. Market Analysis, Insights and Forecast - by Technology
- 6.1.1. Clinical Diagnostics
- 6.1.2. Microscopic Diagnostics
- 6.1.3. Rapid Diagnostic Tests (RDTs)
- 6.1.4. Molecular Diagnostics
- 6.1.5. Other Technologies
- 6.1. Market Analysis, Insights and Forecast - by Technology
- 7. Americas Malaria Diagnostics Industry Analysis, Insights and Forecast, 2020-2032
- 7.1. Market Analysis, Insights and Forecast - by Technology
- 7.1.1. Clinical Diagnostics
- 7.1.2. Microscopic Diagnostics
- 7.1.3. Rapid Diagnostic Tests (RDTs)
- 7.1.4. Molecular Diagnostics
- 7.1.5. Other Technologies
- 7.1. Market Analysis, Insights and Forecast - by Technology
- 8. Europe Malaria Diagnostics Industry Analysis, Insights and Forecast, 2020-2032
- 8.1. Market Analysis, Insights and Forecast - by Technology
- 8.1.1. Clinical Diagnostics
- 8.1.2. Microscopic Diagnostics
- 8.1.3. Rapid Diagnostic Tests (RDTs)
- 8.1.4. Molecular Diagnostics
- 8.1.5. Other Technologies
- 8.1. Market Analysis, Insights and Forecast - by Technology
- 9. Asia Pacific Malaria Diagnostics Industry Analysis, Insights and Forecast, 2020-2032
- 9.1. Market Analysis, Insights and Forecast - by Technology
- 9.1.1. Clinical Diagnostics
- 9.1.2. Microscopic Diagnostics
- 9.1.3. Rapid Diagnostic Tests (RDTs)
- 9.1.4. Molecular Diagnostics
- 9.1.5. Other Technologies
- 9.1. Market Analysis, Insights and Forecast - by Technology
- 10. India Malaria Diagnostics Industry Analysis, Insights and Forecast, 2020-2032
- 10.1. Market Analysis, Insights and Forecast - by Technology
- 10.1.1. Clinical Diagnostics
- 10.1.2. Microscopic Diagnostics
- 10.1.3. Rapid Diagnostic Tests (RDTs)
- 10.1.4. Molecular Diagnostics
- 10.1.5. Other Technologies
- 10.1. Market Analysis, Insights and Forecast - by Technology
- 11. Africa Malaria Diagnostics Industry Analysis, Insights and Forecast, 2020-2032
- 11.1. Market Analysis, Insights and Forecast - by Technology
- 11.1.1. Clinical Diagnostics
- 11.1.2. Microscopic Diagnostics
- 11.1.3. Rapid Diagnostic Tests (RDTs)
- 11.1.4. Molecular Diagnostics
- 11.1.5. Other Technologies
- 11.1. Market Analysis, Insights and Forecast - by Technology
- 12. Competitive Analysis
- 12.1. Company Profiles
- 12.1.1 AdvaCare Pharma*List Not Exhaustive
- 12.1.1.1. Company Overview
- 12.1.1.2. Products
- 12.1.1.3. Company Financials
- 12.1.1.4. SWOT Analysis
- 12.1.2 BioMerieux SA
- 12.1.2.1. Company Overview
- 12.1.2.2. Products
- 12.1.2.3. Company Financials
- 12.1.2.4. SWOT Analysis
- 12.1.3 Bio-Rad Laboratories Inc
- 12.1.3.1. Company Overview
- 12.1.3.2. Products
- 12.1.3.3. Company Financials
- 12.1.3.4. SWOT Analysis
- 12.1.4 Nikon Corporation
- 12.1.4.1. Company Overview
- 12.1.4.2. Products
- 12.1.4.3. Company Financials
- 12.1.4.4. SWOT Analysis
- 12.1.5 Siemens Healthineers
- 12.1.5.1. Company Overview
- 12.1.5.2. Products
- 12.1.5.3. Company Financials
- 12.1.5.4. SWOT Analysis
- 12.1.6 Abbott Laboratories
- 12.1.6.1. Company Overview
- 12.1.6.2. Products
- 12.1.6.3. Company Financials
- 12.1.6.4. SWOT Analysis
- 12.1.7 Ortho Clinical Diagnostics
- 12.1.7.1. Company Overview
- 12.1.7.2. Products
- 12.1.7.3. Company Financials
- 12.1.7.4. SWOT Analysis
- 12.1.8 Premier Medical Corporation Pvt Ltd
- 12.1.8.1. Company Overview
- 12.1.8.2. Products
- 12.1.8.3. Company Financials
- 12.1.8.4. SWOT Analysis
- 12.1.9 Advy Chemical Pvt Ltd
- 12.1.9.1. Company Overview
- 12.1.9.2. Products
- 12.1.9.3. Company Financials
- 12.1.9.4. SWOT Analysis
- 12.1.10 Zephyr Biomedicals
- 12.1.10.1. Company Overview
- 12.1.10.2. Products
- 12.1.10.3. Company Financials
- 12.1.10.4. SWOT Analysis
- 12.1.11 Access Bio Inc
- 12.1.11.1. Company Overview
- 12.1.11.2. Products
- 12.1.11.3. Company Financials
- 12.1.11.4. SWOT Analysis
- 12.1.12 Thermo Fisher Scientific
- 12.1.12.1. Company Overview
- 12.1.12.2. Products
- 12.1.12.3. Company Financials
- 12.1.12.4. SWOT Analysis
- 12.1.1 AdvaCare Pharma*List Not Exhaustive
- 12.2. Market Entropy
- 12.2.1 Company's Key Areas Served
- 12.2.2 Recent Developments
- 12.3. Company Market Share Analysis 2025
- 12.3.1 Top 5 Companies Market Share Analysis
- 12.3.2 Top 3 Companies Market Share Analysis
- 12.4. List of Potential Customers
- 13. Research Methodology
List of Figures
- Figure 1: Global Malaria Diagnostics Industry Revenue Breakdown (Million, %) by Region 2025 & 2033
- Figure 2: Americas Malaria Diagnostics Industry Revenue (Million), by Technology 2025 & 2033
- Figure 3: Americas Malaria Diagnostics Industry Revenue Share (%), by Technology 2025 & 2033
- Figure 4: Americas Malaria Diagnostics Industry Revenue (Million), by Country 2025 & 2033
- Figure 5: Americas Malaria Diagnostics Industry Revenue Share (%), by Country 2025 & 2033
- Figure 6: Europe Malaria Diagnostics Industry Revenue (Million), by Technology 2025 & 2033
- Figure 7: Europe Malaria Diagnostics Industry Revenue Share (%), by Technology 2025 & 2033
- Figure 8: Europe Malaria Diagnostics Industry Revenue (Million), by Country 2025 & 2033
- Figure 9: Europe Malaria Diagnostics Industry Revenue Share (%), by Country 2025 & 2033
- Figure 10: Asia Pacific Malaria Diagnostics Industry Revenue (Million), by Technology 2025 & 2033
- Figure 11: Asia Pacific Malaria Diagnostics Industry Revenue Share (%), by Technology 2025 & 2033
- Figure 12: Asia Pacific Malaria Diagnostics Industry Revenue (Million), by Country 2025 & 2033
- Figure 13: Asia Pacific Malaria Diagnostics Industry Revenue Share (%), by Country 2025 & 2033
- Figure 14: India Malaria Diagnostics Industry Revenue (Million), by Technology 2025 & 2033
- Figure 15: India Malaria Diagnostics Industry Revenue Share (%), by Technology 2025 & 2033
- Figure 16: India Malaria Diagnostics Industry Revenue (Million), by Country 2025 & 2033
- Figure 17: India Malaria Diagnostics Industry Revenue Share (%), by Country 2025 & 2033
- Figure 18: Africa Malaria Diagnostics Industry Revenue (Million), by Technology 2025 & 2033
- Figure 19: Africa Malaria Diagnostics Industry Revenue Share (%), by Technology 2025 & 2033
- Figure 20: Africa Malaria Diagnostics Industry Revenue (Million), by Country 2025 & 2033
- Figure 21: Africa Malaria Diagnostics Industry Revenue Share (%), by Country 2025 & 2033
List of Tables
- Table 1: Global Malaria Diagnostics Industry Revenue Million Forecast, by Technology 2020 & 2033
- Table 2: Global Malaria Diagnostics Industry Revenue Million Forecast, by Region 2020 & 2033
- Table 3: Global Malaria Diagnostics Industry Revenue Million Forecast, by Technology 2020 & 2033
- Table 4: Global Malaria Diagnostics Industry Revenue Million Forecast, by Country 2020 & 2033
- Table 5: Venezuela Malaria Diagnostics Industry Revenue (Million) Forecast, by Application 2020 & 2033
- Table 6: Brazil Malaria Diagnostics Industry Revenue (Million) Forecast, by Application 2020 & 2033
- Table 7: Colombia Malaria Diagnostics Industry Revenue (Million) Forecast, by Application 2020 & 2033
- Table 8: Rest of the Americas Malaria Diagnostics Industry Revenue (Million) Forecast, by Application 2020 & 2033
- Table 9: Global Malaria Diagnostics Industry Revenue Million Forecast, by Technology 2020 & 2033
- Table 10: Global Malaria Diagnostics Industry Revenue Million Forecast, by Country 2020 & 2033
- Table 11: Germany Malaria Diagnostics Industry Revenue (Million) Forecast, by Application 2020 & 2033
- Table 12: United Kingdom Malaria Diagnostics Industry Revenue (Million) Forecast, by Application 2020 & 2033
- Table 13: France Malaria Diagnostics Industry Revenue (Million) Forecast, by Application 2020 & 2033
- Table 14: Turkey Malaria Diagnostics Industry Revenue (Million) Forecast, by Application 2020 & 2033
- Table 15: Spain Malaria Diagnostics Industry Revenue (Million) Forecast, by Application 2020 & 2033
- Table 16: Rest of Europe Malaria Diagnostics Industry Revenue (Million) Forecast, by Application 2020 & 2033
- Table 17: Global Malaria Diagnostics Industry Revenue Million Forecast, by Technology 2020 & 2033
- Table 18: Global Malaria Diagnostics Industry Revenue Million Forecast, by Country 2020 & 2033
- Table 19: Global Malaria Diagnostics Industry Revenue Million Forecast, by Technology 2020 & 2033
- Table 20: Global Malaria Diagnostics Industry Revenue Million Forecast, by Country 2020 & 2033
- Table 21: Myanmar Malaria Diagnostics Industry Revenue (Million) Forecast, by Application 2020 & 2033
- Table 22: Indonesia Malaria Diagnostics Industry Revenue (Million) Forecast, by Application 2020 & 2033
- Table 23: Pakistan Malaria Diagnostics Industry Revenue (Million) Forecast, by Application 2020 & 2033
- Table 24: China Malaria Diagnostics Industry Revenue (Million) Forecast, by Application 2020 & 2033
- Table 25: Papua New Guinea Malaria Diagnostics Industry Revenue (Million) Forecast, by Application 2020 & 2033
- Table 26: Cambodia Malaria Diagnostics Industry Revenue (Million) Forecast, by Application 2020 & 2033
- Table 27: Rest of Asia Pacific Malaria Diagnostics Industry Revenue (Million) Forecast, by Application 2020 & 2033
- Table 28: Global Malaria Diagnostics Industry Revenue Million Forecast, by Technology 2020 & 2033
- Table 29: Global Malaria Diagnostics Industry Revenue Million Forecast, by Country 2020 & 2033
- Table 30: Democratic Republic of Congo Malaria Diagnostics Industry Revenue (Million) Forecast, by Application 2020 & 2033
- Table 31: Nigeria Malaria Diagnostics Industry Revenue (Million) Forecast, by Application 2020 & 2033
- Table 32: Uganda Malaria Diagnostics Industry Revenue (Million) Forecast, by Application 2020 & 2033
- Table 33: Rest of Africa Malaria Diagnostics Industry Revenue (Million) Forecast, by Application 2020 & 2033
Frequently Asked Questions
1. What is the projected Compound Annual Growth Rate (CAGR) of the Malaria Diagnostics Industry?
The projected CAGR is approximately 5.23%.
2. Which companies are prominent players in the Malaria Diagnostics Industry?
Key companies in the market include AdvaCare Pharma*List Not Exhaustive, BioMerieux SA, Bio-Rad Laboratories Inc, Nikon Corporation, Siemens Healthineers, Abbott Laboratories, Ortho Clinical Diagnostics, Premier Medical Corporation Pvt Ltd, Advy Chemical Pvt Ltd, Zephyr Biomedicals, Access Bio Inc, Thermo Fisher Scientific.
3. What are the main segments of the Malaria Diagnostics Industry?
The market segments include Technology.
4. Can you provide details about the market size?
The market size is estimated to be USD 0.86 Million as of 2022.
5. What are some drivers contributing to market growth?
Growing Demand for Diagnostic Tools in Malaria-endemic Regions; Increasing Technological Advancements and Efficient Diagnostics; Scale-up of Rapid Diagnostic Tests and Universal Access to Diagnosis.
6. What are the notable trends driving market growth?
Microscopic Diagnostics is Expected to Hold the Highest Market Share in the Technology Segment.
7. Are there any restraints impacting market growth?
Increasing Number of Malaria-free Countries; Rising Demand for Low-cost Diagnostic Tools.
8. Can you provide examples of recent developments in the market?
In June 2022, SC Johnson and Global Fund partnered to eradicate malaria. The Global Fund provides 56% of all international financing for malaria programs (39% of total available resources) and invested more than USD 16 billion in malaria control programs to date.
9. What pricing options are available for accessing the report?
Pricing options include single-user, multi-user, and enterprise licenses priced at USD 4750, USD 5250, and USD 8750 respectively.
10. Is the market size provided in terms of value or volume?
The market size is provided in terms of value, measured in Million.
11. Are there any specific market keywords associated with the report?
Yes, the market keyword associated with the report is "Malaria Diagnostics Industry," which aids in identifying and referencing the specific market segment covered.
12. How do I determine which pricing option suits my needs best?
The pricing options vary based on user requirements and access needs. Individual users may opt for single-user licenses, while businesses requiring broader access may choose multi-user or enterprise licenses for cost-effective access to the report.
13. Are there any additional resources or data provided in the Malaria Diagnostics Industry report?
While the report offers comprehensive insights, it's advisable to review the specific contents or supplementary materials provided to ascertain if additional resources or data are available.
14. How can I stay updated on further developments or reports in the Malaria Diagnostics Industry?
To stay informed about further developments, trends, and reports in the Malaria Diagnostics Industry, consider subscribing to industry newsletters, following relevant companies and organizations, or regularly checking reputable industry news sources and publications.
Methodology
Step 1 - Identification of Relevant Samples Size from Population Database


Step 2 - Approaches for Defining Global Market Size (Value, Volume* & Price*)

Note*: In applicable scenarios
Step 3 - Data Sources
Primary Research
- Web Analytics
- Survey Reports
- Research Institute
- Latest Research Reports
- Opinion Leaders
Secondary Research
- Annual Reports
- White Paper
- Latest Press Release
- Industry Association
- Paid Database
- Investor Presentations

Step 4 - Data Triangulation
Involves using different sources of information in order to increase the validity of a study
These sources are likely to be stakeholders in a program - participants, other researchers, program staff, other community members, and so on.
Then we put all data in single framework & apply various statistical tools to find out the dynamic on the market.
During the analysis stage, feedback from the stakeholder groups would be compared to determine areas of agreement as well as areas of divergence