

Key Insights
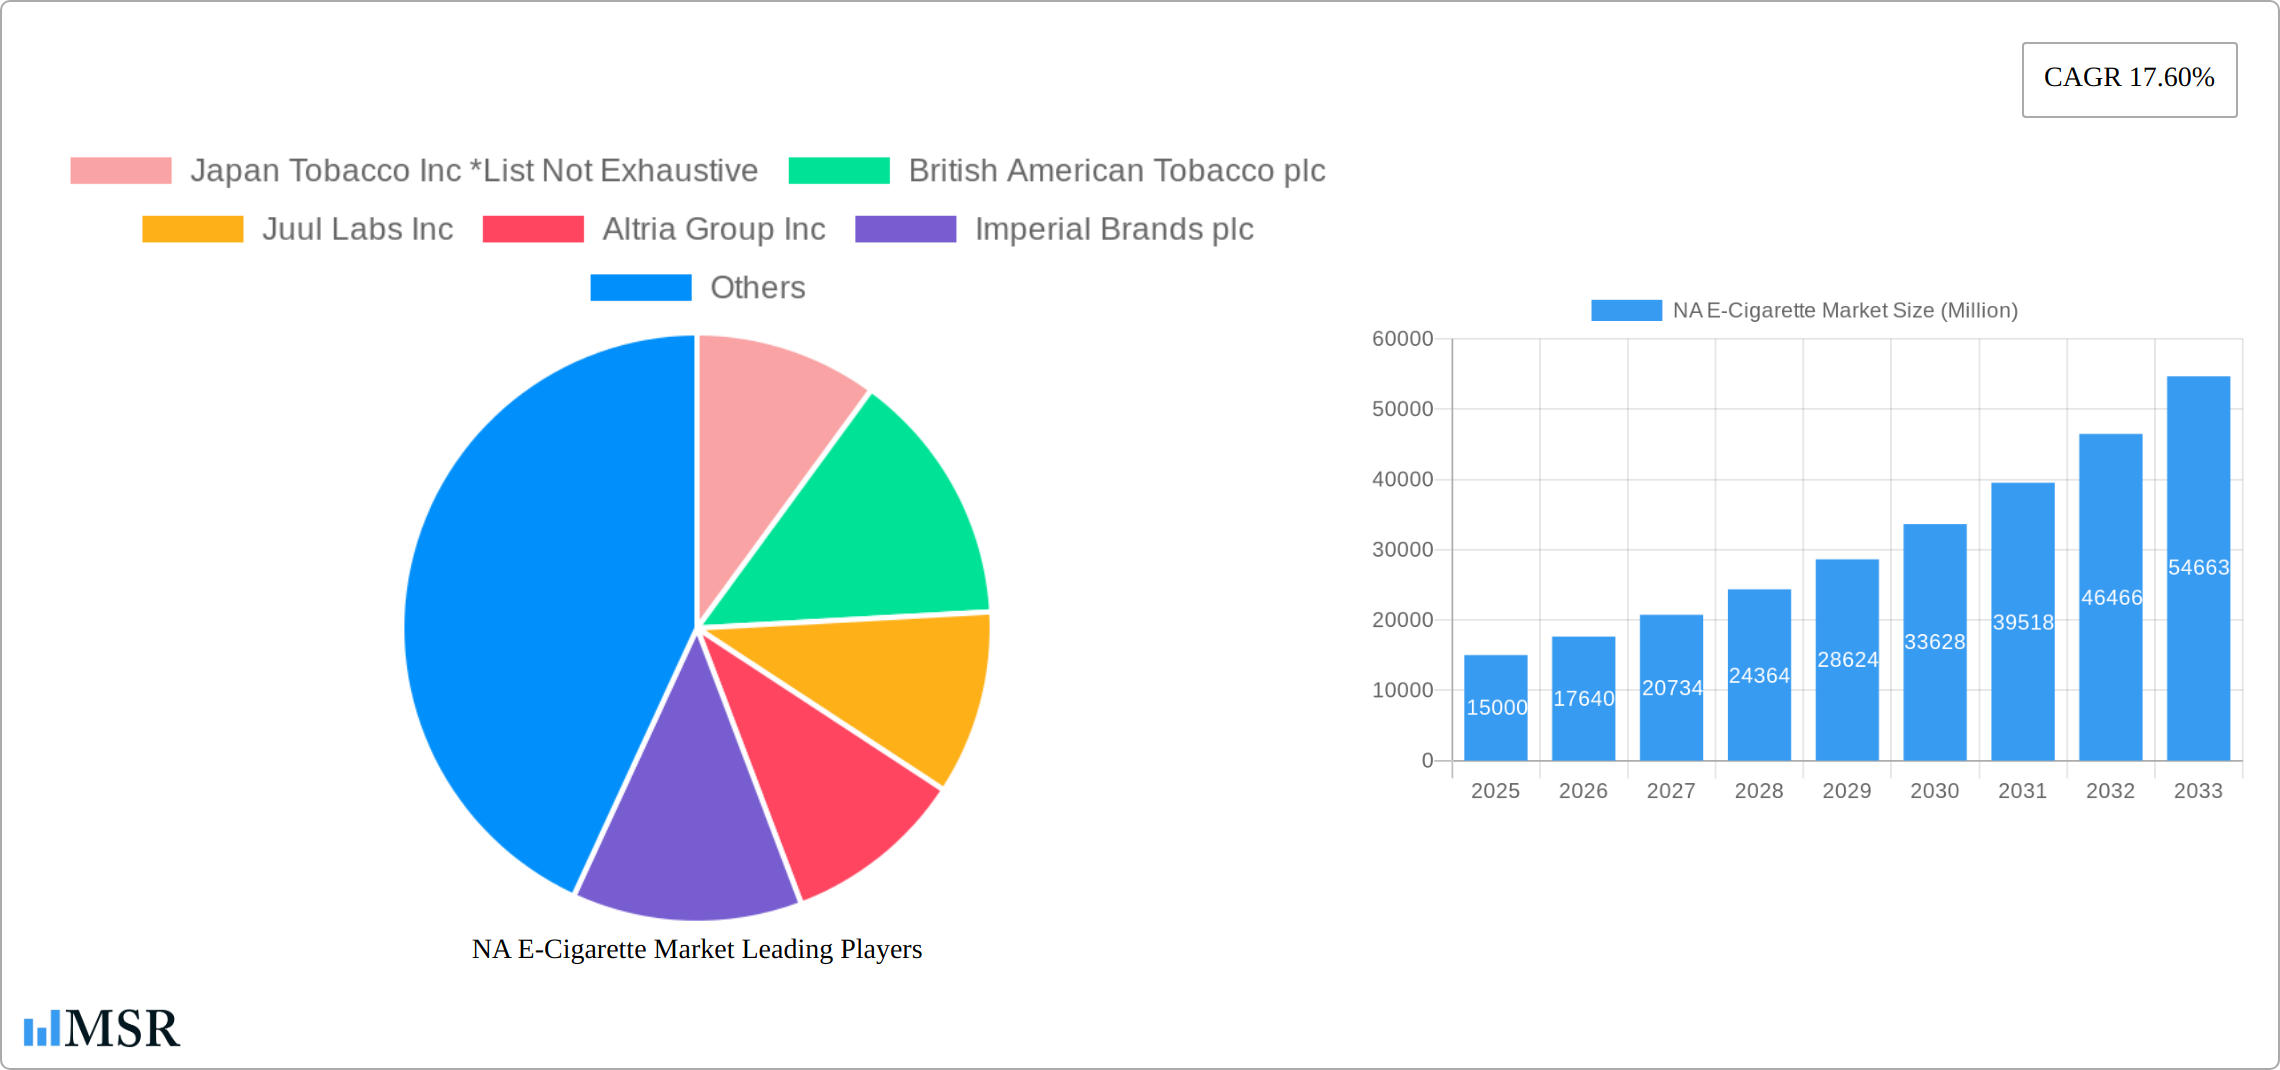
The North American e-cigarette market, a significant segment of the global industry experiencing a Compound Annual Growth Rate (CAGR) of 17.60%, is poised for substantial growth between 2025 and 2033. Driven by increasing awareness of vaping as a potential alternative to traditional cigarettes, coupled with continuous innovation in product design and flavor profiles, the market is witnessing a surge in adoption among adult smokers. The market segmentation reveals a strong preference for both completely disposable models and rechargeable but disposable cartomizers, indicating a diverse consumer base with varying needs and preferences. While regulatory hurdles and public health concerns present challenges, the market's growth is also fueled by the introduction of advanced vaping technologies like personalized vaporizers offering greater customization and control. The prevalence of established players such as Japan Tobacco Inc., British American Tobacco plc, and Juul Labs Inc. further signifies the market's maturity and potential for further expansion. Competition within the sector is intense, pushing companies to innovate constantly and offer products that cater to the evolving demands of consumers. Within North America, the United States, as the largest market, is expected to drive the majority of the regional growth, followed by Canada and Mexico.
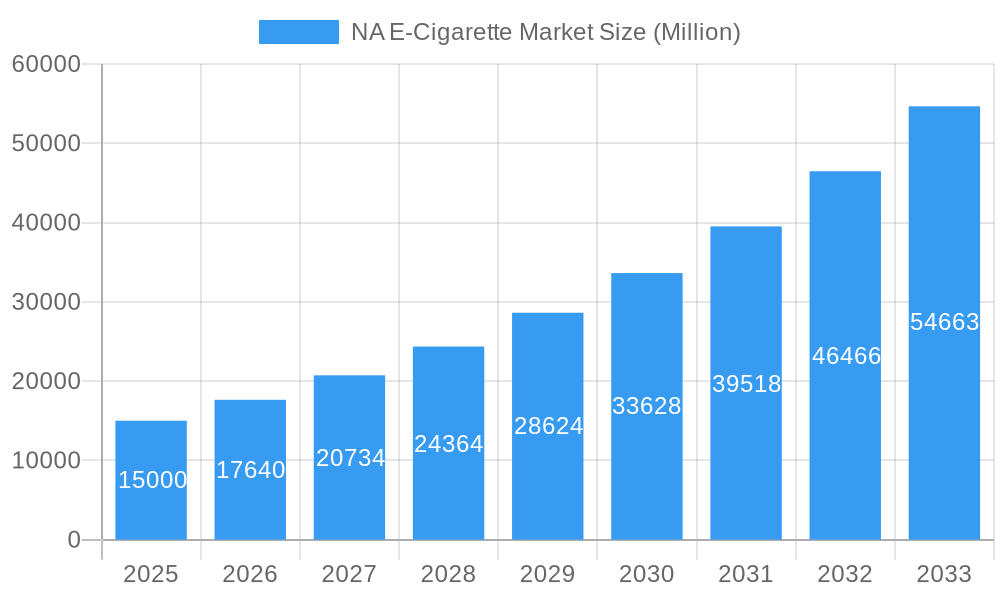
NA E-Cigarette Market Market Size (In Billion)
The growth trajectory is projected to remain robust throughout the forecast period, fueled by a combination of factors. Technological advancements continue to refine vaping devices, leading to more efficient and satisfying experiences for users. Marketing and advertising strategies, while subject to stringent regulations, continue to play a significant role in shaping consumer perception and driving adoption. However, the long-term sustainability of growth hinges on effective regulatory frameworks that balance public health concerns with the market's economic potential. Maintaining a focus on responsible marketing practices and transparent product information will be crucial in fostering consumer trust and building a sustainable future for the North American e-cigarette market. The ongoing evolution of consumer preferences and the emergence of new technologies will undoubtedly influence the market's dynamics over the coming years.
NA E-Cigarette Market Company Market Share
North America E-Cigarette Market Report: 2019-2033
This comprehensive report provides a deep dive into the North America e-cigarette market, offering invaluable insights for industry stakeholders, investors, and strategic decision-makers. Covering the period from 2019 to 2033, with a focus on 2025, this analysis unveils market dynamics, growth drivers, and future opportunities within this rapidly evolving sector. The report leverages robust data and expert analysis to provide a complete understanding of the NA e-cigarette landscape. Key segments analyzed include Automatic and Manual E-cigarettes, and product types like Completely Disposable Models, Rechargeable but Disposable Cartomizers, and Personalized Vaporizers. Leading players such as Japan Tobacco Inc, British American Tobacco plc, Juul Labs Inc, Altria Group Inc, and Imperial Brands plc are profiled, offering a competitive landscape assessment.
NA E-Cigarette Market Concentration & Dynamics
The North American e-cigarette market exhibits a moderately concentrated structure, with a few major players holding significant market share. The market share distribution in 2025 is estimated as follows: Top 5 players hold approximately 65% of the market, while the remaining 35% is fragmented amongst numerous smaller players. The market is characterized by a dynamic innovation ecosystem, with continuous advancements in e-cigarette technology, flavors, and delivery systems. Regulatory frameworks, constantly evolving at both federal and state levels, play a crucial role in shaping market dynamics and influencing consumer behavior. Substitute products, such as traditional cigarettes and other nicotine delivery systems, pose a competitive challenge. End-user trends, including shifting preferences towards specific device types and flavors, significantly influence market demand.
- Mergers & Acquisitions (M&A): The period 2019-2024 witnessed approximately xx M&A deals in the North American e-cigarette sector, primarily driven by consolidation efforts and expansion strategies of major players. The number is projected to increase to xx deals between 2025 and 2033.
- Market Share Concentration: The Herfindahl-Hirschman Index (HHI) for the NA e-cigarette market is estimated to be xx in 2025, suggesting a moderately concentrated market structure.
NA E-Cigarette Market Industry Insights & Trends
The North American e-cigarette market experienced significant growth during the historical period (2019-2024), driven by factors such as increasing awareness of e-cigarettes as a less harmful alternative to traditional cigarettes and changing consumer preferences for vaping. The market size in 2024 reached approximately $XX Million and is projected to reach $XX Million in 2025, exhibiting a Compound Annual Growth Rate (CAGR) of xx% during the forecast period (2025-2033). Several factors are driving this growth, including technological advancements, such as the introduction of innovative product designs and features, enhancing the overall vaping experience. Evolving consumer behavior, with a growing preference for convenient and aesthetically pleasing devices, also fuels the market expansion. Regulatory changes impacting product availability and marketing strategies will continue to shape market trends. The introduction of novel nicotine delivery systems and flavors further expands market possibilities. The increase in disposable e-cigarette adoption significantly contributed to the market growth in recent years. This trend is further fueled by the popularity of different flavors and the introduction of innovative vaping technology.
Key Markets & Segments Leading NA E-Cigarette Market
The North American e-cigarette market is a dynamic landscape, with several key segments and geographic regions driving growth. The completely disposable e-cigarette segment currently holds the largest market share, fueled by its affordability and unparalleled convenience. This segment is projected for substantial growth throughout the forecast period. Simultaneously, the automatic e-cigarette segment is gaining significant traction, appealing to users seeking a simple and user-friendly vaping experience. Geographically, the Western United States remains the dominant market within North America.
- Drivers for Completely Disposable E-cigarette Segment:
- Unbeatable Affordability: Lower upfront costs compared to refillable or rechargeable alternatives attract budget-conscious consumers.
- Ultimate Convenience: Eliminates the need for charging, refilling, or maintenance, simplifying the vaping experience.
- Extensive Variety: A wide array of flavors and nicotine strengths caters to diverse consumer preferences.
- Reduced Perceived Risk: The disposable nature minimizes the long-term commitment, encouraging trial and adoption.
- Drivers for Automatic E-cigarette Segment:
- Effortless User Experience: Ideal for novice vapers seeking simplicity and ease of use.
- Enhanced Satisfaction: Consistent and reliable vaping performance contributes to a more enjoyable experience.
- Continuous Technological Innovation: Ongoing advancements in battery technology and integrated features enhance performance and user experience.
- Improved Safety Features: Many automatic devices incorporate safety mechanisms like overheat protection, further appealing to safety-conscious consumers.
- Regional Dominance (Western USA):
- High Disposable Income: A significant portion of the population has higher discretionary spending, contributing to a robust market.
- Mature Retail Infrastructure: Well-established distribution channels and a vast retail network ensure widespread product availability.
- Early Adoption of Trends: The region has historically shown a propensity to adopt new technologies and trends quickly.
- Pro-vaping consumer sentiment (in some areas): Certain areas within the Western US might display a more accepting attitude towards vaping.
NA E-Cigarette Market Product Developments
Recent years have witnessed significant product innovations in the North American e-cigarette market. Manufacturers are focusing on developing devices with enhanced battery life, improved flavor delivery, and advanced temperature control. The integration of smart features, such as mobile app connectivity and personalized vaping profiles, enhances user experience. Disposable e-cigarettes with improved designs and a wider variety of flavors have also gained considerable popularity. These technological advancements offer manufacturers a competitive edge and cater to the evolving preferences of consumers.
Challenges in the NA E-Cigarette Market Market
The North American e-cigarette market faces several challenges, including stringent regulatory hurdles that restrict product development, marketing, and sales. These regulations have significantly impacted market growth. Supply chain disruptions and fluctuating raw material costs present additional obstacles. Intense competition amongst established players and new entrants creates price pressure and limits profitability. These factors collectively impose a significant constraint on market expansion and long-term growth. Estimated financial impact from these challenges is xx Million annually.
Forces Driving NA E-Cigarette Market Growth
The NA e-cigarette market is driven by several factors. Technological advancements, such as the development of more efficient and user-friendly devices, are key growth catalysts. The increasing adoption of e-cigarettes as a harm-reduction strategy further propels market growth. Favorable consumer preferences for various flavors and nicotine strengths contribute to market expansion. Despite regulatory challenges, the evolving regulatory landscape is also facilitating market growth through clarification and standardization. Furthermore, the growing number of vaping enthusiasts and the increased acceptability of vaping in specific demographics further drive market expansion.
Long-Term Growth Catalysts in the NA E-Cigarette Market
Long-term growth in the North American e-cigarette market will be fueled by continuous innovation in device technology, including the development of advanced heating elements and improved battery technology. Strategic partnerships between e-cigarette manufacturers and healthcare providers could further expand market reach and increase consumer confidence. The potential expansion into new markets and demographics, such as those seeking nicotine replacement therapy, will significantly influence market growth. These factors collectively position the market for sustained, long-term growth.
Emerging Opportunities in NA E-Cigarette Market
Emerging opportunities in the NA e-cigarette market lie in the development of new and innovative nicotine delivery systems, such as pod-based systems and disposable vapes with enhanced flavor profiles. The growing demand for personalized vaping experiences will drive the development of smart devices with features such as mobile app connectivity and customized settings. Exploring new market segments, such as adult smokers seeking to reduce their cigarette consumption, represents a significant area of opportunity. Targeting specific consumer needs and preferences, such as offering nicotine-free options and health-conscious alternatives, will unlock further growth avenues.
Leading Players in the NA E-Cigarette Market Sector
Key Milestones in NA E-Cigarette Market Industry
- 2019: Increased regulatory scrutiny and flavor restrictions implemented in several states.
- 2020: Rise in popularity of disposable e-cigarettes.
- 2021: Several key mergers and acquisitions activity reshape the market landscape.
- 2022: Continued technological advancements in e-cigarette technology.
- 2023: Focus on harm reduction strategies and innovative product development.
- 2024: Further regulatory changes and market consolidation.
Strategic Outlook for NA E-Cigarette Market Market
The future of the North American e-cigarette market appears promising, driven by ongoing technological advancements, evolving consumer preferences, and strategic initiatives undertaken by key players. The market is poised for significant growth, fueled by the increasing demand for innovative products and the potential expansion into new market segments. Addressing regulatory challenges and ensuring consumer safety will be critical for realizing the full potential of this dynamic market. The continued focus on harm reduction and innovation positions the NA e-cigarette market for considerable expansion in the coming years.
NA E-Cigarette Market Segmentation
-
1. Product
- 1.1. Completely Disposable Model
- 1.2. Rechargeable but Disposable Cartomizer
- 1.3. Personalized Vaporizer
-
2. Battery Mode
- 2.1. Automatic E-Cigarette
- 2.2. Manual E-Cigarette
-
3. Geography
- 3.1. United States
- 3.2. Canada
- 3.3. Rest of North America
NA E-Cigarette Market Segmentation By Geography
- 1. United States
- 2. Canada
- 3. Rest of North America
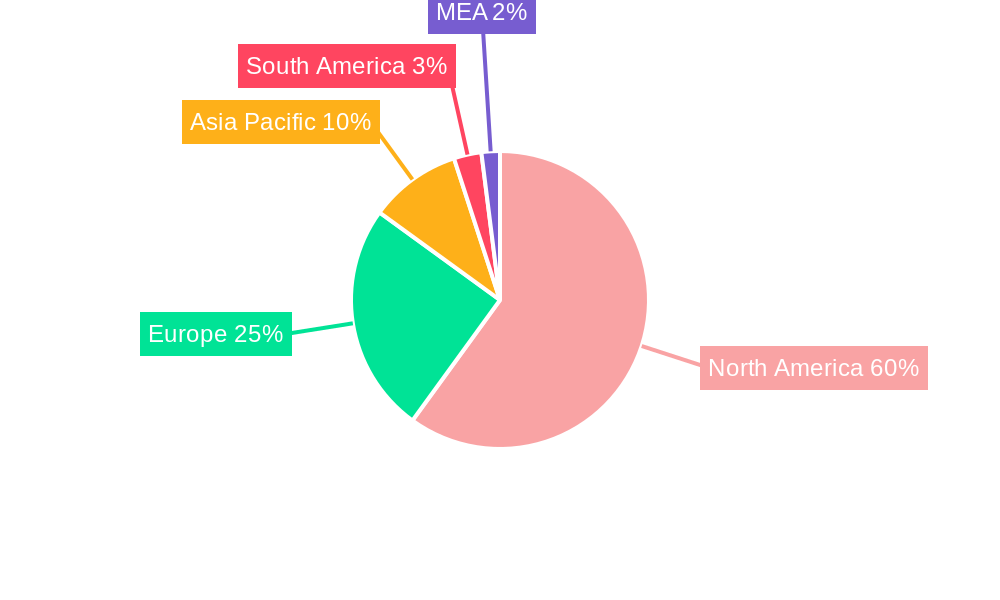
NA E-Cigarette Market Regional Market Share
Geographic Coverage of NA E-Cigarette Market
NA E-Cigarette Market REPORT HIGHLIGHTS
| Aspects | Details |
|---|---|
| Study Period | 2020-2034 |
| Base Year | 2025 |
| Estimated Year | 2026 |
| Forecast Period | 2026-2034 |
| Historical Period | 2020-2025 |
| Growth Rate | CAGR of 17.60% from 2020-2034 |
| Segmentation |
|
Table of Contents
- 1. Introduction
- 1.1. Research Scope
- 1.2. Market Segmentation
- 1.3. Research Objective
- 1.4. Definitions and Assumptions
- 2. Executive Summary
- 2.1. Market Snapshot
- 3. Market Dynamics
- 3.1. Market Drivers
- 3.2. Market Restrains
- 3.3. Market Trends
- 3.4. Market Opportunities
- 4. Market Factor Analysis
- 4.1. Porters Five Forces
- 4.1.1. Bargaining Power of Suppliers
- 4.1.2. Bargaining Power of Buyers
- 4.1.3. Threat of New Entrants
- 4.1.4. Threat of Substitutes
- 4.1.5. Competitive Rivalry
- 4.2. PESTEL analysis
- 4.3. BCG Analysis
- 4.3.1. Stars (High Growth, High Market Share)
- 4.3.2. Cash Cows (Low Growth, High Market Share)
- 4.3.3. Question Mark (High Growth, Low Market Share)
- 4.3.4. Dogs (Low Growth, Low Market Share)
- 4.4. Ansoff Matrix Analysis
- 4.5. Supply Chain Analysis
- 4.6. Regulatory Landscape
- 4.7. Current Market Potential and Opportunity Assessment (TAM–SAM–SOM Framework)
- 4.8. MSR Analyst Note
- 4.1. Porters Five Forces
- 5. Market Analysis, Insights and Forecast 2021-2033
- 5.1. Market Analysis, Insights and Forecast - by Product
- 5.1.1. Completely Disposable Model
- 5.1.2. Rechargeable but Disposable Cartomizer
- 5.1.3. Personalized Vaporizer
- 5.2. Market Analysis, Insights and Forecast - by Battery Mode
- 5.2.1. Automatic E-Cigarette
- 5.2.2. Manual E-Cigarette
- 5.3. Market Analysis, Insights and Forecast - by Geography
- 5.3.1. United States
- 5.3.2. Canada
- 5.3.3. Rest of North America
- 5.4. Market Analysis, Insights and Forecast - by Region
- 5.4.1. United States
- 5.4.2. Canada
- 5.4.3. Rest of North America
- 5.1. Market Analysis, Insights and Forecast - by Product
- 6. Global NA E-Cigarette Market Analysis, Insights and Forecast, 2021-2033
- 6.1. Market Analysis, Insights and Forecast - by Product
- 6.1.1. Completely Disposable Model
- 6.1.2. Rechargeable but Disposable Cartomizer
- 6.1.3. Personalized Vaporizer
- 6.2. Market Analysis, Insights and Forecast - by Battery Mode
- 6.2.1. Automatic E-Cigarette
- 6.2.2. Manual E-Cigarette
- 6.3. Market Analysis, Insights and Forecast - by Geography
- 6.3.1. United States
- 6.3.2. Canada
- 6.3.3. Rest of North America
- 6.1. Market Analysis, Insights and Forecast - by Product
- 7. United States NA E-Cigarette Market Analysis, Insights and Forecast, 2020-2032
- 7.1. Market Analysis, Insights and Forecast - by Product
- 7.1.1. Completely Disposable Model
- 7.1.2. Rechargeable but Disposable Cartomizer
- 7.1.3. Personalized Vaporizer
- 7.2. Market Analysis, Insights and Forecast - by Battery Mode
- 7.2.1. Automatic E-Cigarette
- 7.2.2. Manual E-Cigarette
- 7.3. Market Analysis, Insights and Forecast - by Geography
- 7.3.1. United States
- 7.3.2. Canada
- 7.3.3. Rest of North America
- 7.1. Market Analysis, Insights and Forecast - by Product
- 8. Canada NA E-Cigarette Market Analysis, Insights and Forecast, 2020-2032
- 8.1. Market Analysis, Insights and Forecast - by Product
- 8.1.1. Completely Disposable Model
- 8.1.2. Rechargeable but Disposable Cartomizer
- 8.1.3. Personalized Vaporizer
- 8.2. Market Analysis, Insights and Forecast - by Battery Mode
- 8.2.1. Automatic E-Cigarette
- 8.2.2. Manual E-Cigarette
- 8.3. Market Analysis, Insights and Forecast - by Geography
- 8.3.1. United States
- 8.3.2. Canada
- 8.3.3. Rest of North America
- 8.1. Market Analysis, Insights and Forecast - by Product
- 9. Rest of North America NA E-Cigarette Market Analysis, Insights and Forecast, 2020-2032
- 9.1. Market Analysis, Insights and Forecast - by Product
- 9.1.1. Completely Disposable Model
- 9.1.2. Rechargeable but Disposable Cartomizer
- 9.1.3. Personalized Vaporizer
- 9.2. Market Analysis, Insights and Forecast - by Battery Mode
- 9.2.1. Automatic E-Cigarette
- 9.2.2. Manual E-Cigarette
- 9.3. Market Analysis, Insights and Forecast - by Geography
- 9.3.1. United States
- 9.3.2. Canada
- 9.3.3. Rest of North America
- 9.1. Market Analysis, Insights and Forecast - by Product
- 10. Competitive Analysis
- 10.1. Company Profiles
- 10.1.1 Japan Tobacco Inc *List Not Exhaustive
- 10.1.1.1. Company Overview
- 10.1.1.2. Products
- 10.1.1.3. Company Financials
- 10.1.1.4. SWOT Analysis
- 10.1.2 British American Tobacco plc
- 10.1.2.1. Company Overview
- 10.1.2.2. Products
- 10.1.2.3. Company Financials
- 10.1.2.4. SWOT Analysis
- 10.1.3 Juul Labs Inc
- 10.1.3.1. Company Overview
- 10.1.3.2. Products
- 10.1.3.3. Company Financials
- 10.1.3.4. SWOT Analysis
- 10.1.4 Altria Group Inc
- 10.1.4.1. Company Overview
- 10.1.4.2. Products
- 10.1.4.3. Company Financials
- 10.1.4.4. SWOT Analysis
- 10.1.5 Imperial Brands plc
- 10.1.5.1. Company Overview
- 10.1.5.2. Products
- 10.1.5.3. Company Financials
- 10.1.5.4. SWOT Analysis
- 10.1.1 Japan Tobacco Inc *List Not Exhaustive
- 10.2. Market Entropy
- 10.2.1 Company's Key Areas Served
- 10.2.2 Recent Developments
- 10.3. Company Market Share Analysis 2025
- 10.3.1 Top 5 Companies Market Share Analysis
- 10.3.2 Top 3 Companies Market Share Analysis
- 10.4. List of Potential Customers
- 11. Research Methodology
List of Figures
- Figure 1: Global NA E-Cigarette Market Revenue Breakdown (Million, %) by Region 2025 & 2033
- Figure 2: Global NA E-Cigarette Market Volume Breakdown (K Units, %) by Region 2025 & 2033
- Figure 3: United States NA E-Cigarette Market Revenue (Million), by Product 2025 & 2033
- Figure 4: United States NA E-Cigarette Market Volume (K Units), by Product 2025 & 2033
- Figure 5: United States NA E-Cigarette Market Revenue Share (%), by Product 2025 & 2033
- Figure 6: United States NA E-Cigarette Market Volume Share (%), by Product 2025 & 2033
- Figure 7: United States NA E-Cigarette Market Revenue (Million), by Battery Mode 2025 & 2033
- Figure 8: United States NA E-Cigarette Market Volume (K Units), by Battery Mode 2025 & 2033
- Figure 9: United States NA E-Cigarette Market Revenue Share (%), by Battery Mode 2025 & 2033
- Figure 10: United States NA E-Cigarette Market Volume Share (%), by Battery Mode 2025 & 2033
- Figure 11: United States NA E-Cigarette Market Revenue (Million), by Geography 2025 & 2033
- Figure 12: United States NA E-Cigarette Market Volume (K Units), by Geography 2025 & 2033
- Figure 13: United States NA E-Cigarette Market Revenue Share (%), by Geography 2025 & 2033
- Figure 14: United States NA E-Cigarette Market Volume Share (%), by Geography 2025 & 2033
- Figure 15: United States NA E-Cigarette Market Revenue (Million), by Country 2025 & 2033
- Figure 16: United States NA E-Cigarette Market Volume (K Units), by Country 2025 & 2033
- Figure 17: United States NA E-Cigarette Market Revenue Share (%), by Country 2025 & 2033
- Figure 18: United States NA E-Cigarette Market Volume Share (%), by Country 2025 & 2033
- Figure 19: Canada NA E-Cigarette Market Revenue (Million), by Product 2025 & 2033
- Figure 20: Canada NA E-Cigarette Market Volume (K Units), by Product 2025 & 2033
- Figure 21: Canada NA E-Cigarette Market Revenue Share (%), by Product 2025 & 2033
- Figure 22: Canada NA E-Cigarette Market Volume Share (%), by Product 2025 & 2033
- Figure 23: Canada NA E-Cigarette Market Revenue (Million), by Battery Mode 2025 & 2033
- Figure 24: Canada NA E-Cigarette Market Volume (K Units), by Battery Mode 2025 & 2033
- Figure 25: Canada NA E-Cigarette Market Revenue Share (%), by Battery Mode 2025 & 2033
- Figure 26: Canada NA E-Cigarette Market Volume Share (%), by Battery Mode 2025 & 2033
- Figure 27: Canada NA E-Cigarette Market Revenue (Million), by Geography 2025 & 2033
- Figure 28: Canada NA E-Cigarette Market Volume (K Units), by Geography 2025 & 2033
- Figure 29: Canada NA E-Cigarette Market Revenue Share (%), by Geography 2025 & 2033
- Figure 30: Canada NA E-Cigarette Market Volume Share (%), by Geography 2025 & 2033
- Figure 31: Canada NA E-Cigarette Market Revenue (Million), by Country 2025 & 2033
- Figure 32: Canada NA E-Cigarette Market Volume (K Units), by Country 2025 & 2033
- Figure 33: Canada NA E-Cigarette Market Revenue Share (%), by Country 2025 & 2033
- Figure 34: Canada NA E-Cigarette Market Volume Share (%), by Country 2025 & 2033
- Figure 35: Rest of North America NA E-Cigarette Market Revenue (Million), by Product 2025 & 2033
- Figure 36: Rest of North America NA E-Cigarette Market Volume (K Units), by Product 2025 & 2033
- Figure 37: Rest of North America NA E-Cigarette Market Revenue Share (%), by Product 2025 & 2033
- Figure 38: Rest of North America NA E-Cigarette Market Volume Share (%), by Product 2025 & 2033
- Figure 39: Rest of North America NA E-Cigarette Market Revenue (Million), by Battery Mode 2025 & 2033
- Figure 40: Rest of North America NA E-Cigarette Market Volume (K Units), by Battery Mode 2025 & 2033
- Figure 41: Rest of North America NA E-Cigarette Market Revenue Share (%), by Battery Mode 2025 & 2033
- Figure 42: Rest of North America NA E-Cigarette Market Volume Share (%), by Battery Mode 2025 & 2033
- Figure 43: Rest of North America NA E-Cigarette Market Revenue (Million), by Geography 2025 & 2033
- Figure 44: Rest of North America NA E-Cigarette Market Volume (K Units), by Geography 2025 & 2033
- Figure 45: Rest of North America NA E-Cigarette Market Revenue Share (%), by Geography 2025 & 2033
- Figure 46: Rest of North America NA E-Cigarette Market Volume Share (%), by Geography 2025 & 2033
- Figure 47: Rest of North America NA E-Cigarette Market Revenue (Million), by Country 2025 & 2033
- Figure 48: Rest of North America NA E-Cigarette Market Volume (K Units), by Country 2025 & 2033
- Figure 49: Rest of North America NA E-Cigarette Market Revenue Share (%), by Country 2025 & 2033
- Figure 50: Rest of North America NA E-Cigarette Market Volume Share (%), by Country 2025 & 2033
List of Tables
- Table 1: Global NA E-Cigarette Market Revenue Million Forecast, by Product 2020 & 2033
- Table 2: Global NA E-Cigarette Market Volume K Units Forecast, by Product 2020 & 2033
- Table 3: Global NA E-Cigarette Market Revenue Million Forecast, by Battery Mode 2020 & 2033
- Table 4: Global NA E-Cigarette Market Volume K Units Forecast, by Battery Mode 2020 & 2033
- Table 5: Global NA E-Cigarette Market Revenue Million Forecast, by Geography 2020 & 2033
- Table 6: Global NA E-Cigarette Market Volume K Units Forecast, by Geography 2020 & 2033
- Table 7: Global NA E-Cigarette Market Revenue Million Forecast, by Region 2020 & 2033
- Table 8: Global NA E-Cigarette Market Volume K Units Forecast, by Region 2020 & 2033
- Table 9: Global NA E-Cigarette Market Revenue Million Forecast, by Product 2020 & 2033
- Table 10: Global NA E-Cigarette Market Volume K Units Forecast, by Product 2020 & 2033
- Table 11: Global NA E-Cigarette Market Revenue Million Forecast, by Battery Mode 2020 & 2033
- Table 12: Global NA E-Cigarette Market Volume K Units Forecast, by Battery Mode 2020 & 2033
- Table 13: Global NA E-Cigarette Market Revenue Million Forecast, by Geography 2020 & 2033
- Table 14: Global NA E-Cigarette Market Volume K Units Forecast, by Geography 2020 & 2033
- Table 15: Global NA E-Cigarette Market Revenue Million Forecast, by Country 2020 & 2033
- Table 16: Global NA E-Cigarette Market Volume K Units Forecast, by Country 2020 & 2033
- Table 17: Global NA E-Cigarette Market Revenue Million Forecast, by Product 2020 & 2033
- Table 18: Global NA E-Cigarette Market Volume K Units Forecast, by Product 2020 & 2033
- Table 19: Global NA E-Cigarette Market Revenue Million Forecast, by Battery Mode 2020 & 2033
- Table 20: Global NA E-Cigarette Market Volume K Units Forecast, by Battery Mode 2020 & 2033
- Table 21: Global NA E-Cigarette Market Revenue Million Forecast, by Geography 2020 & 2033
- Table 22: Global NA E-Cigarette Market Volume K Units Forecast, by Geography 2020 & 2033
- Table 23: Global NA E-Cigarette Market Revenue Million Forecast, by Country 2020 & 2033
- Table 24: Global NA E-Cigarette Market Volume K Units Forecast, by Country 2020 & 2033
- Table 25: Global NA E-Cigarette Market Revenue Million Forecast, by Product 2020 & 2033
- Table 26: Global NA E-Cigarette Market Volume K Units Forecast, by Product 2020 & 2033
- Table 27: Global NA E-Cigarette Market Revenue Million Forecast, by Battery Mode 2020 & 2033
- Table 28: Global NA E-Cigarette Market Volume K Units Forecast, by Battery Mode 2020 & 2033
- Table 29: Global NA E-Cigarette Market Revenue Million Forecast, by Geography 2020 & 2033
- Table 30: Global NA E-Cigarette Market Volume K Units Forecast, by Geography 2020 & 2033
- Table 31: Global NA E-Cigarette Market Revenue Million Forecast, by Country 2020 & 2033
- Table 32: Global NA E-Cigarette Market Volume K Units Forecast, by Country 2020 & 2033
Frequently Asked Questions
1. What is the projected Compound Annual Growth Rate (CAGR) of the NA E-Cigarette Market?
The projected CAGR is approximately 17.60%.
2. Which companies are prominent players in the NA E-Cigarette Market?
Key companies in the market include Japan Tobacco Inc *List Not Exhaustive, British American Tobacco plc, Juul Labs Inc, Altria Group Inc, Imperial Brands plc.
3. What are the main segments of the NA E-Cigarette Market?
The market segments include Product, Battery Mode, Geography.
4. Can you provide details about the market size?
The market size is estimated to be USD XX Million as of 2022.
5. What are some drivers contributing to market growth?
Aggressive Social Media Marketing; Lower-risk Factor Associated with the Use of E-Cigarettes Compared to Conventional/Combustible Cigarettes.
6. What are the notable trends driving market growth?
Rising consumption by the young population.
7. Are there any restraints impacting market growth?
Government Initiatives to Ban Disposable E-Cigarettes.
8. Can you provide examples of recent developments in the market?
N/A
9. What pricing options are available for accessing the report?
Pricing options include single-user, multi-user, and enterprise licenses priced at USD 4750, USD 5250, and USD 8750 respectively.
10. Is the market size provided in terms of value or volume?
The market size is provided in terms of value, measured in Million and volume, measured in K Units.
11. Are there any specific market keywords associated with the report?
Yes, the market keyword associated with the report is "NA E-Cigarette Market," which aids in identifying and referencing the specific market segment covered.
12. How do I determine which pricing option suits my needs best?
The pricing options vary based on user requirements and access needs. Individual users may opt for single-user licenses, while businesses requiring broader access may choose multi-user or enterprise licenses for cost-effective access to the report.
13. Are there any additional resources or data provided in the NA E-Cigarette Market report?
While the report offers comprehensive insights, it's advisable to review the specific contents or supplementary materials provided to ascertain if additional resources or data are available.
14. How can I stay updated on further developments or reports in the NA E-Cigarette Market?
To stay informed about further developments, trends, and reports in the NA E-Cigarette Market, consider subscribing to industry newsletters, following relevant companies and organizations, or regularly checking reputable industry news sources and publications.
Methodology
Step 1 - Identification of Relevant Samples Size from Population Database


Step 2 - Approaches for Defining Global Market Size (Value, Volume* & Price*)

Note*: In applicable scenarios
Step 3 - Data Sources
Primary Research
- Web Analytics
- Survey Reports
- Research Institute
- Latest Research Reports
- Opinion Leaders
Secondary Research
- Annual Reports
- White Paper
- Latest Press Release
- Industry Association
- Paid Database
- Investor Presentations

Step 4 - Data Triangulation
Involves using different sources of information in order to increase the validity of a study
These sources are likely to be stakeholders in a program - participants, other researchers, program staff, other community members, and so on.
Then we put all data in single framework & apply various statistical tools to find out the dynamic on the market.
During the analysis stage, feedback from the stakeholder groups would be compared to determine areas of agreement as well as areas of divergence