

Key Insights
The global Network Visibility Tool market is poised for substantial expansion, projected to reach $15 billion in 2025 and grow at a robust CAGR of 12% through 2033. This significant growth is primarily fueled by the escalating complexity of modern IT infrastructures, the increasing adoption of cloud services, and the paramount need for enhanced cybersecurity measures. Businesses across all sectors are recognizing the critical importance of real-time monitoring and deep insights into network traffic and performance to proactively identify and mitigate threats, optimize resource allocation, and ensure seamless operations. The proliferation of sophisticated cyberattacks, coupled with stringent regulatory compliance demands, further accentuates the indispensable role of network visibility tools in safeguarding sensitive data and maintaining business continuity. The market's trajectory is also shaped by the growing trend of digital transformation initiatives, where robust network oversight is fundamental to successful implementation and sustained performance.
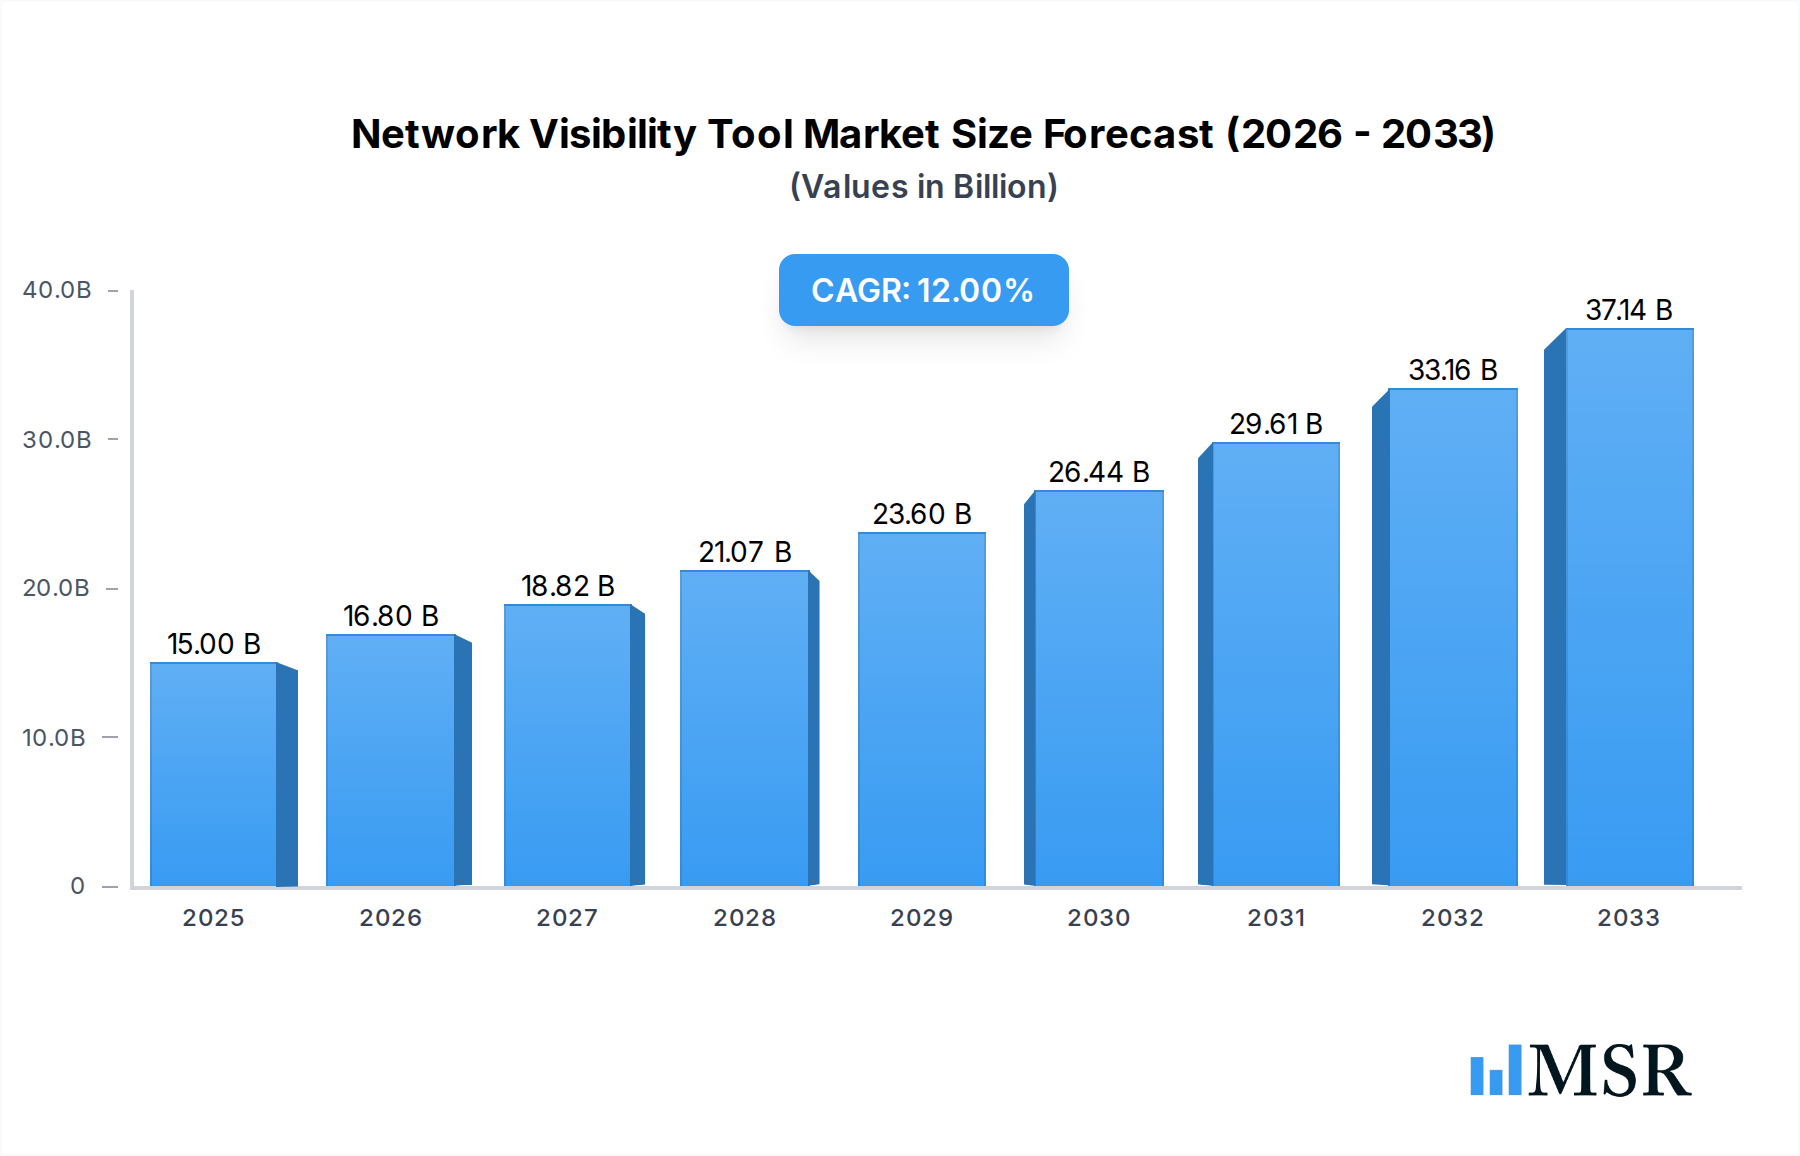
Network Visibility Tool Market Size (In Billion)
The market landscape is characterized by a dynamic interplay of factors, with the increasing demand from large enterprises for comprehensive security and performance management solutions serving as a major driver. Simultaneously, Small and Medium-sized Enterprises (SMEs) are increasingly adopting cloud-based network visibility solutions due to their cost-effectiveness and scalability, democratizing access to advanced network monitoring capabilities. Key market trends include the integration of AI and machine learning for predictive analytics and automated threat detection, the rise of Software-Defined Networking (SDN) and Network Functions Virtualization (NFV) necessitating enhanced visibility, and the growing emphasis on application performance monitoring (APM) to ensure optimal end-user experiences. Despite these growth catalysts, potential restraints such as the high initial investment costs for some advanced solutions and the scarcity of skilled cybersecurity professionals could temper the pace of adoption in certain segments. However, the continuous innovation in tool capabilities and the increasing awareness of the ROI associated with effective network visibility are expected to outweigh these challenges.

Network Visibility Tool Company Market Share
Unveiling the Future of Network Visibility Tools: A Comprehensive Market Analysis (2019-2033)
This in-depth report provides an unparalleled analysis of the global Network Visibility Tool market, charting its trajectory from historical performance (2019-2024) through the estimated 2025 landscape and forecasting its evolution until 2033. With a base year of 2025, this study delivers actionable insights for industry stakeholders navigating this dynamic sector. We dissect market concentration, identify key growth drivers, explore emerging opportunities, and spotlight leading players, offering a holistic view of a market projected to reach billions in valuation. This report is designed for immediate use, requiring no further modification, and is a crucial resource for understanding the strategies, innovations, and competitive forces shaping network performance management.
Network Visibility Tool Market Concentration & Dynamics
The Network Visibility Tool market exhibits a moderate to high level of concentration, driven by a blend of established cybersecurity giants and specialized network performance monitoring vendors. The innovation ecosystem is robust, with companies continuously investing billions in Research and Development to address evolving threat landscapes and increasing network complexity. Regulatory frameworks, particularly those pertaining to data privacy and cybersecurity compliance, play a significant role in shaping product development and market access, with compliance investments estimated in the billions annually. Substitute products, such as integrated IT management suites, present a competitive challenge, though dedicated network visibility tools maintain a distinct advantage in specialized functionalities. End-user trends lean towards unified visibility platforms, cloud-agnostic solutions, and AI-driven analytics, prompting billions in R&D for advanced features. Mergers and Acquisitions (M&A) activities, though sporadic, are significant, with deals valued in the billions, indicating strategic consolidation and a drive for market share expansion. The number of significant M&A deals is projected to reach xx by 2028.
Network Visibility Tool Industry Insights & Trends
The global Network Visibility Tool market is poised for substantial growth, driven by an escalating demand for real-time network monitoring, enhanced cybersecurity, and optimized application performance. The market size in 2025 is estimated at a commanding xx billion, with a projected Compound Annual Growth Rate (CAGR) of xx% from 2025 to 2033. This robust growth is fueled by several key factors. The increasing adoption of cloud computing and hybrid IT environments necessitates sophisticated tools to maintain visibility across distributed infrastructures. Furthermore, the proliferation of IoT devices and the exponential rise in data traffic contribute to network complexity, demanding advanced visibility solutions to manage performance and troubleshoot issues efficiently. Cybersecurity threats are becoming more sophisticated, driving the need for proactive network monitoring to detect and mitigate breaches in real-time, with security investments in this area expected to reach billions. Technological disruptions, including the integration of Artificial Intelligence (AI) and Machine Learning (ML) for predictive analytics, anomaly detection, and automated issue resolution, are transforming the market. These advancements enable businesses to move beyond reactive troubleshooting to proactive network management, preventing downtime and ensuring seamless user experiences. Evolving consumer behaviors, characterized by an expectation of uninterrupted service and high-performance applications, further amplify the demand for robust network visibility. Businesses across all sectors are recognizing network visibility as a critical component of their operational resilience and competitive advantage, leading to increased investment in these solutions, with global spending on network visibility tools projected to exceed billions by the forecast period. The rise of Software-Defined Networking (SDN) and Network Function Virtualization (NFV) also presents new opportunities and challenges, requiring visibility tools that can adapt to dynamic and programmable network infrastructures. The ongoing digital transformation across industries, coupled with the growing adoption of remote work models, further intensifies the need for comprehensive and agile network visibility solutions.
Key Markets & Segments Leading Network Visibility Tool
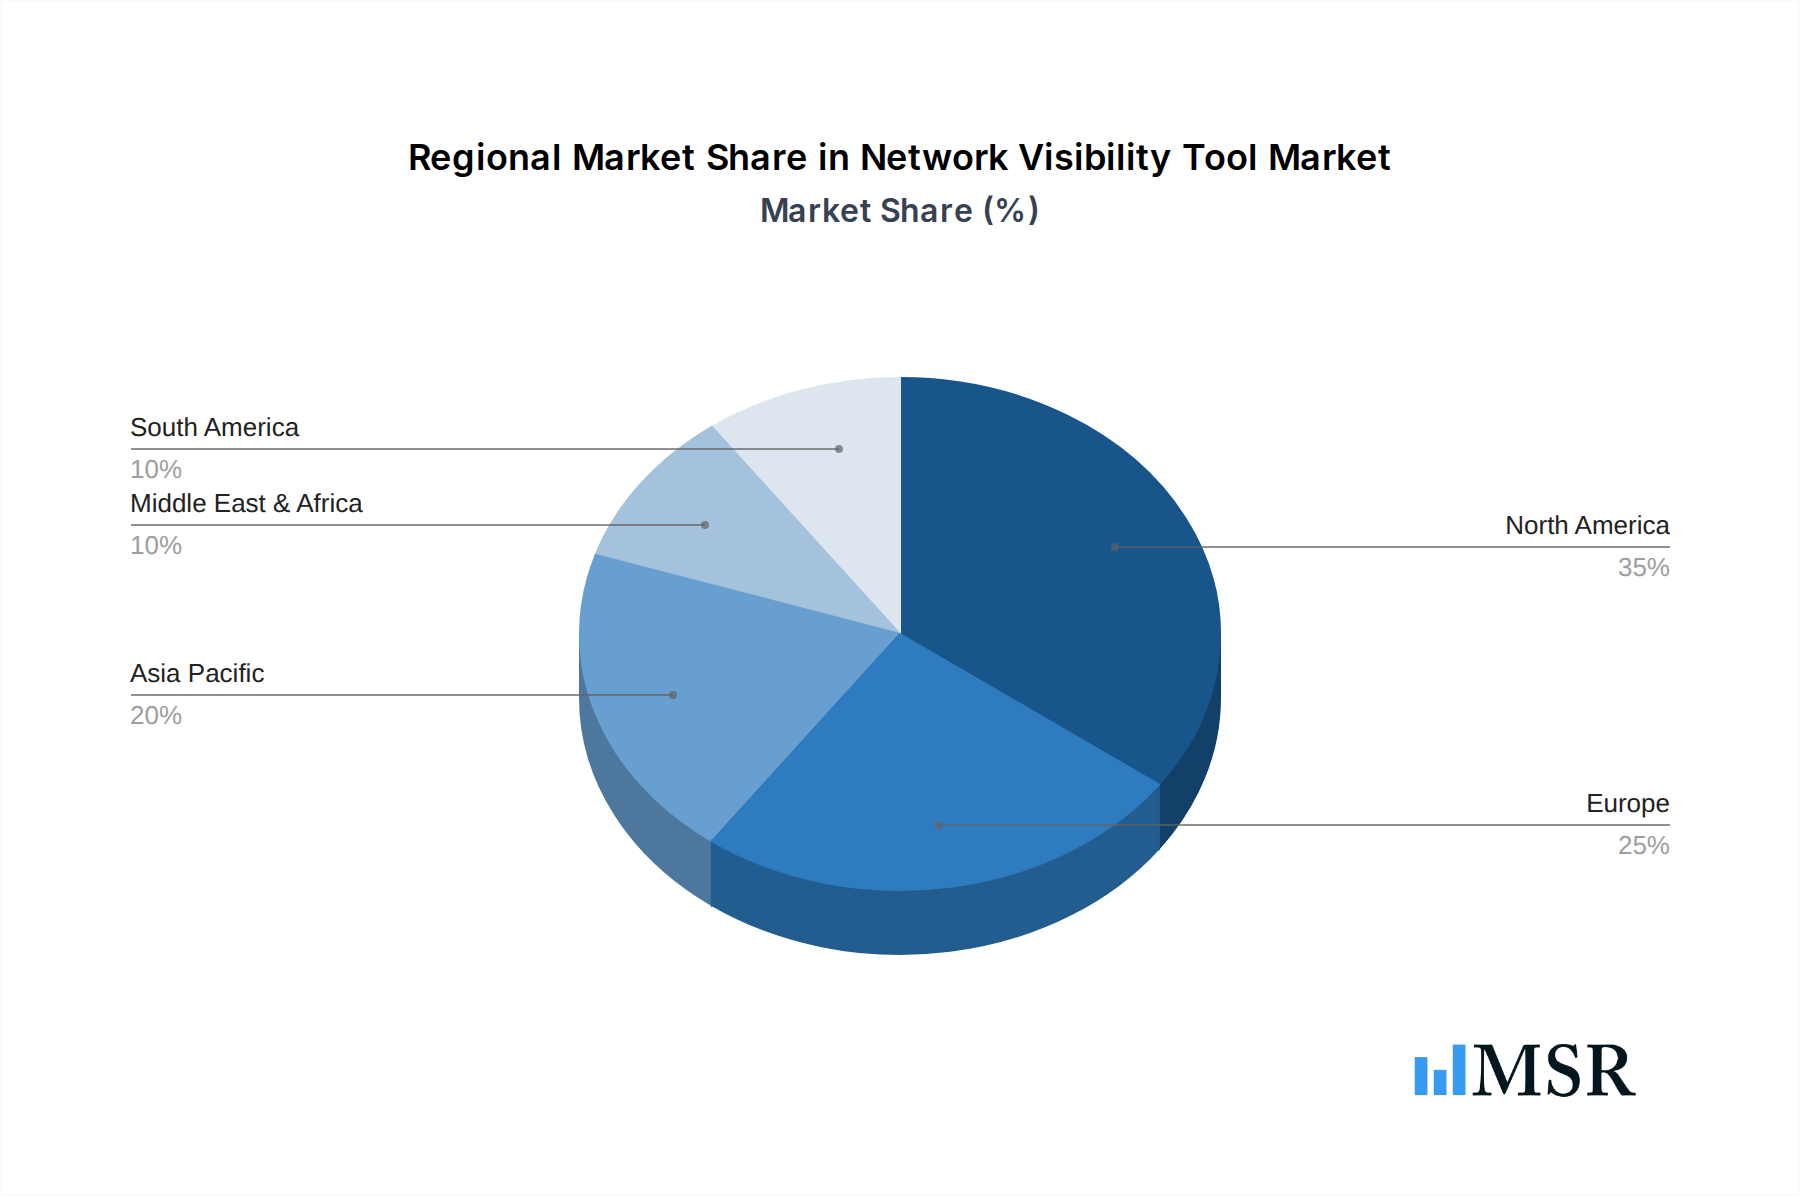
The Network Visibility Tool market’s leadership is demonstrably shaped by dominant regions and critical segments. In terms of geography, North America currently leads, driven by its mature technological infrastructure, significant R&D investments, and a high concentration of large enterprises with substantial cybersecurity budgets, estimated in the billions. The United States, in particular, accounts for a substantial portion of this market share, with substantial ongoing investments in network modernization.
Within the Application segment, Large Enterprises represent the most dominant force. These organizations typically manage vast and complex networks, often comprising multiple data centers, cloud environments, and a global workforce. Their stringent uptime requirements, advanced security needs, and significant IT budgets, often in the billions, make them prime adopters of sophisticated network visibility tools.
- Drivers for Large Enterprise Dominance:
- High volume of data traffic and application complexity.
- Critical business operations reliant on network availability.
- Proactive security posture and compliance mandates.
- Significant budget allocation for IT infrastructure and security, in the billions.
The Type segment sees a growing divergence, with Cloud-Based solutions rapidly gaining traction alongside established On-Premise deployments. While On-Premise solutions continue to be favored by organizations with strict data sovereignty requirements or existing heavy investments in on-premise infrastructure, the scalability, flexibility, and cost-effectiveness of cloud-based solutions are undeniable growth accelerators.
- Drivers for Cloud-Based Growth:
- Scalability to handle fluctuating network demands.
- Reduced IT overhead and faster deployment times.
- Remote accessibility and management capabilities.
- Seamless integration with other cloud services, with billions invested in cloud migration.
Small and Medium-sized Enterprises (SMEs) are also emerging as significant growth areas, with an increasing awareness of the importance of network performance and security, leading to an estimated xx% annual increase in their adoption of visibility tools, translating to billions in potential market expansion. The ongoing digital transformation and the need to compete effectively are pushing SMEs to invest in solutions that were once exclusive to larger organizations. This segment is characterized by a growing demand for cost-effective, user-friendly, and integrated visibility solutions, with vendors increasingly offering tiered pricing models and specialized packages to cater to their specific needs. The adoption of cloud-based solutions is particularly strong within SMEs due to their lower upfront investment and ease of management.
Network Visibility Tool Product Developments
Recent product developments in the Network Visibility Tool market are characterized by a strong emphasis on AI and ML integration for predictive analytics, anomaly detection, and automated remediation. Innovations are focused on delivering end-to-end visibility across hybrid and multi-cloud environments, offering deep packet inspection, application performance monitoring, and enhanced security analytics. Key advancements include the introduction of SaaS-based platforms with subscription models, providing greater scalability and flexibility, and the development of agentless monitoring solutions for simpler deployment. The market relevance is amplified by the increasing complexity of network architectures and the growing demand for proactive threat detection and performance optimization, with billions invested in these cutting-edge features.
Challenges in the Network Visibility Tool Market
The Network Visibility Tool market faces several significant challenges that can impact its growth trajectory. One primary restraint is the escalating cost of advanced solutions, with sophisticated platforms often requiring substantial upfront investment and ongoing maintenance, potentially reaching billions for large deployments. The increasing complexity of network infrastructures, including the proliferation of diverse devices and cloud services, makes comprehensive monitoring a daunting task, requiring specialized expertise. Furthermore, data privacy regulations and compliance mandates, while driving demand, also introduce complexities in data collection and analysis, requiring significant investments in compliant solutions. Competitive pressure from integrated IT management suites and the threat of vendor lock-in also pose challenges, with market share shifts constantly occurring. These challenges, if not addressed, could slow adoption rates in certain segments, impacting the overall market growth by an estimated xx% in specific regions.
Forces Driving Network Visibility Tool Growth
Several powerful forces are propelling the Network Visibility Tool market forward, promising sustained growth and innovation. The relentless evolution of cybersecurity threats is a primary driver, compelling organizations to invest in advanced monitoring to detect and respond to sophisticated attacks in real-time, with annual security investments in this domain reaching billions. The increasing adoption of cloud computing, hybrid cloud models, and multi-cloud strategies necessitates comprehensive visibility to manage performance and troubleshoot issues across disparate environments. The explosion of data traffic and the proliferation of IoT devices further exacerbate network complexity, creating a critical need for robust monitoring solutions. Moreover, the growing demand for exceptional user experience and seamless application performance, driven by customer expectations and business continuity requirements, directly translates into increased investment in network visibility tools, with an estimated xx% year-over-year increase in spending from the enterprise sector.
Challenges in the Network Visibility Tool Market
The long-term growth catalysts for the Network Visibility Tool market are deeply rooted in continuous innovation and strategic market expansion. The ongoing integration of AI and Machine Learning is not just a trend but a fundamental shift, enabling predictive maintenance, anomaly detection, and automated problem resolution, which will drive deeper adoption and higher value perception, with R&D investments in this area already in the billions. Strategic partnerships between tool vendors and cloud providers, as well as cybersecurity firms, are creating more integrated and comprehensive solutions, broadening their appeal and market reach. Furthermore, the expanding digital transformation initiatives across emerging economies present significant untapped market potential, with governments and businesses in these regions investing heavily in building robust digital infrastructures, thus creating new demand for visibility tools, estimated to contribute billions in future market growth.
Emerging Opportunities in Network Visibility Tool
Emerging opportunities in the Network Visibility Tool market are ripe for exploitation by innovative vendors. The expanding adoption of 5G technology presents a vast new landscape for network visibility, requiring specialized tools to monitor ultra-low latency and high-bandwidth connections, a market poised to generate billions in the coming years. The increasing demand for network observability, a concept extending beyond traditional visibility to understand the internal state of a system through its outputs, represents a significant evolution. Furthermore, the growing emphasis on Application Performance Monitoring (APM) and Digital Experience Monitoring (DEM) for end-user satisfaction creates a substantial niche for specialized solutions. The burgeoning market for edge computing also necessitates localized and efficient network visibility, opening up new avenues for deployment and innovation, with billions projected in early investments.
Leading Players in the Network Visibility Tool Sector
- FireEye Inc
- Gigamon
- Solarwinds
- Paessler
- OpManager
- Ipswitch
- Nagios XI
- Zabbix
- Datadog
- ConnectWise Automate
- Logic Monitor
- OP5 Monitor
Key Milestones in Network Visibility Tool Industry
- 2019: Increased focus on AI/ML integration for predictive analytics in network monitoring solutions.
- 2020: Significant surge in demand for remote monitoring solutions due to the global pandemic.
- 2021: Major cybersecurity breaches highlight the critical need for advanced network visibility.
- 2022: Cloud-based visibility platforms gain substantial market share and investment.
- 2023: Emergence of unified observability platforms combining network, application, and infrastructure monitoring.
- 2024: Growing adoption of Software-Defined Networking (SDN) prompts specialized visibility tool development.
- 2025 (Estimated): Maturation of AI-driven network anomaly detection capabilities.
- 2026-2028 (Forecast): Expansion of visibility solutions into edge computing environments.
- 2029-2031 (Forecast): Increased integration of network visibility with security orchestration and automated response (SOAR) platforms.
- 2032-2033 (Forecast): Development of hyper-personalized network visibility for individual user experiences.
Strategic Outlook for Network Visibility Tool Market
The strategic outlook for the Network Visibility Tool market is exceptionally strong, underpinned by a continuous need for enhanced network performance, robust security, and seamless digital experiences. Key growth accelerators include the ongoing integration of advanced AI and ML for predictive and prescriptive analytics, which will automate complex troubleshooting and proactively prevent issues, thus saving billions in downtime costs. Strategic partnerships and ecosystem development will be crucial for creating comprehensive, end-to-end visibility solutions that span cloud, on-premise, and edge environments. Furthermore, targeting emerging markets with tailored, cost-effective solutions will unlock significant untapped potential, contributing billions to future market expansion. Vendors who can demonstrate agility, innovation, and a deep understanding of evolving customer needs will be best positioned to capture market share and drive long-term success in this critical sector.
Network Visibility Tool Segmentation
-
1. Application
- 1.1. Large Enterprises
- 1.2. Small and Medium-sized Enterprises (SMEs)
-
2. Type
- 2.1. Cloud-Based
- 2.2. On-Premise
Network Visibility Tool Segmentation By Geography
-
1. North America
- 1.1. United States
- 1.2. Canada
- 1.3. Mexico
-
2. South America
- 2.1. Brazil
- 2.2. Argentina
- 2.3. Rest of South America
-
3. Europe
- 3.1. United Kingdom
- 3.2. Germany
- 3.3. France
- 3.4. Italy
- 3.5. Spain
- 3.6. Russia
- 3.7. Benelux
- 3.8. Nordics
- 3.9. Rest of Europe
-
4. Middle East & Africa
- 4.1. Turkey
- 4.2. Israel
- 4.3. GCC
- 4.4. North Africa
- 4.5. South Africa
- 4.6. Rest of Middle East & Africa
-
5. Asia Pacific
- 5.1. China
- 5.2. India
- 5.3. Japan
- 5.4. South Korea
- 5.5. ASEAN
- 5.6. Oceania
- 5.7. Rest of Asia Pacific
Network Visibility Tool Regional Market Share
Geographic Coverage of Network Visibility Tool
Network Visibility Tool REPORT HIGHLIGHTS
| Aspects | Details |
|---|---|
| Study Period | 2020-2034 |
| Base Year | 2025 |
| Estimated Year | 2026 |
| Forecast Period | 2026-2034 |
| Historical Period | 2020-2025 |
| Growth Rate | CAGR of 12% from 2020-2034 |
| Segmentation |
|
Table of Contents
- 1. Introduction
- 1.1. Research Scope
- 1.2. Market Segmentation
- 1.3. Research Objective
- 1.4. Definitions and Assumptions
- 2. Executive Summary
- 2.1. Market Snapshot
- 3. Market Dynamics
- 3.1. Market Drivers
- 3.2. Market Restrains
- 3.3. Market Trends
- 3.4. Market Opportunities
- 4. Market Factor Analysis
- 4.1. Porters Five Forces
- 4.1.1. Bargaining Power of Suppliers
- 4.1.2. Bargaining Power of Buyers
- 4.1.3. Threat of New Entrants
- 4.1.4. Threat of Substitutes
- 4.1.5. Competitive Rivalry
- 4.2. PESTEL analysis
- 4.3. BCG Analysis
- 4.3.1. Stars (High Growth, High Market Share)
- 4.3.2. Cash Cows (Low Growth, High Market Share)
- 4.3.3. Question Mark (High Growth, Low Market Share)
- 4.3.4. Dogs (Low Growth, Low Market Share)
- 4.4. Ansoff Matrix Analysis
- 4.5. Supply Chain Analysis
- 4.6. Regulatory Landscape
- 4.7. Current Market Potential and Opportunity Assessment (TAM–SAM–SOM Framework)
- 4.8. MSR Analyst Note
- 4.1. Porters Five Forces
- 5. Market Analysis, Insights and Forecast 2021-2033
- 5.1. Market Analysis, Insights and Forecast - by Application
- 5.1.1. Large Enterprises
- 5.1.2. Small and Medium-sized Enterprises (SMEs)
- 5.2. Market Analysis, Insights and Forecast - by Type
- 5.2.1. Cloud-Based
- 5.2.2. On-Premise
- 5.3. Market Analysis, Insights and Forecast - by Region
- 5.3.1. North America
- 5.3.2. South America
- 5.3.3. Europe
- 5.3.4. Middle East & Africa
- 5.3.5. Asia Pacific
- 5.1. Market Analysis, Insights and Forecast - by Application
- 6. Global Network Visibility Tool Analysis, Insights and Forecast, 2021-2033
- 6.1. Market Analysis, Insights and Forecast - by Application
- 6.1.1. Large Enterprises
- 6.1.2. Small and Medium-sized Enterprises (SMEs)
- 6.2. Market Analysis, Insights and Forecast - by Type
- 6.2.1. Cloud-Based
- 6.2.2. On-Premise
- 6.1. Market Analysis, Insights and Forecast - by Application
- 7. North America Network Visibility Tool Analysis, Insights and Forecast, 2020-2032
- 7.1. Market Analysis, Insights and Forecast - by Application
- 7.1.1. Large Enterprises
- 7.1.2. Small and Medium-sized Enterprises (SMEs)
- 7.2. Market Analysis, Insights and Forecast - by Type
- 7.2.1. Cloud-Based
- 7.2.2. On-Premise
- 7.1. Market Analysis, Insights and Forecast - by Application
- 8. South America Network Visibility Tool Analysis, Insights and Forecast, 2020-2032
- 8.1. Market Analysis, Insights and Forecast - by Application
- 8.1.1. Large Enterprises
- 8.1.2. Small and Medium-sized Enterprises (SMEs)
- 8.2. Market Analysis, Insights and Forecast - by Type
- 8.2.1. Cloud-Based
- 8.2.2. On-Premise
- 8.1. Market Analysis, Insights and Forecast - by Application
- 9. Europe Network Visibility Tool Analysis, Insights and Forecast, 2020-2032
- 9.1. Market Analysis, Insights and Forecast - by Application
- 9.1.1. Large Enterprises
- 9.1.2. Small and Medium-sized Enterprises (SMEs)
- 9.2. Market Analysis, Insights and Forecast - by Type
- 9.2.1. Cloud-Based
- 9.2.2. On-Premise
- 9.1. Market Analysis, Insights and Forecast - by Application
- 10. Middle East & Africa Network Visibility Tool Analysis, Insights and Forecast, 2020-2032
- 10.1. Market Analysis, Insights and Forecast - by Application
- 10.1.1. Large Enterprises
- 10.1.2. Small and Medium-sized Enterprises (SMEs)
- 10.2. Market Analysis, Insights and Forecast - by Type
- 10.2.1. Cloud-Based
- 10.2.2. On-Premise
- 10.1. Market Analysis, Insights and Forecast - by Application
- 11. Asia Pacific Network Visibility Tool Analysis, Insights and Forecast, 2020-2032
- 11.1. Market Analysis, Insights and Forecast - by Application
- 11.1.1. Large Enterprises
- 11.1.2. Small and Medium-sized Enterprises (SMEs)
- 11.2. Market Analysis, Insights and Forecast - by Type
- 11.2.1. Cloud-Based
- 11.2.2. On-Premise
- 11.1. Market Analysis, Insights and Forecast - by Application
- 12. Competitive Analysis
- 12.1. Company Profiles
- 12.1.1 FireEye Inc
- 12.1.1.1. Company Overview
- 12.1.1.2. Products
- 12.1.1.3. Company Financials
- 12.1.1.4. SWOT Analysis
- 12.1.2 Gigamon
- 12.1.2.1. Company Overview
- 12.1.2.2. Products
- 12.1.2.3. Company Financials
- 12.1.2.4. SWOT Analysis
- 12.1.3 Solarwinds
- 12.1.3.1. Company Overview
- 12.1.3.2. Products
- 12.1.3.3. Company Financials
- 12.1.3.4. SWOT Analysis
- 12.1.4 Paessler
- 12.1.4.1. Company Overview
- 12.1.4.2. Products
- 12.1.4.3. Company Financials
- 12.1.4.4. SWOT Analysis
- 12.1.5 OpManager
- 12.1.5.1. Company Overview
- 12.1.5.2. Products
- 12.1.5.3. Company Financials
- 12.1.5.4. SWOT Analysis
- 12.1.6 Ipswitch
- 12.1.6.1. Company Overview
- 12.1.6.2. Products
- 12.1.6.3. Company Financials
- 12.1.6.4. SWOT Analysis
- 12.1.7 Nagios XI
- 12.1.7.1. Company Overview
- 12.1.7.2. Products
- 12.1.7.3. Company Financials
- 12.1.7.4. SWOT Analysis
- 12.1.8 Zabbix
- 12.1.8.1. Company Overview
- 12.1.8.2. Products
- 12.1.8.3. Company Financials
- 12.1.8.4. SWOT Analysis
- 12.1.9 Datadog
- 12.1.9.1. Company Overview
- 12.1.9.2. Products
- 12.1.9.3. Company Financials
- 12.1.9.4. SWOT Analysis
- 12.1.10 ConnectWise Automate
- 12.1.10.1. Company Overview
- 12.1.10.2. Products
- 12.1.10.3. Company Financials
- 12.1.10.4. SWOT Analysis
- 12.1.11 Logic Monitor
- 12.1.11.1. Company Overview
- 12.1.11.2. Products
- 12.1.11.3. Company Financials
- 12.1.11.4. SWOT Analysis
- 12.1.12 OP5 Monitor
- 12.1.12.1. Company Overview
- 12.1.12.2. Products
- 12.1.12.3. Company Financials
- 12.1.12.4. SWOT Analysis
- 12.1.1 FireEye Inc
- 12.2. Market Entropy
- 12.2.1 Company's Key Areas Served
- 12.2.2 Recent Developments
- 12.3. Company Market Share Analysis 2025
- 12.3.1 Top 5 Companies Market Share Analysis
- 12.3.2 Top 3 Companies Market Share Analysis
- 12.4. List of Potential Customers
- 13. Research Methodology
List of Figures
- Figure 1: Global Network Visibility Tool Revenue Breakdown (undefined, %) by Region 2025 & 2033
- Figure 2: North America Network Visibility Tool Revenue (undefined), by Application 2025 & 2033
- Figure 3: North America Network Visibility Tool Revenue Share (%), by Application 2025 & 2033
- Figure 4: North America Network Visibility Tool Revenue (undefined), by Type 2025 & 2033
- Figure 5: North America Network Visibility Tool Revenue Share (%), by Type 2025 & 2033
- Figure 6: North America Network Visibility Tool Revenue (undefined), by Country 2025 & 2033
- Figure 7: North America Network Visibility Tool Revenue Share (%), by Country 2025 & 2033
- Figure 8: South America Network Visibility Tool Revenue (undefined), by Application 2025 & 2033
- Figure 9: South America Network Visibility Tool Revenue Share (%), by Application 2025 & 2033
- Figure 10: South America Network Visibility Tool Revenue (undefined), by Type 2025 & 2033
- Figure 11: South America Network Visibility Tool Revenue Share (%), by Type 2025 & 2033
- Figure 12: South America Network Visibility Tool Revenue (undefined), by Country 2025 & 2033
- Figure 13: South America Network Visibility Tool Revenue Share (%), by Country 2025 & 2033
- Figure 14: Europe Network Visibility Tool Revenue (undefined), by Application 2025 & 2033
- Figure 15: Europe Network Visibility Tool Revenue Share (%), by Application 2025 & 2033
- Figure 16: Europe Network Visibility Tool Revenue (undefined), by Type 2025 & 2033
- Figure 17: Europe Network Visibility Tool Revenue Share (%), by Type 2025 & 2033
- Figure 18: Europe Network Visibility Tool Revenue (undefined), by Country 2025 & 2033
- Figure 19: Europe Network Visibility Tool Revenue Share (%), by Country 2025 & 2033
- Figure 20: Middle East & Africa Network Visibility Tool Revenue (undefined), by Application 2025 & 2033
- Figure 21: Middle East & Africa Network Visibility Tool Revenue Share (%), by Application 2025 & 2033
- Figure 22: Middle East & Africa Network Visibility Tool Revenue (undefined), by Type 2025 & 2033
- Figure 23: Middle East & Africa Network Visibility Tool Revenue Share (%), by Type 2025 & 2033
- Figure 24: Middle East & Africa Network Visibility Tool Revenue (undefined), by Country 2025 & 2033
- Figure 25: Middle East & Africa Network Visibility Tool Revenue Share (%), by Country 2025 & 2033
- Figure 26: Asia Pacific Network Visibility Tool Revenue (undefined), by Application 2025 & 2033
- Figure 27: Asia Pacific Network Visibility Tool Revenue Share (%), by Application 2025 & 2033
- Figure 28: Asia Pacific Network Visibility Tool Revenue (undefined), by Type 2025 & 2033
- Figure 29: Asia Pacific Network Visibility Tool Revenue Share (%), by Type 2025 & 2033
- Figure 30: Asia Pacific Network Visibility Tool Revenue (undefined), by Country 2025 & 2033
- Figure 31: Asia Pacific Network Visibility Tool Revenue Share (%), by Country 2025 & 2033
List of Tables
- Table 1: Global Network Visibility Tool Revenue undefined Forecast, by Application 2020 & 2033
- Table 2: Global Network Visibility Tool Revenue undefined Forecast, by Type 2020 & 2033
- Table 3: Global Network Visibility Tool Revenue undefined Forecast, by Region 2020 & 2033
- Table 4: Global Network Visibility Tool Revenue undefined Forecast, by Application 2020 & 2033
- Table 5: Global Network Visibility Tool Revenue undefined Forecast, by Type 2020 & 2033
- Table 6: Global Network Visibility Tool Revenue undefined Forecast, by Country 2020 & 2033
- Table 7: United States Network Visibility Tool Revenue (undefined) Forecast, by Application 2020 & 2033
- Table 8: Canada Network Visibility Tool Revenue (undefined) Forecast, by Application 2020 & 2033
- Table 9: Mexico Network Visibility Tool Revenue (undefined) Forecast, by Application 2020 & 2033
- Table 10: Global Network Visibility Tool Revenue undefined Forecast, by Application 2020 & 2033
- Table 11: Global Network Visibility Tool Revenue undefined Forecast, by Type 2020 & 2033
- Table 12: Global Network Visibility Tool Revenue undefined Forecast, by Country 2020 & 2033
- Table 13: Brazil Network Visibility Tool Revenue (undefined) Forecast, by Application 2020 & 2033
- Table 14: Argentina Network Visibility Tool Revenue (undefined) Forecast, by Application 2020 & 2033
- Table 15: Rest of South America Network Visibility Tool Revenue (undefined) Forecast, by Application 2020 & 2033
- Table 16: Global Network Visibility Tool Revenue undefined Forecast, by Application 2020 & 2033
- Table 17: Global Network Visibility Tool Revenue undefined Forecast, by Type 2020 & 2033
- Table 18: Global Network Visibility Tool Revenue undefined Forecast, by Country 2020 & 2033
- Table 19: United Kingdom Network Visibility Tool Revenue (undefined) Forecast, by Application 2020 & 2033
- Table 20: Germany Network Visibility Tool Revenue (undefined) Forecast, by Application 2020 & 2033
- Table 21: France Network Visibility Tool Revenue (undefined) Forecast, by Application 2020 & 2033
- Table 22: Italy Network Visibility Tool Revenue (undefined) Forecast, by Application 2020 & 2033
- Table 23: Spain Network Visibility Tool Revenue (undefined) Forecast, by Application 2020 & 2033
- Table 24: Russia Network Visibility Tool Revenue (undefined) Forecast, by Application 2020 & 2033
- Table 25: Benelux Network Visibility Tool Revenue (undefined) Forecast, by Application 2020 & 2033
- Table 26: Nordics Network Visibility Tool Revenue (undefined) Forecast, by Application 2020 & 2033
- Table 27: Rest of Europe Network Visibility Tool Revenue (undefined) Forecast, by Application 2020 & 2033
- Table 28: Global Network Visibility Tool Revenue undefined Forecast, by Application 2020 & 2033
- Table 29: Global Network Visibility Tool Revenue undefined Forecast, by Type 2020 & 2033
- Table 30: Global Network Visibility Tool Revenue undefined Forecast, by Country 2020 & 2033
- Table 31: Turkey Network Visibility Tool Revenue (undefined) Forecast, by Application 2020 & 2033
- Table 32: Israel Network Visibility Tool Revenue (undefined) Forecast, by Application 2020 & 2033
- Table 33: GCC Network Visibility Tool Revenue (undefined) Forecast, by Application 2020 & 2033
- Table 34: North Africa Network Visibility Tool Revenue (undefined) Forecast, by Application 2020 & 2033
- Table 35: South Africa Network Visibility Tool Revenue (undefined) Forecast, by Application 2020 & 2033
- Table 36: Rest of Middle East & Africa Network Visibility Tool Revenue (undefined) Forecast, by Application 2020 & 2033
- Table 37: Global Network Visibility Tool Revenue undefined Forecast, by Application 2020 & 2033
- Table 38: Global Network Visibility Tool Revenue undefined Forecast, by Type 2020 & 2033
- Table 39: Global Network Visibility Tool Revenue undefined Forecast, by Country 2020 & 2033
- Table 40: China Network Visibility Tool Revenue (undefined) Forecast, by Application 2020 & 2033
- Table 41: India Network Visibility Tool Revenue (undefined) Forecast, by Application 2020 & 2033
- Table 42: Japan Network Visibility Tool Revenue (undefined) Forecast, by Application 2020 & 2033
- Table 43: South Korea Network Visibility Tool Revenue (undefined) Forecast, by Application 2020 & 2033
- Table 44: ASEAN Network Visibility Tool Revenue (undefined) Forecast, by Application 2020 & 2033
- Table 45: Oceania Network Visibility Tool Revenue (undefined) Forecast, by Application 2020 & 2033
- Table 46: Rest of Asia Pacific Network Visibility Tool Revenue (undefined) Forecast, by Application 2020 & 2033
Frequently Asked Questions
1. What is the projected Compound Annual Growth Rate (CAGR) of the Network Visibility Tool?
The projected CAGR is approximately 12%.
2. Which companies are prominent players in the Network Visibility Tool?
Key companies in the market include FireEye Inc, Gigamon, Solarwinds, Paessler, OpManager, Ipswitch, Nagios XI, Zabbix, Datadog, ConnectWise Automate, Logic Monitor, OP5 Monitor.
3. What are the main segments of the Network Visibility Tool?
The market segments include Application, Type.
4. Can you provide details about the market size?
The market size is estimated to be USD XXX N/A as of 2022.
5. What are some drivers contributing to market growth?
N/A
6. What are the notable trends driving market growth?
N/A
7. Are there any restraints impacting market growth?
N/A
8. Can you provide examples of recent developments in the market?
N/A
9. What pricing options are available for accessing the report?
Pricing options include single-user, multi-user, and enterprise licenses priced at USD 2900.00, USD 4350.00, and USD 5800.00 respectively.
10. Is the market size provided in terms of value or volume?
The market size is provided in terms of value, measured in N/A.
11. Are there any specific market keywords associated with the report?
Yes, the market keyword associated with the report is "Network Visibility Tool," which aids in identifying and referencing the specific market segment covered.
12. How do I determine which pricing option suits my needs best?
The pricing options vary based on user requirements and access needs. Individual users may opt for single-user licenses, while businesses requiring broader access may choose multi-user or enterprise licenses for cost-effective access to the report.
13. Are there any additional resources or data provided in the Network Visibility Tool report?
While the report offers comprehensive insights, it's advisable to review the specific contents or supplementary materials provided to ascertain if additional resources or data are available.
14. How can I stay updated on further developments or reports in the Network Visibility Tool?
To stay informed about further developments, trends, and reports in the Network Visibility Tool, consider subscribing to industry newsletters, following relevant companies and organizations, or regularly checking reputable industry news sources and publications.
Methodology
Step 1 - Identification of Relevant Samples Size from Population Database


Step 2 - Approaches for Defining Global Market Size (Value, Volume* & Price*)

Note*: In applicable scenarios
Step 3 - Data Sources
Primary Research
- Web Analytics
- Survey Reports
- Research Institute
- Latest Research Reports
- Opinion Leaders
Secondary Research
- Annual Reports
- White Paper
- Latest Press Release
- Industry Association
- Paid Database
- Investor Presentations

Step 4 - Data Triangulation
Involves using different sources of information in order to increase the validity of a study
These sources are likely to be stakeholders in a program - participants, other researchers, program staff, other community members, and so on.
Then we put all data in single framework & apply various statistical tools to find out the dynamic on the market.
During the analysis stage, feedback from the stakeholder groups would be compared to determine areas of agreement as well as areas of divergence