

Key Insights
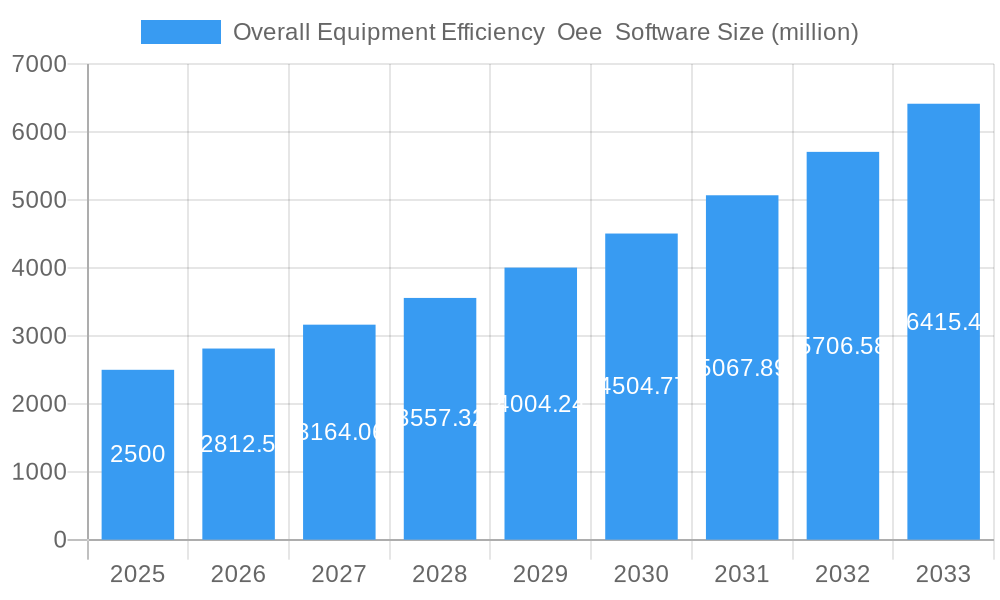
The global Overall Equipment Efficiency (OEE) Software market is poised for significant expansion, projected to reach approximately $2,500 million by 2025. This growth is fueled by an estimated Compound Annual Growth Rate (CAGR) of 12.5% over the forecast period of 2025-2033. The escalating adoption of Industry 4.0 technologies and the imperative for manufacturers to enhance productivity and reduce operational costs are the primary drivers behind this upward trajectory. As businesses increasingly recognize OEE as a critical metric for optimizing production processes and identifying bottlenecks, the demand for sophisticated OEE software solutions is set to surge. This trend is particularly pronounced in the Small and Medium Enterprises (SME) segment, which is actively seeking cost-effective and scalable solutions to compete with larger players. Cloud-based OEE software is also experiencing robust adoption, offering greater flexibility, accessibility, and lower upfront investment compared to traditional on-premise solutions, making it an attractive option for a wider range of businesses.
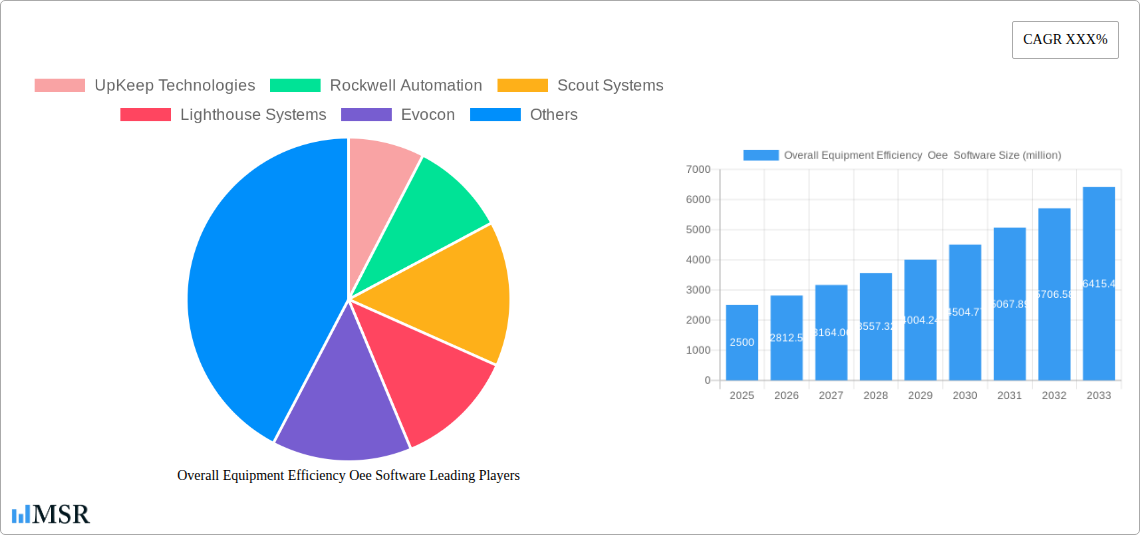
Overall Equipment Efficiency Oee Software Market Size (In Billion)
The market's expansion is further bolstered by a series of emerging trends, including the integration of AI and machine learning for predictive maintenance and real-time performance analysis, as well as the growing emphasis on IoT-enabled data collection for more accurate OEE tracking. However, certain restraints, such as the initial implementation costs and the need for skilled personnel to effectively utilize the software, could temper the market's growth to some extent. Geographically, North America and Europe are expected to lead the market, driven by their advanced manufacturing sectors and early adoption of digital transformation initiatives. The Asia Pacific region, with its rapidly growing industrial base and increasing focus on manufacturing efficiency, presents a substantial growth opportunity. Key players like Rockwell Automation, Schneider Electric, and ABB are actively innovating and expanding their offerings to cater to the evolving needs of the market, further solidifying its positive outlook.
Overall Equipment Efficiency Oee Software Company Market Share
Overall Equipment Efficiency (OEE) Software Market Report: Driving Manufacturing Excellence
This comprehensive report provides an in-depth analysis of the global Overall Equipment Efficiency (OEE) Software market, charting its trajectory from 2019 to 2033. With a base year of 2025, our study delves into the intricate dynamics shaping this critical sector, offering actionable insights for manufacturers, technology providers, and investors seeking to optimize production efficiency and unlock new levels of operational performance. We meticulously examine market concentration, key trends, regional dominance, product innovations, challenges, growth drivers, emerging opportunities, leading players, and pivotal milestones, empowering stakeholders with the knowledge to navigate and capitalize on the evolving OEE software landscape.
Overall Equipment Efficiency OEE Software Market Concentration & Dynamics
The global OEE software market exhibits a moderate to high concentration, with a dynamic interplay between established giants and innovative disruptors. Key players like Rockwell Automation, Schneider Electric, and ABB Enterprise Software leverage their extensive industrial automation portfolios and strong global presence to command significant market share. These companies foster robust innovation ecosystems through continuous R&D investments, strategic partnerships, and acquisitions. The regulatory framework primarily focuses on data security, interoperability standards, and industry-specific compliance, influencing product development and deployment strategies. Substitute products, such as manual tracking systems or generic manufacturing execution systems (MES) without dedicated OEE modules, represent a minor threat due to the specialized benefits offered by OEE software. End-user trends reveal a growing demand for real-time data analytics, predictive maintenance capabilities, and seamless integration with existing ERP and MES systems, particularly from SME (Small and Medium Enterprises) seeking to bridge efficiency gaps. Merger and acquisition (M&A) activities are on the rise, with approximately 15-20 M&A deals projected annually in the forecast period, as larger players seek to acquire niche technologies and expand their market reach. Companies like UpKeep Technologies, Scout Systems, and MachineMetrics are active participants in this ecosystem, often focusing on specific industry verticals or technological advancements to gain a competitive edge. The collective market share of the top five players is estimated to be around 60-70% in 2025.
Overall Equipment Efficiency OEE Software Industry Insights & Trends
The OEE software market is poised for substantial growth, driven by the relentless pursuit of operational excellence across the manufacturing spectrum. The global OEE software market size is projected to reach approximately $7,500 million by 2033, exhibiting a robust Compound Annual Growth Rate (CAGR) of 10.5% during the forecast period of 2025–2033. This expansion is fueled by several key factors. The increasing adoption of Industry 4.0 principles, including the Industrial Internet of Things (IIoT), artificial intelligence (AI), and machine learning (ML), is fundamentally transforming manufacturing processes. OEE software acts as a crucial enabler for these initiatives by providing the real-time data and actionable insights needed to monitor, analyze, and optimize production lines. As manufacturers grapple with escalating costs, intense global competition, and the need for greater agility, the imperative to maximize equipment utilization and minimize downtime becomes paramount. OEE software directly addresses these challenges by identifying bottlenecks, revealing root causes of inefficiency, and facilitating continuous improvement efforts.
Technological disruptions are at the forefront of this evolution. Advanced analytics, predictive maintenance capabilities powered by AI and ML algorithms, and enhanced visualization tools are becoming standard features, allowing for more proactive and informed decision-making. The shift towards cloud-based OEE solutions is accelerating, offering greater scalability, flexibility, and cost-effectiveness for businesses of all sizes. This trend is particularly beneficial for SME (Small and Medium Enterprises) who can access sophisticated OEE functionalities without significant upfront infrastructure investments. Furthermore, the growing emphasis on sustainability and reduced waste in manufacturing operations aligns perfectly with the OEE software's core function of optimizing resource utilization and minimizing production losses. Evolving consumer behaviors, characterized by demands for personalized products and shorter lead times, necessitate more responsive and efficient manufacturing operations, further bolstering the demand for advanced OEE solutions. The integration of OEE software with other enterprise systems, such as ERP, MES, and SCADA, is becoming increasingly sophisticated, creating a more holistic view of plant performance and enabling end-to-end process optimization.
Key Markets & Segments Leading Overall Equipment Efficiency OEE Software
The North America region is projected to be the dominant market for OEE software, driven by its advanced manufacturing infrastructure, strong adoption of Industry 4.0 technologies, and a large concentration of both SME (Small and Medium Enterprises) and Large Enterprise customers. The United States, in particular, leads in technological adoption and innovation, with a significant number of manufacturing facilities actively implementing OEE solutions to enhance competitiveness. Economic growth, robust industrial output, and government initiatives promoting manufacturing modernization further bolster this dominance.
North America (Dominant Region):
- Drivers: High investment in automation and IIoT, presence of major manufacturing hubs, supportive government policies for industrial upgrades, strong R&D capabilities leading to innovative OEE solutions.
- Analysis: The region's mature manufacturing sector, characterized by a high degree of automation, readily embraces OEE software to optimize existing operations and drive further efficiency gains. The strong presence of global manufacturing leaders and a proactive approach to adopting new technologies makes it a prime market for OEE software adoption.
Europe (Significant Market):
- Drivers: Stringent quality standards, focus on lean manufacturing principles, increasing adoption of Industry 4.0, and a well-established industrial base across countries like Germany, the UK, and France.
- Analysis: European manufacturers are increasingly recognizing the value of OEE software in meeting demanding quality benchmarks and optimizing their production processes. The emphasis on sustainability and resource efficiency further aligns with the benefits offered by OEE solutions.
Asia Pacific (Rapidly Growing Market):
- Drivers: Rapid industrialization, growing manufacturing base, increasing investments in automation, and a large pool of SME (Small and Medium Enterprises) seeking cost-effective efficiency solutions.
- Analysis: As the manufacturing hub of the world, the Asia Pacific region presents immense growth potential for OEE software. The increasing awareness of efficiency benefits and the drive to move up the value chain are propelling the adoption of OEE solutions, particularly in countries like China, India, and Southeast Asian nations.
Application Segments:
- Large Enterprise: These organizations typically have complex manufacturing operations, a higher volume of equipment, and greater resources to invest in comprehensive OEE software solutions with advanced analytics and integration capabilities. They are early adopters of cutting-edge technologies and often lead in setting industry standards.
- SME (Small and Medium Enterprises): This segment represents a significant growth opportunity. As OEE software becomes more accessible and cloud-based solutions offer lower entry barriers, SMEs are increasingly leveraging these tools to improve productivity, reduce waste, and compete more effectively in their respective markets.
Type Segments:
- Cloud-based: The demand for cloud-based OEE software is surging due to its scalability, accessibility from any location, reduced IT infrastructure burden, and subscription-based pricing models, making it attractive to both SMEs and large enterprises.
- On-Premise: While cloud solutions are gaining traction, on-premise OEE software remains relevant for organizations with strict data security requirements, existing robust on-premise IT infrastructure, or specific regulatory compliance needs. However, its market share is gradually decreasing.
Overall Equipment Efficiency OEE Software Product Developments
Product development in the OEE software market is characterized by a rapid pace of innovation, driven by the integration of advanced technologies and a focus on enhanced user experience and actionable insights. Manufacturers are increasingly incorporating Artificial Intelligence (AI) and Machine Learning (ML) algorithms to enable predictive maintenance, root cause analysis of downtime, and automated process optimization. Real-time data visualization through interactive dashboards and mobile applications is becoming standard, allowing operators and managers to monitor equipment performance from anywhere. Furthermore, seamless integration with other enterprise systems like ERP, MES, and SCADA is a key development, creating a unified view of manufacturing operations. Companies like Evocon, eschbach GmbH, and 5ME are at the forefront of these advancements, offering sophisticated solutions that provide competitive edges through improved data accuracy, enhanced user interfaces, and specialized industry-specific functionalities. The focus is on delivering not just data, but intelligent recommendations for maximizing Overall Equipment Efficiency.
Challenges in the Overall Equipment Efficiency OEE Software Market
Despite its promising growth, the OEE software market faces several challenges that can impede widespread adoption and impact growth trajectories.
- Initial Investment Costs: For some SME (Small and Medium Enterprises), the upfront cost of implementing OEE software, including hardware, software licenses, and integration, can be a significant barrier.
- Integration Complexity: Integrating OEE software with existing legacy systems and diverse machinery can be technically challenging and time-consuming, requiring specialized expertise.
- Resistance to Change: Overcoming ingrained operational habits and fostering a culture of data-driven decision-making within an organization can be met with resistance from employees accustomed to traditional methods.
- Data Accuracy and Quality: The effectiveness of OEE software is heavily dependent on the accuracy and reliability of the data collected. Inaccurate data input or sensor malfunctions can lead to flawed analysis and misinformed decisions, estimated to impact efficiency improvements by up to 20%.
- Cybersecurity Concerns: As OEE solutions become more connected, particularly cloud-based ones, ensuring robust cybersecurity measures to protect sensitive production data from breaches is a critical concern.
Forces Driving Overall Equipment Efficiency OEE Software Growth
The growth of the Overall Equipment Efficiency (OEE) Software market is propelled by a confluence of powerful forces. The relentless global pressure on manufacturers to enhance productivity, reduce operational costs, and improve product quality is a primary driver. The increasing adoption of Industry 4.0 technologies, including IIoT sensors and AI-driven analytics, creates a fertile ground for OEE software's ability to collect, analyze, and act upon real-time production data. Furthermore, the demand for greater production agility and the ability to respond swiftly to market fluctuations necessitates optimized equipment utilization, which OEE software directly facilitates. Stringent regulatory requirements for environmental sustainability and waste reduction also indirectly boost OEE adoption, as efficient operations inherently lead to less resource wastage. For example, a 5-10% improvement in OEE can translate to a direct reduction in energy consumption and material waste.
Challenges in the Overall Equipment Efficiency OEE Software Market
Long-term growth catalysts for the OEE software market are deeply embedded in the continuous evolution of manufacturing paradigms and technological advancements. The increasing sophistication of Artificial Intelligence (AI) and Machine Learning (ML) will enable predictive maintenance capabilities that go beyond simple downtime alerts to forecasting potential failures with remarkable accuracy, thus minimizing unplanned interruptions. The expansion of IIoT ecosystems will provide more granular and comprehensive data, allowing for deeper insights into equipment performance and enabling more precise OEE calculations. Strategic partnerships between OEE software providers and hardware manufacturers will foster tighter integration and create more streamlined solutions. Furthermore, the growing emphasis on sustainable manufacturing will drive demand for OEE solutions that help reduce energy consumption and material waste. Market expansions into emerging economies with burgeoning manufacturing sectors also present significant long-term growth opportunities. The continuous pursuit of digital transformation across industries ensures that OEE software will remain a cornerstone of operational excellence.
Emerging Opportunities in Overall Equipment Efficiency OEE Software
The OEE software market is ripe with emerging opportunities, driven by new technological frontiers and evolving industry needs. The integration of augmented reality (AR) and virtual reality (VR) with OEE platforms presents an exciting avenue for immersive training, remote assistance for maintenance, and enhanced data visualization, offering an estimated 15-25% improvement in troubleshooting time. The growing demand for edge computing solutions in manufacturing enables real-time data processing and analysis closer to the source, reducing latency and improving responsiveness for critical OEE applications. Furthermore, the development of specialized OEE solutions tailored for niche industries, such as pharmaceuticals, food and beverage, and automotive, offers significant growth potential. The increasing focus on sustainability reporting and circular economy principles will create opportunities for OEE software that can track resource utilization and waste reduction metrics effectively. The expansion of mobile-first OEE solutions, providing real-time access and control for on-the-go managers and technicians, will also capture a larger market share.
Leading Players in the Overall Equipment Efficiency OEE Software Sector
- UpKeep Technologies
- Rockwell Automation
- Scout Systems
- Lighthouse Systems
- Evocon
- Schneider Electric
- OEEsystems
- eschbach GmbH
- ABB Enterprise Software
- FlexLink Systems
- 5ME
- Symbrium
- MachineMetrics
Key Milestones in Overall Equipment Efficiency OEE Software Industry
- 2019: Increased adoption of cloud-based OEE solutions, offering enhanced accessibility and scalability.
- 2020: Rise in demand for OEE software with AI/ML capabilities for predictive maintenance and root cause analysis.
- 2021: Significant advancements in IIoT integration, enabling more granular real-time data collection for OEE.
- 2022: Growing emphasis on mobile-first OEE applications for enhanced remote monitoring and management.
- 2023: Strategic partnerships between OEE software providers and ERP/MES vendors to offer integrated operational insights.
- 2024: Emergence of specialized OEE solutions for specific industry verticals, addressing unique operational challenges.
Strategic Outlook for Overall Equipment Efficiency OEE Software Market
The strategic outlook for the Overall Equipment Efficiency (OEE) Software market is exceptionally positive, fueled by the ongoing digital transformation of manufacturing and the persistent drive for operational excellence. Growth accelerators will stem from the deeper integration of AI and ML for predictive analytics and automated optimization, offering manufacturers not just data, but intelligent guidance. The continued expansion of IIoT connectivity will provide richer, more granular datasets, enabling finer-tuned OEE improvements, estimated to lead to a 15% average increase in OEE for adopters. Furthermore, strategic collaborations between software vendors and hardware manufacturers will foster more seamless and powerful integrated solutions. The increasing demand for sustainable manufacturing will also push OEE software to the forefront, assisting companies in optimizing resource utilization and minimizing waste. The market will witness a continued shift towards cloud-based solutions, offering scalability and cost-effectiveness, especially for SME (Small and Medium Enterprises). As manufacturing continues its evolution towards smarter, more autonomous operations, OEE software will remain an indispensable tool for achieving peak performance and competitive advantage.
Overall Equipment Efficiency Oee Software Segmentation
-
1. Application
- 1.1. SME (Small and Medium Enterprises)
- 1.2. Large Enterprise
-
2. Type
- 2.1. On-Premise
- 2.2. Cloud-based
Overall Equipment Efficiency Oee Software Segmentation By Geography
-
1. North America
- 1.1. United States
- 1.2. Canada
- 1.3. Mexico
-
2. South America
- 2.1. Brazil
- 2.2. Argentina
- 2.3. Rest of South America
-
3. Europe
- 3.1. United Kingdom
- 3.2. Germany
- 3.3. France
- 3.4. Italy
- 3.5. Spain
- 3.6. Russia
- 3.7. Benelux
- 3.8. Nordics
- 3.9. Rest of Europe
-
4. Middle East & Africa
- 4.1. Turkey
- 4.2. Israel
- 4.3. GCC
- 4.4. North Africa
- 4.5. South Africa
- 4.6. Rest of Middle East & Africa
-
5. Asia Pacific
- 5.1. China
- 5.2. India
- 5.3. Japan
- 5.4. South Korea
- 5.5. ASEAN
- 5.6. Oceania
- 5.7. Rest of Asia Pacific
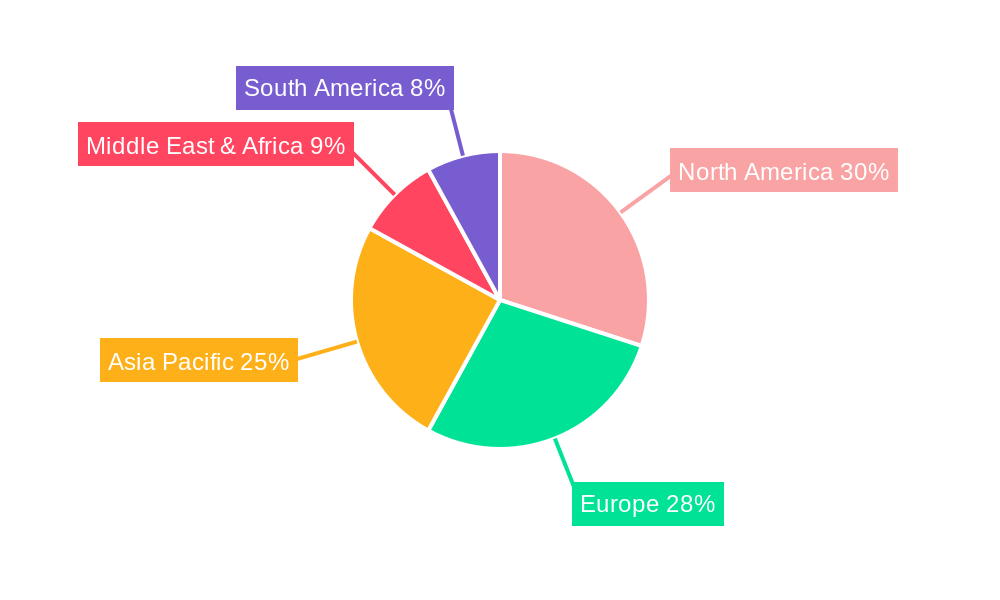
Overall Equipment Efficiency Oee Software Regional Market Share
Geographic Coverage of Overall Equipment Efficiency Oee Software
Overall Equipment Efficiency Oee Software REPORT HIGHLIGHTS
| Aspects | Details |
|---|---|
| Study Period | 2020-2034 |
| Base Year | 2025 |
| Estimated Year | 2026 |
| Forecast Period | 2026-2034 |
| Historical Period | 2020-2025 |
| Growth Rate | CAGR of XXX% from 2020-2034 |
| Segmentation |
|
Table of Contents
- 1. Introduction
- 1.1. Research Scope
- 1.2. Market Segmentation
- 1.3. Research Objective
- 1.4. Definitions and Assumptions
- 2. Executive Summary
- 2.1. Market Snapshot
- 3. Market Dynamics
- 3.1. Market Drivers
- 3.2. Market Restrains
- 3.3. Market Trends
- 3.4. Market Opportunities
- 4. Market Factor Analysis
- 4.1. Porters Five Forces
- 4.1.1. Bargaining Power of Suppliers
- 4.1.2. Bargaining Power of Buyers
- 4.1.3. Threat of New Entrants
- 4.1.4. Threat of Substitutes
- 4.1.5. Competitive Rivalry
- 4.2. PESTEL analysis
- 4.3. BCG Analysis
- 4.3.1. Stars (High Growth, High Market Share)
- 4.3.2. Cash Cows (Low Growth, High Market Share)
- 4.3.3. Question Mark (High Growth, Low Market Share)
- 4.3.4. Dogs (Low Growth, Low Market Share)
- 4.4. Ansoff Matrix Analysis
- 4.5. Supply Chain Analysis
- 4.6. Regulatory Landscape
- 4.7. Current Market Potential and Opportunity Assessment (TAM–SAM–SOM Framework)
- 4.8. MSR Analyst Note
- 4.1. Porters Five Forces
- 5. Market Analysis, Insights and Forecast 2021-2033
- 5.1. Market Analysis, Insights and Forecast - by Application
- 5.1.1. SME (Small and Medium Enterprises)
- 5.1.2. Large Enterprise
- 5.2. Market Analysis, Insights and Forecast - by Type
- 5.2.1. On-Premise
- 5.2.2. Cloud-based
- 5.3. Market Analysis, Insights and Forecast - by Region
- 5.3.1. North America
- 5.3.2. South America
- 5.3.3. Europe
- 5.3.4. Middle East & Africa
- 5.3.5. Asia Pacific
- 5.1. Market Analysis, Insights and Forecast - by Application
- 6. Global Overall Equipment Efficiency Oee Software Analysis, Insights and Forecast, 2021-2033
- 6.1. Market Analysis, Insights and Forecast - by Application
- 6.1.1. SME (Small and Medium Enterprises)
- 6.1.2. Large Enterprise
- 6.2. Market Analysis, Insights and Forecast - by Type
- 6.2.1. On-Premise
- 6.2.2. Cloud-based
- 6.1. Market Analysis, Insights and Forecast - by Application
- 7. North America Overall Equipment Efficiency Oee Software Analysis, Insights and Forecast, 2020-2032
- 7.1. Market Analysis, Insights and Forecast - by Application
- 7.1.1. SME (Small and Medium Enterprises)
- 7.1.2. Large Enterprise
- 7.2. Market Analysis, Insights and Forecast - by Type
- 7.2.1. On-Premise
- 7.2.2. Cloud-based
- 7.1. Market Analysis, Insights and Forecast - by Application
- 8. South America Overall Equipment Efficiency Oee Software Analysis, Insights and Forecast, 2020-2032
- 8.1. Market Analysis, Insights and Forecast - by Application
- 8.1.1. SME (Small and Medium Enterprises)
- 8.1.2. Large Enterprise
- 8.2. Market Analysis, Insights and Forecast - by Type
- 8.2.1. On-Premise
- 8.2.2. Cloud-based
- 8.1. Market Analysis, Insights and Forecast - by Application
- 9. Europe Overall Equipment Efficiency Oee Software Analysis, Insights and Forecast, 2020-2032
- 9.1. Market Analysis, Insights and Forecast - by Application
- 9.1.1. SME (Small and Medium Enterprises)
- 9.1.2. Large Enterprise
- 9.2. Market Analysis, Insights and Forecast - by Type
- 9.2.1. On-Premise
- 9.2.2. Cloud-based
- 9.1. Market Analysis, Insights and Forecast - by Application
- 10. Middle East & Africa Overall Equipment Efficiency Oee Software Analysis, Insights and Forecast, 2020-2032
- 10.1. Market Analysis, Insights and Forecast - by Application
- 10.1.1. SME (Small and Medium Enterprises)
- 10.1.2. Large Enterprise
- 10.2. Market Analysis, Insights and Forecast - by Type
- 10.2.1. On-Premise
- 10.2.2. Cloud-based
- 10.1. Market Analysis, Insights and Forecast - by Application
- 11. Asia Pacific Overall Equipment Efficiency Oee Software Analysis, Insights and Forecast, 2020-2032
- 11.1. Market Analysis, Insights and Forecast - by Application
- 11.1.1. SME (Small and Medium Enterprises)
- 11.1.2. Large Enterprise
- 11.2. Market Analysis, Insights and Forecast - by Type
- 11.2.1. On-Premise
- 11.2.2. Cloud-based
- 11.1. Market Analysis, Insights and Forecast - by Application
- 12. Competitive Analysis
- 12.1. Company Profiles
- 12.1.1 UpKeep Technologies
- 12.1.1.1. Company Overview
- 12.1.1.2. Products
- 12.1.1.3. Company Financials
- 12.1.1.4. SWOT Analysis
- 12.1.2 Rockwell Automation
- 12.1.2.1. Company Overview
- 12.1.2.2. Products
- 12.1.2.3. Company Financials
- 12.1.2.4. SWOT Analysis
- 12.1.3 Scout Systems
- 12.1.3.1. Company Overview
- 12.1.3.2. Products
- 12.1.3.3. Company Financials
- 12.1.3.4. SWOT Analysis
- 12.1.4 Lighthouse Systems
- 12.1.4.1. Company Overview
- 12.1.4.2. Products
- 12.1.4.3. Company Financials
- 12.1.4.4. SWOT Analysis
- 12.1.5 Evocon
- 12.1.5.1. Company Overview
- 12.1.5.2. Products
- 12.1.5.3. Company Financials
- 12.1.5.4. SWOT Analysis
- 12.1.6 Schneider Electric
- 12.1.6.1. Company Overview
- 12.1.6.2. Products
- 12.1.6.3. Company Financials
- 12.1.6.4. SWOT Analysis
- 12.1.7 OEEsystems
- 12.1.7.1. Company Overview
- 12.1.7.2. Products
- 12.1.7.3. Company Financials
- 12.1.7.4. SWOT Analysis
- 12.1.8 eschbach GmbH
- 12.1.8.1. Company Overview
- 12.1.8.2. Products
- 12.1.8.3. Company Financials
- 12.1.8.4. SWOT Analysis
- 12.1.9 ABB Enterprise Software
- 12.1.9.1. Company Overview
- 12.1.9.2. Products
- 12.1.9.3. Company Financials
- 12.1.9.4. SWOT Analysis
- 12.1.10 FlexLink Systems
- 12.1.10.1. Company Overview
- 12.1.10.2. Products
- 12.1.10.3. Company Financials
- 12.1.10.4. SWOT Analysis
- 12.1.11 5ME
- 12.1.11.1. Company Overview
- 12.1.11.2. Products
- 12.1.11.3. Company Financials
- 12.1.11.4. SWOT Analysis
- 12.1.12 Symbrium
- 12.1.12.1. Company Overview
- 12.1.12.2. Products
- 12.1.12.3. Company Financials
- 12.1.12.4. SWOT Analysis
- 12.1.13 MachineMetrics
- 12.1.13.1. Company Overview
- 12.1.13.2. Products
- 12.1.13.3. Company Financials
- 12.1.13.4. SWOT Analysis
- 12.1.1 UpKeep Technologies
- 12.2. Market Entropy
- 12.2.1 Company's Key Areas Served
- 12.2.2 Recent Developments
- 12.3. Company Market Share Analysis 2025
- 12.3.1 Top 5 Companies Market Share Analysis
- 12.3.2 Top 3 Companies Market Share Analysis
- 12.4. List of Potential Customers
- 13. Research Methodology
List of Figures
- Figure 1: Global Overall Equipment Efficiency Oee Software Revenue Breakdown (million, %) by Region 2025 & 2033
- Figure 2: North America Overall Equipment Efficiency Oee Software Revenue (million), by Application 2025 & 2033
- Figure 3: North America Overall Equipment Efficiency Oee Software Revenue Share (%), by Application 2025 & 2033
- Figure 4: North America Overall Equipment Efficiency Oee Software Revenue (million), by Type 2025 & 2033
- Figure 5: North America Overall Equipment Efficiency Oee Software Revenue Share (%), by Type 2025 & 2033
- Figure 6: North America Overall Equipment Efficiency Oee Software Revenue (million), by Country 2025 & 2033
- Figure 7: North America Overall Equipment Efficiency Oee Software Revenue Share (%), by Country 2025 & 2033
- Figure 8: South America Overall Equipment Efficiency Oee Software Revenue (million), by Application 2025 & 2033
- Figure 9: South America Overall Equipment Efficiency Oee Software Revenue Share (%), by Application 2025 & 2033
- Figure 10: South America Overall Equipment Efficiency Oee Software Revenue (million), by Type 2025 & 2033
- Figure 11: South America Overall Equipment Efficiency Oee Software Revenue Share (%), by Type 2025 & 2033
- Figure 12: South America Overall Equipment Efficiency Oee Software Revenue (million), by Country 2025 & 2033
- Figure 13: South America Overall Equipment Efficiency Oee Software Revenue Share (%), by Country 2025 & 2033
- Figure 14: Europe Overall Equipment Efficiency Oee Software Revenue (million), by Application 2025 & 2033
- Figure 15: Europe Overall Equipment Efficiency Oee Software Revenue Share (%), by Application 2025 & 2033
- Figure 16: Europe Overall Equipment Efficiency Oee Software Revenue (million), by Type 2025 & 2033
- Figure 17: Europe Overall Equipment Efficiency Oee Software Revenue Share (%), by Type 2025 & 2033
- Figure 18: Europe Overall Equipment Efficiency Oee Software Revenue (million), by Country 2025 & 2033
- Figure 19: Europe Overall Equipment Efficiency Oee Software Revenue Share (%), by Country 2025 & 2033
- Figure 20: Middle East & Africa Overall Equipment Efficiency Oee Software Revenue (million), by Application 2025 & 2033
- Figure 21: Middle East & Africa Overall Equipment Efficiency Oee Software Revenue Share (%), by Application 2025 & 2033
- Figure 22: Middle East & Africa Overall Equipment Efficiency Oee Software Revenue (million), by Type 2025 & 2033
- Figure 23: Middle East & Africa Overall Equipment Efficiency Oee Software Revenue Share (%), by Type 2025 & 2033
- Figure 24: Middle East & Africa Overall Equipment Efficiency Oee Software Revenue (million), by Country 2025 & 2033
- Figure 25: Middle East & Africa Overall Equipment Efficiency Oee Software Revenue Share (%), by Country 2025 & 2033
- Figure 26: Asia Pacific Overall Equipment Efficiency Oee Software Revenue (million), by Application 2025 & 2033
- Figure 27: Asia Pacific Overall Equipment Efficiency Oee Software Revenue Share (%), by Application 2025 & 2033
- Figure 28: Asia Pacific Overall Equipment Efficiency Oee Software Revenue (million), by Type 2025 & 2033
- Figure 29: Asia Pacific Overall Equipment Efficiency Oee Software Revenue Share (%), by Type 2025 & 2033
- Figure 30: Asia Pacific Overall Equipment Efficiency Oee Software Revenue (million), by Country 2025 & 2033
- Figure 31: Asia Pacific Overall Equipment Efficiency Oee Software Revenue Share (%), by Country 2025 & 2033
List of Tables
- Table 1: Global Overall Equipment Efficiency Oee Software Revenue million Forecast, by Application 2020 & 2033
- Table 2: Global Overall Equipment Efficiency Oee Software Revenue million Forecast, by Type 2020 & 2033
- Table 3: Global Overall Equipment Efficiency Oee Software Revenue million Forecast, by Region 2020 & 2033
- Table 4: Global Overall Equipment Efficiency Oee Software Revenue million Forecast, by Application 2020 & 2033
- Table 5: Global Overall Equipment Efficiency Oee Software Revenue million Forecast, by Type 2020 & 2033
- Table 6: Global Overall Equipment Efficiency Oee Software Revenue million Forecast, by Country 2020 & 2033
- Table 7: United States Overall Equipment Efficiency Oee Software Revenue (million) Forecast, by Application 2020 & 2033
- Table 8: Canada Overall Equipment Efficiency Oee Software Revenue (million) Forecast, by Application 2020 & 2033
- Table 9: Mexico Overall Equipment Efficiency Oee Software Revenue (million) Forecast, by Application 2020 & 2033
- Table 10: Global Overall Equipment Efficiency Oee Software Revenue million Forecast, by Application 2020 & 2033
- Table 11: Global Overall Equipment Efficiency Oee Software Revenue million Forecast, by Type 2020 & 2033
- Table 12: Global Overall Equipment Efficiency Oee Software Revenue million Forecast, by Country 2020 & 2033
- Table 13: Brazil Overall Equipment Efficiency Oee Software Revenue (million) Forecast, by Application 2020 & 2033
- Table 14: Argentina Overall Equipment Efficiency Oee Software Revenue (million) Forecast, by Application 2020 & 2033
- Table 15: Rest of South America Overall Equipment Efficiency Oee Software Revenue (million) Forecast, by Application 2020 & 2033
- Table 16: Global Overall Equipment Efficiency Oee Software Revenue million Forecast, by Application 2020 & 2033
- Table 17: Global Overall Equipment Efficiency Oee Software Revenue million Forecast, by Type 2020 & 2033
- Table 18: Global Overall Equipment Efficiency Oee Software Revenue million Forecast, by Country 2020 & 2033
- Table 19: United Kingdom Overall Equipment Efficiency Oee Software Revenue (million) Forecast, by Application 2020 & 2033
- Table 20: Germany Overall Equipment Efficiency Oee Software Revenue (million) Forecast, by Application 2020 & 2033
- Table 21: France Overall Equipment Efficiency Oee Software Revenue (million) Forecast, by Application 2020 & 2033
- Table 22: Italy Overall Equipment Efficiency Oee Software Revenue (million) Forecast, by Application 2020 & 2033
- Table 23: Spain Overall Equipment Efficiency Oee Software Revenue (million) Forecast, by Application 2020 & 2033
- Table 24: Russia Overall Equipment Efficiency Oee Software Revenue (million) Forecast, by Application 2020 & 2033
- Table 25: Benelux Overall Equipment Efficiency Oee Software Revenue (million) Forecast, by Application 2020 & 2033
- Table 26: Nordics Overall Equipment Efficiency Oee Software Revenue (million) Forecast, by Application 2020 & 2033
- Table 27: Rest of Europe Overall Equipment Efficiency Oee Software Revenue (million) Forecast, by Application 2020 & 2033
- Table 28: Global Overall Equipment Efficiency Oee Software Revenue million Forecast, by Application 2020 & 2033
- Table 29: Global Overall Equipment Efficiency Oee Software Revenue million Forecast, by Type 2020 & 2033
- Table 30: Global Overall Equipment Efficiency Oee Software Revenue million Forecast, by Country 2020 & 2033
- Table 31: Turkey Overall Equipment Efficiency Oee Software Revenue (million) Forecast, by Application 2020 & 2033
- Table 32: Israel Overall Equipment Efficiency Oee Software Revenue (million) Forecast, by Application 2020 & 2033
- Table 33: GCC Overall Equipment Efficiency Oee Software Revenue (million) Forecast, by Application 2020 & 2033
- Table 34: North Africa Overall Equipment Efficiency Oee Software Revenue (million) Forecast, by Application 2020 & 2033
- Table 35: South Africa Overall Equipment Efficiency Oee Software Revenue (million) Forecast, by Application 2020 & 2033
- Table 36: Rest of Middle East & Africa Overall Equipment Efficiency Oee Software Revenue (million) Forecast, by Application 2020 & 2033
- Table 37: Global Overall Equipment Efficiency Oee Software Revenue million Forecast, by Application 2020 & 2033
- Table 38: Global Overall Equipment Efficiency Oee Software Revenue million Forecast, by Type 2020 & 2033
- Table 39: Global Overall Equipment Efficiency Oee Software Revenue million Forecast, by Country 2020 & 2033
- Table 40: China Overall Equipment Efficiency Oee Software Revenue (million) Forecast, by Application 2020 & 2033
- Table 41: India Overall Equipment Efficiency Oee Software Revenue (million) Forecast, by Application 2020 & 2033
- Table 42: Japan Overall Equipment Efficiency Oee Software Revenue (million) Forecast, by Application 2020 & 2033
- Table 43: South Korea Overall Equipment Efficiency Oee Software Revenue (million) Forecast, by Application 2020 & 2033
- Table 44: ASEAN Overall Equipment Efficiency Oee Software Revenue (million) Forecast, by Application 2020 & 2033
- Table 45: Oceania Overall Equipment Efficiency Oee Software Revenue (million) Forecast, by Application 2020 & 2033
- Table 46: Rest of Asia Pacific Overall Equipment Efficiency Oee Software Revenue (million) Forecast, by Application 2020 & 2033
Frequently Asked Questions
1. What is the projected Compound Annual Growth Rate (CAGR) of the Overall Equipment Efficiency Oee Software?
The projected CAGR is approximately XXX%.
2. Which companies are prominent players in the Overall Equipment Efficiency Oee Software?
Key companies in the market include UpKeep Technologies, Rockwell Automation, Scout Systems, Lighthouse Systems, Evocon, Schneider Electric, OEEsystems, eschbach GmbH, ABB Enterprise Software, FlexLink Systems, 5ME, Symbrium, MachineMetrics.
3. What are the main segments of the Overall Equipment Efficiency Oee Software?
The market segments include Application, Type.
4. Can you provide details about the market size?
The market size is estimated to be USD XXX million as of 2022.
5. What are some drivers contributing to market growth?
N/A
6. What are the notable trends driving market growth?
N/A
7. Are there any restraints impacting market growth?
N/A
8. Can you provide examples of recent developments in the market?
N/A
9. What pricing options are available for accessing the report?
Pricing options include single-user, multi-user, and enterprise licenses priced at USD 3950.00, USD 5925.00, and USD 7900.00 respectively.
10. Is the market size provided in terms of value or volume?
The market size is provided in terms of value, measured in million.
11. Are there any specific market keywords associated with the report?
Yes, the market keyword associated with the report is "Overall Equipment Efficiency Oee Software," which aids in identifying and referencing the specific market segment covered.
12. How do I determine which pricing option suits my needs best?
The pricing options vary based on user requirements and access needs. Individual users may opt for single-user licenses, while businesses requiring broader access may choose multi-user or enterprise licenses for cost-effective access to the report.
13. Are there any additional resources or data provided in the Overall Equipment Efficiency Oee Software report?
While the report offers comprehensive insights, it's advisable to review the specific contents or supplementary materials provided to ascertain if additional resources or data are available.
14. How can I stay updated on further developments or reports in the Overall Equipment Efficiency Oee Software?
To stay informed about further developments, trends, and reports in the Overall Equipment Efficiency Oee Software, consider subscribing to industry newsletters, following relevant companies and organizations, or regularly checking reputable industry news sources and publications.
Methodology
Step 1 - Identification of Relevant Samples Size from Population Database


Step 2 - Approaches for Defining Global Market Size (Value, Volume* & Price*)

Note*: In applicable scenarios
Step 3 - Data Sources
Primary Research
- Web Analytics
- Survey Reports
- Research Institute
- Latest Research Reports
- Opinion Leaders
Secondary Research
- Annual Reports
- White Paper
- Latest Press Release
- Industry Association
- Paid Database
- Investor Presentations

Step 4 - Data Triangulation
Involves using different sources of information in order to increase the validity of a study
These sources are likely to be stakeholders in a program - participants, other researchers, program staff, other community members, and so on.
Then we put all data in single framework & apply various statistical tools to find out the dynamic on the market.
During the analysis stage, feedback from the stakeholder groups would be compared to determine areas of agreement as well as areas of divergence