

Key Insights
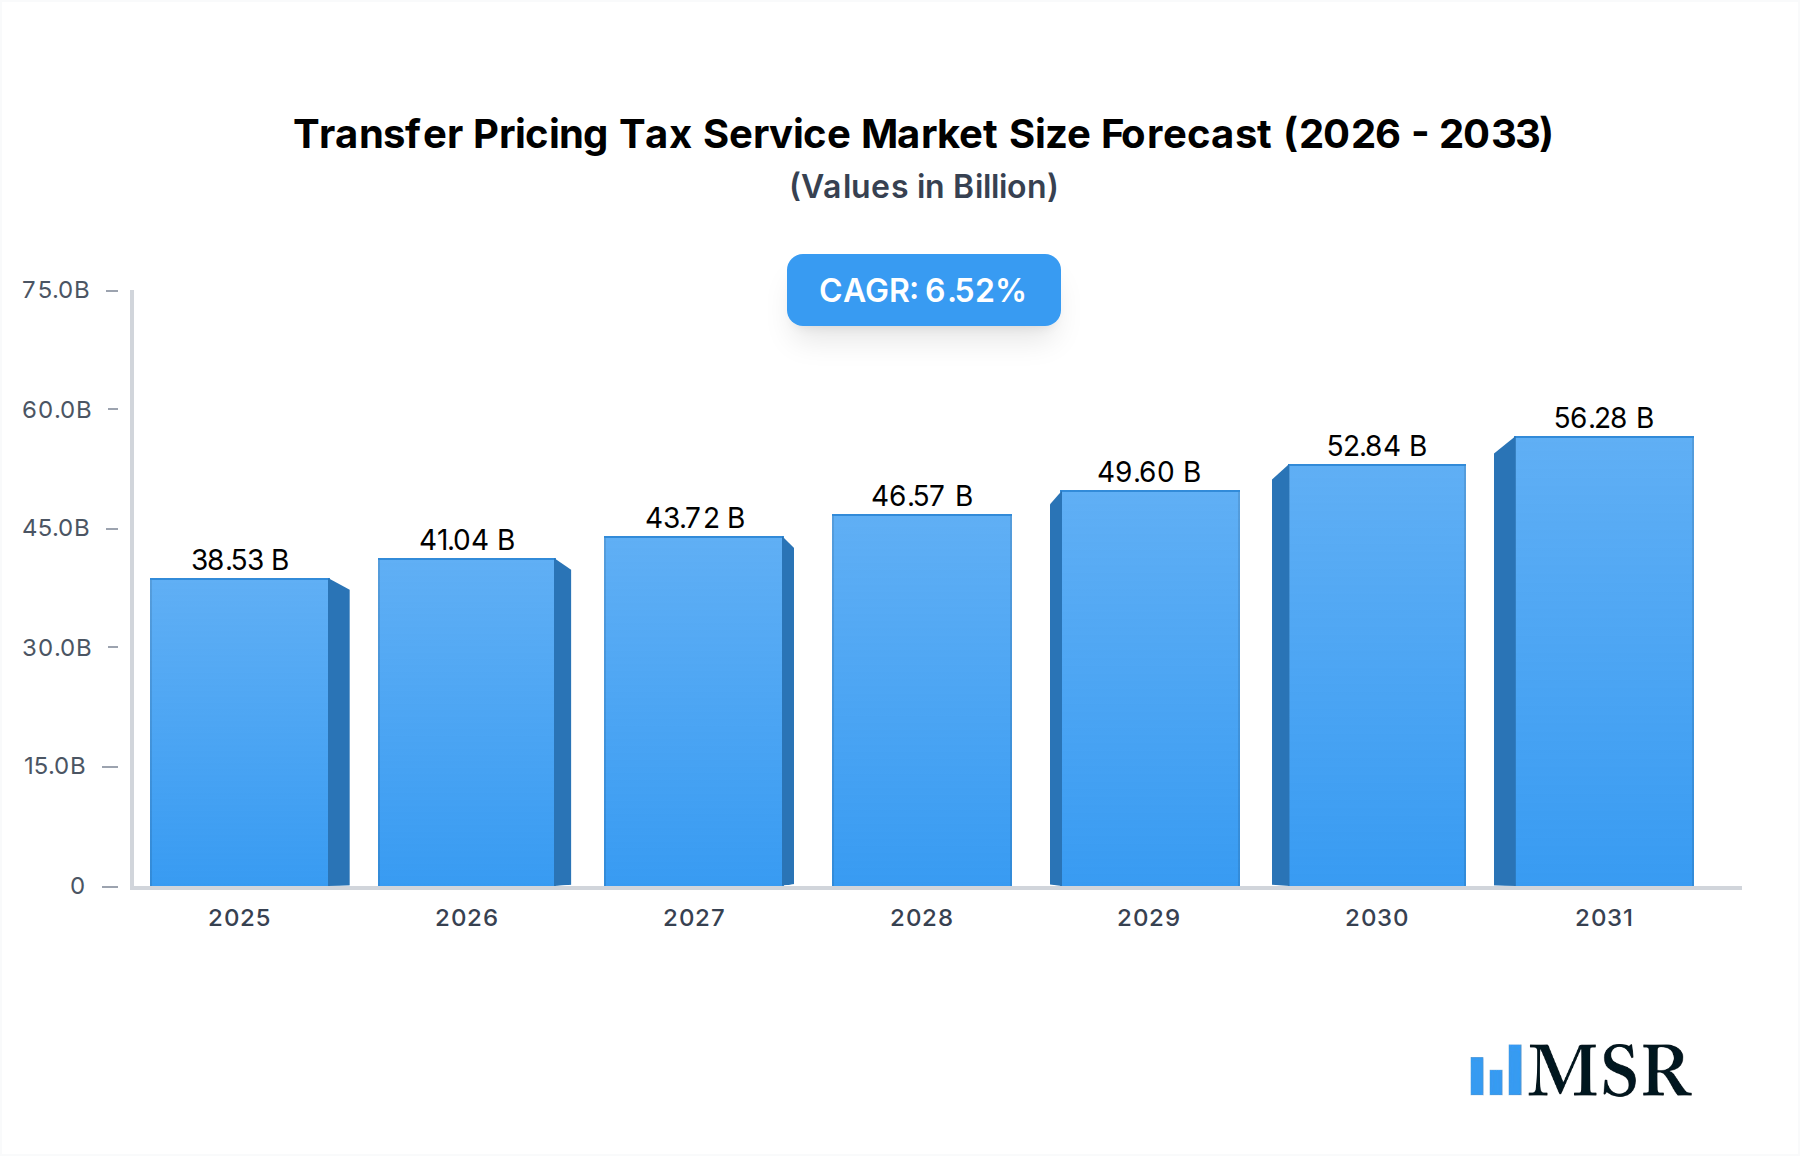
The Transfer Pricing Tax Service Market, a pivotal segment within the broader Professional Service Market, was valued at $36.17 billion in 2023. Projections indicate robust expansion, with the market expected to reach approximately $71.95 billion by 2034, demonstrating a compound annual growth rate (CAGR) of 6.52% over the forecast period. This growth trajectory is primarily propelled by the increasing complexity of global tax regulations, particularly the ongoing implementation of the OECD's Base Erosion and Profit Shifting (BEPS) initiatives and Pillar One and Two frameworks, which necessitate sophisticated advisory and compliance solutions for multinational enterprises (MNEs). The rising volume of Cross-Border Transaction Market activities further amplifies the demand for expert transfer pricing guidance, as companies strive to align their intercompany pricing strategies with arm's length principles and avoid costly disputes.

Transfer Pricing Tax Service Market Size (In Billion)
Technological advancements, including the proliferation of Compliance Software Market solutions and the emergence of advanced analytics within the Regulatory Technology Market, are transforming service delivery, enhancing efficiency in documentation and risk assessment. The imperative for tax efficiency and risk mitigation, combined with intensified scrutiny from tax authorities worldwide, underscores the critical role of specialized transfer pricing services. Firms are increasingly seeking strategic counsel on value chain optimization, robust compliance frameworks, and proactive dispute resolution mechanisms. While Large Enterprise Service Market remains the dominant end-user segment, the growing globalization of Small & Medium Enterprises (SMEs) is expanding the client base, albeit with tailored service requirements. The dynamic interplay of regulatory evolution, technological integration, and the intrinsic need for MNEs to manage their global tax footprint strategically ensures a sustained and significant demand for services in the Transfer Pricing Tax Service Market.
Transfer Pricing Tax Service Company Market Share
Advisory & Value Chain Optimisation Segment Dominates the Transfer Pricing Tax Service Market
The Advisory & Value Chain Optimisation segment currently holds the largest revenue share within the Transfer Pricing Tax Service Market, a trend anticipated to persist throughout the forecast period. This dominance stems from the inherently high-value, strategic nature of these services, which extend beyond mere compliance to encompass critical business restructuring and profit alignment. MNEs, operating across diverse jurisdictions, face immense pressure to optimize their global supply chains and operational models while ensuring tax efficiency and regulatory adherence. Advisory services provide bespoke solutions for designing and implementing transfer pricing policies that are not only compliant with complex local and international regulations but also support the broader commercial objectives of the enterprise.
Key players like PwC, EY, Deloitte, and KPMG are particularly strong in this segment, leveraging their extensive global networks, deep industry expertise, and multidisciplinary capabilities. They offer services ranging from initial risk assessments and policy design to post-implementation review and strategic re-alignment, often involving complex economic analyses and legal interpretations. The segment's growth is further fueled by ongoing regulatory changes, such as the OECD's BEPS project and the impending Pillar Two global minimum tax, which compel companies to reassess and restructure their intercompany transactions and legal entity structures. This environment necessitates sophisticated guidance to identify efficiencies, mitigate risks, and ensure defensible tax positions, distinguishing it from the more routine, although essential, Compliance & Documentation services. The need for expert insights in navigating these intricate changes reinforces the preeminent position of the Advisory & Value Chain Optimisation segment in the Transfer Pricing Tax Service Market, driving demand for specialized International Tax Service Market expertise and advanced analytical tools to model scenarios and assess impacts. The strategic importance of these services to an MNE's overall profitability and operational resilience underpins its leading market share, signifying its indispensable role in the modern tax landscape.
Evolving Regulatory Landscape & Digitalization Driving Growth in the Transfer Pricing Tax Service Market
Several potent forces are collectively driving significant expansion within the Transfer Pricing Tax Service Market. Foremost among these is the rapidly evolving global regulatory landscape. The continuous refinement and expansion of the OECD's Base Erosion and Profit Shifting (BEPS) framework, including the recent developments around Pillar One and Pillar Two initiatives, are creating an unprecedented demand for expert transfer pricing services. For instance, the proposed implementation of a 15% global minimum corporate tax under Pillar Two will necessitate that MNEs, particularly those with revenues above €750 million, meticulously reassess and potentially restructure their intercompany transactions and legal entity structures. This regulatory pressure is further exacerbated by the increasing number of countries adopting or adapting BEPS-aligned regulations, leading to a complex patchwork of compliance requirements. In 2023, over 140 jurisdictions are actively participating in the Inclusive Framework on BEPS, each potentially introducing nuanced local interpretations that require specialized advisory for effective navigation.
Another significant driver is the accelerating pace of digitalization and the integration of advanced data analytics. The volume of digital data generated by MNEs has grown exponentially, with global data generation projected to reach over 180 zettabytes by 2025. This data proliferation, coupled with the advent of AI and machine learning, is transforming both the challenges and solutions in transfer pricing. Firms are increasingly leveraging technology for data collection, analysis, and automated documentation, impacting the efficiency of the Compliance Software Market. Furthermore, tax authorities are also enhancing their data analysis capabilities, leading to more targeted audits and increasing the need for robust, data-backed transfer pricing defenses. The demand for services that can effectively harness this data to build compelling economic arguments and streamline compliance processes is intensifying. These drivers, coupled with the increasing volume and complexity of globalized business operations and the overarching need for strategic Financial Consulting Service Market advice, collectively underscore the sustained growth trajectory of the Transfer Pricing Tax Service Market, pushing companies to invest in more sophisticated and integrated tax strategies.
Competitive Ecosystem of Transfer Pricing Tax Service Market
The Transfer Pricing Tax Service Market is characterized by a mix of global professional service networks, specialized tax consultancies, and technology providers. The competitive landscape is dominated by the 'Big Four' accounting firms due to their extensive global reach, multidisciplinary expertise, and long-standing client relationships. However, a robust ecosystem of mid-tier firms and niche specialists also thrives by offering tailored solutions and deep-dive expertise.
- PwC: A global leader, offering comprehensive transfer pricing services encompassing advisory, compliance, controversy management, and value chain transformation, leveraging its vast global network and technological investments.
- EY: Renowned for its integrated approach to transfer pricing, providing strategic advice on policy design, documentation, and dispute resolution, often emphasizing data analytics and digital tools.
- Deloitte: Focuses on helping MNEs align transfer pricing strategies with their business objectives and supply chain structures, offering services from planning and implementation to controversy support, with a strong emphasis on technology-enabled solutions.
- KPMG: Delivers services across the entire transfer pricing lifecycle, including strategy, documentation, implementation, and defense, with a notable specialization in sector-specific challenges and regulatory changes.
- RSM International: A leading mid-tier provider offering tailored transfer pricing solutions for middle-market companies and large enterprises, focusing on practical advice and cost-effective compliance.
- Crowe: Provides comprehensive transfer pricing assistance, including planning, documentation, and audit defense, emphasizing a client-centric approach and leveraging global resources.
- Grant Thornton: Offers proactive and practical transfer pricing advice to a diverse client base, assisting with policy formulation, documentation, and managing tax authority interactions globally.
- Cherry Bekaert: Specializes in delivering strategic tax advisory services, including transfer pricing, for growth-oriented companies, focusing on optimizing tax positions and mitigating risks.
- BDO: A significant global network offering a wide range of transfer pricing services, known for its strong relationships with clients and practical, commercially focused advice.
- CohnReznick: Provides transfer pricing expertise, assisting clients with compliance, planning, and controversy issues, often serving private equity-backed and middle-market businesses.
- CBIZ: Offers specialized transfer pricing solutions aimed at helping businesses manage their intercompany transactions and comply with complex international tax regulations.
- CliftonLarsonAllen (CLA): Delivers transfer pricing consulting and compliance services, helping MNEs develop robust and defensible transfer pricing policies.
- EisnerAmper: Provides strategic transfer pricing planning, documentation, and defense services, assisting clients in navigating intricate international tax landscapes.
- Moss Adams: Focuses on delivering practical and defensible transfer pricing solutions, particularly for privately held and middle-market companies.
- Kroll: Known for its independent valuation and economic analysis capabilities, which are crucial for transfer pricing documentation and dispute resolution, complementing broader tax services.
- Tax Consultants International: A specialized firm offering focused transfer pricing expertise, often serving niche markets or providing bespoke solutions for specific industry challenges.
- Thomson Reuters: Primarily a technology and information provider, its ONESOURCE Transfer Pricing solution is crucial for many firms, offering data, software, and content for transfer pricing compliance and analysis, making it a key enabler in the market.
- HLS Global: Provides specialized cross-border tax and transfer pricing services, assisting MNEs with complex international compliance and advisory needs.
Recent Developments & Milestones in Transfer Pricing Tax Service Market
The Transfer Pricing Tax Service Market has witnessed several pivotal developments reflecting the dynamic interplay of regulatory evolution, technological innovation, and strategic consolidations:
- November 2023: Several national tax authorities, including Germany and France, released updated guidance on the application of the arm's length principle to financial transactions, particularly regarding intra-group financing arrangements, prompting MNEs to review existing policies and seek advisory services. This move underscores the continuous refinement required in the Tax Advisory Service Market.
- January 2024: Major global professional services firms, including EY and Deloitte, announced significant investments in artificial intelligence and machine learning platforms aimed at enhancing their transfer pricing documentation and risk assessment capabilities, indicating a strong push towards digital transformation within the Global Business Service Market.
- March 2024: The OECD published its comprehensive Administrative Guidance on Pillar Two, providing further clarity on the global minimum tax rules. This milestone triggered an immediate surge in demand for strategic impact assessments and implementation planning services across the Transfer Pricing Tax Service Market, especially concerning effective tax rate calculations and deferred tax accounting implications.
- May 2024: Several specialized tax technology providers launched enhanced cloud-based Compliance Software Market solutions, integrating new functionalities for country-by-country reporting (CbCR) data aggregation and automatic exchange of information (AEOI) compliance, targeting both large enterprises and growing SMEs seeking more efficient compliance processes.
- July 2024: A prominent North American regional accounting firm, CliftonLarsonAllen (CLA), expanded its international tax practice with the acquisition of a boutique transfer pricing consultancy, signaling strategic inorganic growth aimed at bolstering expertise in response to increasing client demand for specialized services.
Regional Market Breakdown for Transfer Pricing Tax Service Market
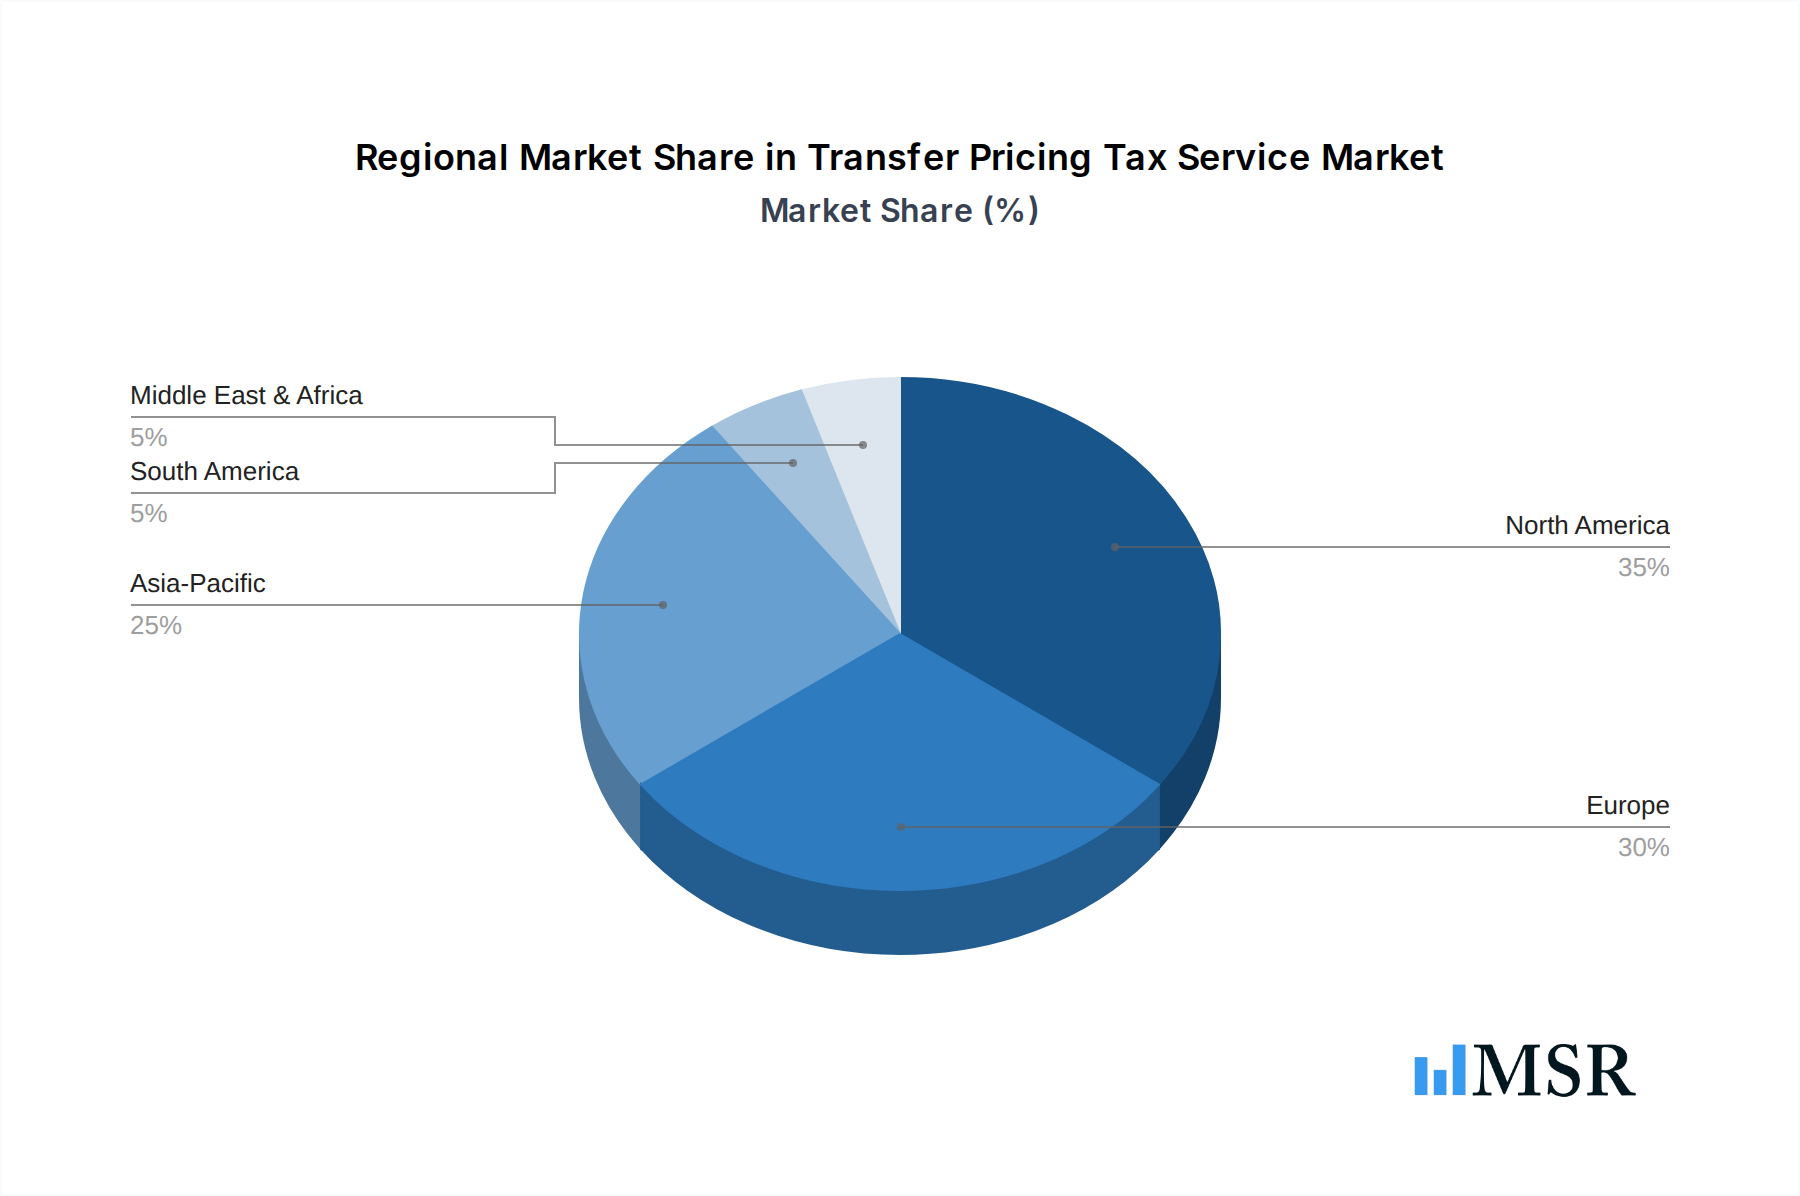
The Transfer Pricing Tax Service Market demonstrates significant regional variations driven by differing regulatory environments, economic development, and MNE presence. North America and Europe collectively represent the largest revenue shares, while the Asia Pacific region is projected to exhibit the fastest growth over the forecast period.
North America: This region holds a substantial market share, driven by a high concentration of MNE headquarters and an intricate tax landscape. The United States, in particular, with its vast economy and sophisticated regulatory framework (including IRS Section 482), generates significant demand for both advisory and compliance services. Canada and Mexico, as key trading partners, also contribute to the robust demand for cross-border transfer pricing solutions. The region's maturity often leads to a higher demand for controversy and dispute resolution services. The Large Enterprise Service Market in this region is well-established, contributing significantly.
Europe: Europe constitutes another dominant segment, characterized by a diverse regulatory environment influenced by both EU directives and individual national tax laws. Countries like Germany, France, and the UK are major hubs for MNE operations, driving strong demand for transfer pricing planning, documentation, and implementation services. The ongoing implementation of BEPS and Pillar Two within the EU further accelerates the need for strategic guidance and compliance updates. The region's economic stability and extensive Cross-Border Transaction Market volumes ensure sustained demand.
Asia Pacific: This region is anticipated to be the fastest-growing market for transfer pricing services, propelled by rapid economic expansion, increasing foreign direct investment, and evolving tax regulations in emerging economies. China and India, with their massive industrial bases and increasing integration into the global economy, present immense opportunities. Japan and South Korea, mature economies with established MNEs, also contribute significantly. The increasing sophistication of tax authorities in ASEAN countries and Oceania creates a strong demand for proactive compliance and advisory services. The growth in the Manufacturing Sector Market within APAC specifically fuels this expansion.
Middle East & Africa (MEA): While currently holding a smaller share, the MEA region is experiencing notable growth, particularly in the GCC countries and South Africa. This growth is driven by economic diversification efforts, increasing foreign investment, and the introduction or strengthening of transfer pricing regulations. As these economies mature and integrate further into global trade, the demand for foundational transfer pricing services, including policy design and documentation, is rising steadily.
South America: This region demonstrates steady growth, with Brazil and Argentina being key markets. The complex and frequently changing tax regulations, coupled with significant trade flows, necessitate specialized transfer pricing expertise. However, economic volatility can occasionally impact the pace of market development. The need for the BFSI Industry Market and others to navigate local regulations is a key driver here.
Transfer Pricing Tax Service Regional Market Share
Export, Trade Flow & Tariff Impact on Transfer Pricing Tax Service Market
The dynamics of global trade, export volumes, and the imposition of tariffs or non-tariff barriers have an indirect yet significant impact on the Transfer Pricing Tax Service Market. While direct tariffs are not levied on professional services themselves, their effect on the underlying Cross-Border Transaction Market—the subject of transfer pricing—is profound. For instance, increased tariffs on goods exchanged between the US and China can alter the profitability of intercompany sales of tangible goods, thereby necessitating a re-evaluation of transfer pricing policies to maintain arm's length principles and avoid double taxation. If a tariff dramatically shifts the profit allocation within a value chain, MNEs require expert advice to adjust their transfer prices accordingly and update their documentation.
Major trade corridors, such as those connecting North America with Europe and Asia Pacific, generate the highest volume of complex intercompany transactions. These corridors are also frequently subject to evolving trade agreements and potential trade disputes, which can create uncertainty in supply chains and impact the functional analysis underpinning transfer pricing studies. Leading exporting nations, often those with strong manufacturing bases or extensive R&D activities (e.g., Germany, China, USA), necessitate robust transfer pricing frameworks for their outbound transactions. Conversely, major importing nations must ensure their inbound transfer pricing is defensible against local tax authority scrutiny.
Non-tariff barriers, such as data localization requirements or stringent customs valuation rules, also impose indirect costs and complexities. For instance, data localization laws can complicate the centralized management of transfer pricing data, potentially leading to increased compliance costs. While traditional tariffs have a direct impact on the cost of goods, the more significant impact on the Transfer Pricing Tax Service Market comes from how these trade policies alter the underlying economic realities and risk profiles of MNEs, necessitating sophisticated analysis and adaptive strategies from specialized service providers. Digital service taxes (DSTs), while not tariffs, represent a form of cross-border tax imposition on digital services that can influence the valuation of intercompany services, adding another layer of complexity to the International Tax Service Market.
Supply Chain & Raw Material Dynamics for Transfer Pricing Tax Service Market
For a service-oriented sector like the Transfer Pricing Tax Service Market, the concept of "raw materials" and "supply chain" takes on a distinct meaning. The primary "raw material" is highly specialized human capital – specifically, tax economists, tax attorneys, financial analysts, and seasoned tax professionals with deep expertise in international taxation and valuation methodologies. The availability and cost of this talent are critical upstream dependencies. Sourcing risks include a global shortage of such specialized professionals, particularly those adept at navigating complex digital economy taxation or specific industry verticals. Wage inflation for these experts, especially in competitive markets like North America and Europe, directly impacts the service providers' operational costs and pricing strategies. For instance, salaries for senior transfer pricing specialists have seen a consistent upward trend of 5-8% annually in key markets.
Another crucial "raw material" is access to proprietary databases and analytical software. Providers rely heavily on subscription-based economic databases (e.g., Bureau van Dijk, S&P Global), industry-specific benchmarks, and advanced Compliance Software Market platforms to conduct comparability analyses, financial modeling, and documentation. Price volatility in these software licenses and data subscriptions, while generally stable, can affect service delivery costs. Dependence on a few dominant vendors for these tools poses a potential supply chain risk in terms of software updates, data integrity, and service continuity. Firms like Thomson Reuters, through its ONESOURCE platform, are key technology providers in this upstream ecosystem, influencing the efficiency and cost structure of the broader Regulatory Technology Market services.
The "supply chain" for transfer pricing services also involves a robust internal knowledge management system, continuous professional development, and strategic partnerships. Disruptions, such as a high turnover of skilled staff or cybersecurity breaches affecting proprietary data and client information, can severely impact service quality and delivery. The ability to recruit, train, and retain top-tier talent is paramount, as is ensuring the security and integrity of sensitive client financial data. Historically, talent drain to in-house corporate tax departments or competing firms has forced service providers to invest heavily in talent acquisition and retention strategies, directly affecting the overall market's operational resilience and growth potential.
Transfer Pricing Tax Service Segmentation
-
1. Service Type
- 1.1. Advisory & Value Chain Optimisation
- 1.2. Compliance & Documentation
- 1.3. Implementation & Compliance Management
- 1.4. Controversy & Dispute Resolution
- 1.5. Others
-
2. Enterprise Size
- 2.1. Large Enterprises
- 2.2. Small & Medium Enterprises (SMEs)
-
3. Geographical Scope
- 3.1. Domestic
- 3.2. Cross-Border
-
4. End User Industry
- 4.1. BFSI
- 4.2. Information Technology & Telecom
- 4.3. Manufacturing
- 4.4. Healthcare & Pharmaceuticals
- 4.5. Retail & E-commerce
- 4.6. Energy & Utilities
- 4.7. Automotive
- 4.8. Consumer Goods
- 4.9. Others
Transfer Pricing Tax Service Segmentation By Geography
-
1. North America
- 1.1. United States
- 1.2. Canada
- 1.3. Mexico
-
2. South America
- 2.1. Brazil
- 2.2. Argentina
- 2.3. Rest of South America
-
3. Europe
- 3.1. United Kingdom
- 3.2. Germany
- 3.3. France
- 3.4. Italy
- 3.5. Spain
- 3.6. Russia
- 3.7. Benelux
- 3.8. Nordics
- 3.9. Rest of Europe
-
4. Middle East & Africa
- 4.1. Turkey
- 4.2. Israel
- 4.3. GCC
- 4.4. North Africa
- 4.5. South Africa
- 4.6. Rest of Middle East & Africa
-
5. Asia Pacific
- 5.1. China
- 5.2. India
- 5.3. Japan
- 5.4. South Korea
- 5.5. ASEAN
- 5.6. Oceania
- 5.7. Rest of Asia Pacific
Transfer Pricing Tax Service Regional Market Share
Geographic Coverage of Transfer Pricing Tax Service
Transfer Pricing Tax Service REPORT HIGHLIGHTS
| Aspects | Details |
|---|---|
| Study Period | 2020-2034 |
| Base Year | 2025 |
| Estimated Year | 2026 |
| Forecast Period | 2026-2034 |
| Historical Period | 2020-2025 |
| Growth Rate | CAGR of 6.52% from 2020-2034 |
| Segmentation |
|
Table of Contents
- 1. Introduction
- 1.1. Research Scope
- 1.2. Market Segmentation
- 1.3. Research Objective
- 1.4. Definitions and Assumptions
- 2. Executive Summary
- 2.1. Market Snapshot
- 3. Market Dynamics
- 3.1. Market Drivers
- 3.2. Market Restrains
- 3.3. Market Trends
- 3.4. Market Opportunities
- 4. Market Factor Analysis
- 4.1. Porters Five Forces
- 4.1.1. Bargaining Power of Suppliers
- 4.1.2. Bargaining Power of Buyers
- 4.1.3. Threat of New Entrants
- 4.1.4. Threat of Substitutes
- 4.1.5. Competitive Rivalry
- 4.2. PESTEL analysis
- 4.3. BCG Analysis
- 4.3.1. Stars (High Growth, High Market Share)
- 4.3.2. Cash Cows (Low Growth, High Market Share)
- 4.3.3. Question Mark (High Growth, Low Market Share)
- 4.3.4. Dogs (Low Growth, Low Market Share)
- 4.4. Ansoff Matrix Analysis
- 4.5. Supply Chain Analysis
- 4.6. Regulatory Landscape
- 4.7. Current Market Potential and Opportunity Assessment (TAM–SAM–SOM Framework)
- 4.8. MSR Analyst Note
- 4.1. Porters Five Forces
- 5. Market Analysis, Insights and Forecast 2021-2033
- 5.1. Market Analysis, Insights and Forecast - by Service Type
- 5.1.1. Advisory & Value Chain Optimisation
- 5.1.2. Compliance & Documentation
- 5.1.3. Implementation & Compliance Management
- 5.1.4. Controversy & Dispute Resolution
- 5.1.5. Others
- 5.2. Market Analysis, Insights and Forecast - by Enterprise Size
- 5.2.1. Large Enterprises
- 5.2.2. Small & Medium Enterprises (SMEs)
- 5.3. Market Analysis, Insights and Forecast - by Geographical Scope
- 5.3.1. Domestic
- 5.3.2. Cross-Border
- 5.4. Market Analysis, Insights and Forecast - by End User Industry
- 5.4.1. BFSI
- 5.4.2. Information Technology & Telecom
- 5.4.3. Manufacturing
- 5.4.4. Healthcare & Pharmaceuticals
- 5.4.5. Retail & E-commerce
- 5.4.6. Energy & Utilities
- 5.4.7. Automotive
- 5.4.8. Consumer Goods
- 5.4.9. Others
- 5.5. Market Analysis, Insights and Forecast - by Region
- 5.5.1. North America
- 5.5.2. South America
- 5.5.3. Europe
- 5.5.4. Middle East & Africa
- 5.5.5. Asia Pacific
- 5.1. Market Analysis, Insights and Forecast - by Service Type
- 6. Global Transfer Pricing Tax Service Analysis, Insights and Forecast, 2021-2033
- 6.1. Market Analysis, Insights and Forecast - by Service Type
- 6.1.1. Advisory & Value Chain Optimisation
- 6.1.2. Compliance & Documentation
- 6.1.3. Implementation & Compliance Management
- 6.1.4. Controversy & Dispute Resolution
- 6.1.5. Others
- 6.2. Market Analysis, Insights and Forecast - by Enterprise Size
- 6.2.1. Large Enterprises
- 6.2.2. Small & Medium Enterprises (SMEs)
- 6.3. Market Analysis, Insights and Forecast - by Geographical Scope
- 6.3.1. Domestic
- 6.3.2. Cross-Border
- 6.4. Market Analysis, Insights and Forecast - by End User Industry
- 6.4.1. BFSI
- 6.4.2. Information Technology & Telecom
- 6.4.3. Manufacturing
- 6.4.4. Healthcare & Pharmaceuticals
- 6.4.5. Retail & E-commerce
- 6.4.6. Energy & Utilities
- 6.4.7. Automotive
- 6.4.8. Consumer Goods
- 6.4.9. Others
- 6.1. Market Analysis, Insights and Forecast - by Service Type
- 7. North America Transfer Pricing Tax Service Analysis, Insights and Forecast, 2020-2032
- 7.1. Market Analysis, Insights and Forecast - by Service Type
- 7.1.1. Advisory & Value Chain Optimisation
- 7.1.2. Compliance & Documentation
- 7.1.3. Implementation & Compliance Management
- 7.1.4. Controversy & Dispute Resolution
- 7.1.5. Others
- 7.2. Market Analysis, Insights and Forecast - by Enterprise Size
- 7.2.1. Large Enterprises
- 7.2.2. Small & Medium Enterprises (SMEs)
- 7.3. Market Analysis, Insights and Forecast - by Geographical Scope
- 7.3.1. Domestic
- 7.3.2. Cross-Border
- 7.4. Market Analysis, Insights and Forecast - by End User Industry
- 7.4.1. BFSI
- 7.4.2. Information Technology & Telecom
- 7.4.3. Manufacturing
- 7.4.4. Healthcare & Pharmaceuticals
- 7.4.5. Retail & E-commerce
- 7.4.6. Energy & Utilities
- 7.4.7. Automotive
- 7.4.8. Consumer Goods
- 7.4.9. Others
- 7.1. Market Analysis, Insights and Forecast - by Service Type
- 8. South America Transfer Pricing Tax Service Analysis, Insights and Forecast, 2020-2032
- 8.1. Market Analysis, Insights and Forecast - by Service Type
- 8.1.1. Advisory & Value Chain Optimisation
- 8.1.2. Compliance & Documentation
- 8.1.3. Implementation & Compliance Management
- 8.1.4. Controversy & Dispute Resolution
- 8.1.5. Others
- 8.2. Market Analysis, Insights and Forecast - by Enterprise Size
- 8.2.1. Large Enterprises
- 8.2.2. Small & Medium Enterprises (SMEs)
- 8.3. Market Analysis, Insights and Forecast - by Geographical Scope
- 8.3.1. Domestic
- 8.3.2. Cross-Border
- 8.4. Market Analysis, Insights and Forecast - by End User Industry
- 8.4.1. BFSI
- 8.4.2. Information Technology & Telecom
- 8.4.3. Manufacturing
- 8.4.4. Healthcare & Pharmaceuticals
- 8.4.5. Retail & E-commerce
- 8.4.6. Energy & Utilities
- 8.4.7. Automotive
- 8.4.8. Consumer Goods
- 8.4.9. Others
- 8.1. Market Analysis, Insights and Forecast - by Service Type
- 9. Europe Transfer Pricing Tax Service Analysis, Insights and Forecast, 2020-2032
- 9.1. Market Analysis, Insights and Forecast - by Service Type
- 9.1.1. Advisory & Value Chain Optimisation
- 9.1.2. Compliance & Documentation
- 9.1.3. Implementation & Compliance Management
- 9.1.4. Controversy & Dispute Resolution
- 9.1.5. Others
- 9.2. Market Analysis, Insights and Forecast - by Enterprise Size
- 9.2.1. Large Enterprises
- 9.2.2. Small & Medium Enterprises (SMEs)
- 9.3. Market Analysis, Insights and Forecast - by Geographical Scope
- 9.3.1. Domestic
- 9.3.2. Cross-Border
- 9.4. Market Analysis, Insights and Forecast - by End User Industry
- 9.4.1. BFSI
- 9.4.2. Information Technology & Telecom
- 9.4.3. Manufacturing
- 9.4.4. Healthcare & Pharmaceuticals
- 9.4.5. Retail & E-commerce
- 9.4.6. Energy & Utilities
- 9.4.7. Automotive
- 9.4.8. Consumer Goods
- 9.4.9. Others
- 9.1. Market Analysis, Insights and Forecast - by Service Type
- 10. Middle East & Africa Transfer Pricing Tax Service Analysis, Insights and Forecast, 2020-2032
- 10.1. Market Analysis, Insights and Forecast - by Service Type
- 10.1.1. Advisory & Value Chain Optimisation
- 10.1.2. Compliance & Documentation
- 10.1.3. Implementation & Compliance Management
- 10.1.4. Controversy & Dispute Resolution
- 10.1.5. Others
- 10.2. Market Analysis, Insights and Forecast - by Enterprise Size
- 10.2.1. Large Enterprises
- 10.2.2. Small & Medium Enterprises (SMEs)
- 10.3. Market Analysis, Insights and Forecast - by Geographical Scope
- 10.3.1. Domestic
- 10.3.2. Cross-Border
- 10.4. Market Analysis, Insights and Forecast - by End User Industry
- 10.4.1. BFSI
- 10.4.2. Information Technology & Telecom
- 10.4.3. Manufacturing
- 10.4.4. Healthcare & Pharmaceuticals
- 10.4.5. Retail & E-commerce
- 10.4.6. Energy & Utilities
- 10.4.7. Automotive
- 10.4.8. Consumer Goods
- 10.4.9. Others
- 10.1. Market Analysis, Insights and Forecast - by Service Type
- 11. Asia Pacific Transfer Pricing Tax Service Analysis, Insights and Forecast, 2020-2032
- 11.1. Market Analysis, Insights and Forecast - by Service Type
- 11.1.1. Advisory & Value Chain Optimisation
- 11.1.2. Compliance & Documentation
- 11.1.3. Implementation & Compliance Management
- 11.1.4. Controversy & Dispute Resolution
- 11.1.5. Others
- 11.2. Market Analysis, Insights and Forecast - by Enterprise Size
- 11.2.1. Large Enterprises
- 11.2.2. Small & Medium Enterprises (SMEs)
- 11.3. Market Analysis, Insights and Forecast - by Geographical Scope
- 11.3.1. Domestic
- 11.3.2. Cross-Border
- 11.4. Market Analysis, Insights and Forecast - by End User Industry
- 11.4.1. BFSI
- 11.4.2. Information Technology & Telecom
- 11.4.3. Manufacturing
- 11.4.4. Healthcare & Pharmaceuticals
- 11.4.5. Retail & E-commerce
- 11.4.6. Energy & Utilities
- 11.4.7. Automotive
- 11.4.8. Consumer Goods
- 11.4.9. Others
- 11.1. Market Analysis, Insights and Forecast - by Service Type
- 12. Competitive Analysis
- 12.1. Company Profiles
- 12.1.1 PwC
- 12.1.1.1. Company Overview
- 12.1.1.2. Products
- 12.1.1.3. Company Financials
- 12.1.1.4. SWOT Analysis
- 12.1.2 EY
- 12.1.2.1. Company Overview
- 12.1.2.2. Products
- 12.1.2.3. Company Financials
- 12.1.2.4. SWOT Analysis
- 12.1.3 Deloitte
- 12.1.3.1. Company Overview
- 12.1.3.2. Products
- 12.1.3.3. Company Financials
- 12.1.3.4. SWOT Analysis
- 12.1.4 KPMG
- 12.1.4.1. Company Overview
- 12.1.4.2. Products
- 12.1.4.3. Company Financials
- 12.1.4.4. SWOT Analysis
- 12.1.5 RSM International
- 12.1.5.1. Company Overview
- 12.1.5.2. Products
- 12.1.5.3. Company Financials
- 12.1.5.4. SWOT Analysis
- 12.1.6 Crowe
- 12.1.6.1. Company Overview
- 12.1.6.2. Products
- 12.1.6.3. Company Financials
- 12.1.6.4. SWOT Analysis
- 12.1.7 Grant Thornton
- 12.1.7.1. Company Overview
- 12.1.7.2. Products
- 12.1.7.3. Company Financials
- 12.1.7.4. SWOT Analysis
- 12.1.8 Cherry Bekaert
- 12.1.8.1. Company Overview
- 12.1.8.2. Products
- 12.1.8.3. Company Financials
- 12.1.8.4. SWOT Analysis
- 12.1.9 BDO
- 12.1.9.1. Company Overview
- 12.1.9.2. Products
- 12.1.9.3. Company Financials
- 12.1.9.4. SWOT Analysis
- 12.1.10 CohnReznick
- 12.1.10.1. Company Overview
- 12.1.10.2. Products
- 12.1.10.3. Company Financials
- 12.1.10.4. SWOT Analysis
- 12.1.11 CBIZ
- 12.1.11.1. Company Overview
- 12.1.11.2. Products
- 12.1.11.3. Company Financials
- 12.1.11.4. SWOT Analysis
- 12.1.12 CliftonLarsonAllen (CLA)
- 12.1.12.1. Company Overview
- 12.1.12.2. Products
- 12.1.12.3. Company Financials
- 12.1.12.4. SWOT Analysis
- 12.1.13 EisnerAmper
- 12.1.13.1. Company Overview
- 12.1.13.2. Products
- 12.1.13.3. Company Financials
- 12.1.13.4. SWOT Analysis
- 12.1.14 Moss Adams
- 12.1.14.1. Company Overview
- 12.1.14.2. Products
- 12.1.14.3. Company Financials
- 12.1.14.4. SWOT Analysis
- 12.1.15 Kroll
- 12.1.15.1. Company Overview
- 12.1.15.2. Products
- 12.1.15.3. Company Financials
- 12.1.15.4. SWOT Analysis
- 12.1.16 Tax Consultants International
- 12.1.16.1. Company Overview
- 12.1.16.2. Products
- 12.1.16.3. Company Financials
- 12.1.16.4. SWOT Analysis
- 12.1.17 Thomson Reuters
- 12.1.17.1. Company Overview
- 12.1.17.2. Products
- 12.1.17.3. Company Financials
- 12.1.17.4. SWOT Analysis
- 12.1.18 HLS Global
- 12.1.18.1. Company Overview
- 12.1.18.2. Products
- 12.1.18.3. Company Financials
- 12.1.18.4. SWOT Analysis
- 12.1.1 PwC
- 12.2. Market Entropy
- 12.2.1 Company's Key Areas Served
- 12.2.2 Recent Developments
- 12.3. Company Market Share Analysis 2025
- 12.3.1 Top 5 Companies Market Share Analysis
- 12.3.2 Top 3 Companies Market Share Analysis
- 12.4. List of Potential Customers
- 13. Research Methodology
List of Figures
- Figure 1: Global Transfer Pricing Tax Service Revenue Breakdown (billion, %) by Region 2025 & 2033
- Figure 2: North America Transfer Pricing Tax Service Revenue (billion), by Service Type 2025 & 2033
- Figure 3: North America Transfer Pricing Tax Service Revenue Share (%), by Service Type 2025 & 2033
- Figure 4: North America Transfer Pricing Tax Service Revenue (billion), by Enterprise Size 2025 & 2033
- Figure 5: North America Transfer Pricing Tax Service Revenue Share (%), by Enterprise Size 2025 & 2033
- Figure 6: North America Transfer Pricing Tax Service Revenue (billion), by Geographical Scope 2025 & 2033
- Figure 7: North America Transfer Pricing Tax Service Revenue Share (%), by Geographical Scope 2025 & 2033
- Figure 8: North America Transfer Pricing Tax Service Revenue (billion), by End User Industry 2025 & 2033
- Figure 9: North America Transfer Pricing Tax Service Revenue Share (%), by End User Industry 2025 & 2033
- Figure 10: North America Transfer Pricing Tax Service Revenue (billion), by Country 2025 & 2033
- Figure 11: North America Transfer Pricing Tax Service Revenue Share (%), by Country 2025 & 2033
- Figure 12: South America Transfer Pricing Tax Service Revenue (billion), by Service Type 2025 & 2033
- Figure 13: South America Transfer Pricing Tax Service Revenue Share (%), by Service Type 2025 & 2033
- Figure 14: South America Transfer Pricing Tax Service Revenue (billion), by Enterprise Size 2025 & 2033
- Figure 15: South America Transfer Pricing Tax Service Revenue Share (%), by Enterprise Size 2025 & 2033
- Figure 16: South America Transfer Pricing Tax Service Revenue (billion), by Geographical Scope 2025 & 2033
- Figure 17: South America Transfer Pricing Tax Service Revenue Share (%), by Geographical Scope 2025 & 2033
- Figure 18: South America Transfer Pricing Tax Service Revenue (billion), by End User Industry 2025 & 2033
- Figure 19: South America Transfer Pricing Tax Service Revenue Share (%), by End User Industry 2025 & 2033
- Figure 20: South America Transfer Pricing Tax Service Revenue (billion), by Country 2025 & 2033
- Figure 21: South America Transfer Pricing Tax Service Revenue Share (%), by Country 2025 & 2033
- Figure 22: Europe Transfer Pricing Tax Service Revenue (billion), by Service Type 2025 & 2033
- Figure 23: Europe Transfer Pricing Tax Service Revenue Share (%), by Service Type 2025 & 2033
- Figure 24: Europe Transfer Pricing Tax Service Revenue (billion), by Enterprise Size 2025 & 2033
- Figure 25: Europe Transfer Pricing Tax Service Revenue Share (%), by Enterprise Size 2025 & 2033
- Figure 26: Europe Transfer Pricing Tax Service Revenue (billion), by Geographical Scope 2025 & 2033
- Figure 27: Europe Transfer Pricing Tax Service Revenue Share (%), by Geographical Scope 2025 & 2033
- Figure 28: Europe Transfer Pricing Tax Service Revenue (billion), by End User Industry 2025 & 2033
- Figure 29: Europe Transfer Pricing Tax Service Revenue Share (%), by End User Industry 2025 & 2033
- Figure 30: Europe Transfer Pricing Tax Service Revenue (billion), by Country 2025 & 2033
- Figure 31: Europe Transfer Pricing Tax Service Revenue Share (%), by Country 2025 & 2033
- Figure 32: Middle East & Africa Transfer Pricing Tax Service Revenue (billion), by Service Type 2025 & 2033
- Figure 33: Middle East & Africa Transfer Pricing Tax Service Revenue Share (%), by Service Type 2025 & 2033
- Figure 34: Middle East & Africa Transfer Pricing Tax Service Revenue (billion), by Enterprise Size 2025 & 2033
- Figure 35: Middle East & Africa Transfer Pricing Tax Service Revenue Share (%), by Enterprise Size 2025 & 2033
- Figure 36: Middle East & Africa Transfer Pricing Tax Service Revenue (billion), by Geographical Scope 2025 & 2033
- Figure 37: Middle East & Africa Transfer Pricing Tax Service Revenue Share (%), by Geographical Scope 2025 & 2033
- Figure 38: Middle East & Africa Transfer Pricing Tax Service Revenue (billion), by End User Industry 2025 & 2033
- Figure 39: Middle East & Africa Transfer Pricing Tax Service Revenue Share (%), by End User Industry 2025 & 2033
- Figure 40: Middle East & Africa Transfer Pricing Tax Service Revenue (billion), by Country 2025 & 2033
- Figure 41: Middle East & Africa Transfer Pricing Tax Service Revenue Share (%), by Country 2025 & 2033
- Figure 42: Asia Pacific Transfer Pricing Tax Service Revenue (billion), by Service Type 2025 & 2033
- Figure 43: Asia Pacific Transfer Pricing Tax Service Revenue Share (%), by Service Type 2025 & 2033
- Figure 44: Asia Pacific Transfer Pricing Tax Service Revenue (billion), by Enterprise Size 2025 & 2033
- Figure 45: Asia Pacific Transfer Pricing Tax Service Revenue Share (%), by Enterprise Size 2025 & 2033
- Figure 46: Asia Pacific Transfer Pricing Tax Service Revenue (billion), by Geographical Scope 2025 & 2033
- Figure 47: Asia Pacific Transfer Pricing Tax Service Revenue Share (%), by Geographical Scope 2025 & 2033
- Figure 48: Asia Pacific Transfer Pricing Tax Service Revenue (billion), by End User Industry 2025 & 2033
- Figure 49: Asia Pacific Transfer Pricing Tax Service Revenue Share (%), by End User Industry 2025 & 2033
- Figure 50: Asia Pacific Transfer Pricing Tax Service Revenue (billion), by Country 2025 & 2033
- Figure 51: Asia Pacific Transfer Pricing Tax Service Revenue Share (%), by Country 2025 & 2033
List of Tables
- Table 1: Global Transfer Pricing Tax Service Revenue billion Forecast, by Service Type 2020 & 2033
- Table 2: Global Transfer Pricing Tax Service Revenue billion Forecast, by Enterprise Size 2020 & 2033
- Table 3: Global Transfer Pricing Tax Service Revenue billion Forecast, by Geographical Scope 2020 & 2033
- Table 4: Global Transfer Pricing Tax Service Revenue billion Forecast, by End User Industry 2020 & 2033
- Table 5: Global Transfer Pricing Tax Service Revenue billion Forecast, by Region 2020 & 2033
- Table 6: Global Transfer Pricing Tax Service Revenue billion Forecast, by Service Type 2020 & 2033
- Table 7: Global Transfer Pricing Tax Service Revenue billion Forecast, by Enterprise Size 2020 & 2033
- Table 8: Global Transfer Pricing Tax Service Revenue billion Forecast, by Geographical Scope 2020 & 2033
- Table 9: Global Transfer Pricing Tax Service Revenue billion Forecast, by End User Industry 2020 & 2033
- Table 10: Global Transfer Pricing Tax Service Revenue billion Forecast, by Country 2020 & 2033
- Table 11: United States Transfer Pricing Tax Service Revenue (billion) Forecast, by Application 2020 & 2033
- Table 12: Canada Transfer Pricing Tax Service Revenue (billion) Forecast, by Application 2020 & 2033
- Table 13: Mexico Transfer Pricing Tax Service Revenue (billion) Forecast, by Application 2020 & 2033
- Table 14: Global Transfer Pricing Tax Service Revenue billion Forecast, by Service Type 2020 & 2033
- Table 15: Global Transfer Pricing Tax Service Revenue billion Forecast, by Enterprise Size 2020 & 2033
- Table 16: Global Transfer Pricing Tax Service Revenue billion Forecast, by Geographical Scope 2020 & 2033
- Table 17: Global Transfer Pricing Tax Service Revenue billion Forecast, by End User Industry 2020 & 2033
- Table 18: Global Transfer Pricing Tax Service Revenue billion Forecast, by Country 2020 & 2033
- Table 19: Brazil Transfer Pricing Tax Service Revenue (billion) Forecast, by Application 2020 & 2033
- Table 20: Argentina Transfer Pricing Tax Service Revenue (billion) Forecast, by Application 2020 & 2033
- Table 21: Rest of South America Transfer Pricing Tax Service Revenue (billion) Forecast, by Application 2020 & 2033
- Table 22: Global Transfer Pricing Tax Service Revenue billion Forecast, by Service Type 2020 & 2033
- Table 23: Global Transfer Pricing Tax Service Revenue billion Forecast, by Enterprise Size 2020 & 2033
- Table 24: Global Transfer Pricing Tax Service Revenue billion Forecast, by Geographical Scope 2020 & 2033
- Table 25: Global Transfer Pricing Tax Service Revenue billion Forecast, by End User Industry 2020 & 2033
- Table 26: Global Transfer Pricing Tax Service Revenue billion Forecast, by Country 2020 & 2033
- Table 27: United Kingdom Transfer Pricing Tax Service Revenue (billion) Forecast, by Application 2020 & 2033
- Table 28: Germany Transfer Pricing Tax Service Revenue (billion) Forecast, by Application 2020 & 2033
- Table 29: France Transfer Pricing Tax Service Revenue (billion) Forecast, by Application 2020 & 2033
- Table 30: Italy Transfer Pricing Tax Service Revenue (billion) Forecast, by Application 2020 & 2033
- Table 31: Spain Transfer Pricing Tax Service Revenue (billion) Forecast, by Application 2020 & 2033
- Table 32: Russia Transfer Pricing Tax Service Revenue (billion) Forecast, by Application 2020 & 2033
- Table 33: Benelux Transfer Pricing Tax Service Revenue (billion) Forecast, by Application 2020 & 2033
- Table 34: Nordics Transfer Pricing Tax Service Revenue (billion) Forecast, by Application 2020 & 2033
- Table 35: Rest of Europe Transfer Pricing Tax Service Revenue (billion) Forecast, by Application 2020 & 2033
- Table 36: Global Transfer Pricing Tax Service Revenue billion Forecast, by Service Type 2020 & 2033
- Table 37: Global Transfer Pricing Tax Service Revenue billion Forecast, by Enterprise Size 2020 & 2033
- Table 38: Global Transfer Pricing Tax Service Revenue billion Forecast, by Geographical Scope 2020 & 2033
- Table 39: Global Transfer Pricing Tax Service Revenue billion Forecast, by End User Industry 2020 & 2033
- Table 40: Global Transfer Pricing Tax Service Revenue billion Forecast, by Country 2020 & 2033
- Table 41: Turkey Transfer Pricing Tax Service Revenue (billion) Forecast, by Application 2020 & 2033
- Table 42: Israel Transfer Pricing Tax Service Revenue (billion) Forecast, by Application 2020 & 2033
- Table 43: GCC Transfer Pricing Tax Service Revenue (billion) Forecast, by Application 2020 & 2033
- Table 44: North Africa Transfer Pricing Tax Service Revenue (billion) Forecast, by Application 2020 & 2033
- Table 45: South Africa Transfer Pricing Tax Service Revenue (billion) Forecast, by Application 2020 & 2033
- Table 46: Rest of Middle East & Africa Transfer Pricing Tax Service Revenue (billion) Forecast, by Application 2020 & 2033
- Table 47: Global Transfer Pricing Tax Service Revenue billion Forecast, by Service Type 2020 & 2033
- Table 48: Global Transfer Pricing Tax Service Revenue billion Forecast, by Enterprise Size 2020 & 2033
- Table 49: Global Transfer Pricing Tax Service Revenue billion Forecast, by Geographical Scope 2020 & 2033
- Table 50: Global Transfer Pricing Tax Service Revenue billion Forecast, by End User Industry 2020 & 2033
- Table 51: Global Transfer Pricing Tax Service Revenue billion Forecast, by Country 2020 & 2033
- Table 52: China Transfer Pricing Tax Service Revenue (billion) Forecast, by Application 2020 & 2033
- Table 53: India Transfer Pricing Tax Service Revenue (billion) Forecast, by Application 2020 & 2033
- Table 54: Japan Transfer Pricing Tax Service Revenue (billion) Forecast, by Application 2020 & 2033
- Table 55: South Korea Transfer Pricing Tax Service Revenue (billion) Forecast, by Application 2020 & 2033
- Table 56: ASEAN Transfer Pricing Tax Service Revenue (billion) Forecast, by Application 2020 & 2033
- Table 57: Oceania Transfer Pricing Tax Service Revenue (billion) Forecast, by Application 2020 & 2033
- Table 58: Rest of Asia Pacific Transfer Pricing Tax Service Revenue (billion) Forecast, by Application 2020 & 2033
Frequently Asked Questions
1. What is the projected Compound Annual Growth Rate (CAGR) of the Transfer Pricing Tax Service?
The projected CAGR is approximately 6.52%.
2. Which companies are prominent players in the Transfer Pricing Tax Service?
Key companies in the market include PwC, EY, Deloitte, KPMG, RSM International, Crowe, Grant Thornton, Cherry Bekaert, BDO, CohnReznick, CBIZ, CliftonLarsonAllen (CLA), EisnerAmper, Moss Adams, Kroll, Tax Consultants International, Thomson Reuters, HLS Global.
3. What are the main segments of the Transfer Pricing Tax Service?
The market segments include Service Type, Enterprise Size, Geographical Scope, End User Industry.
4. Can you provide details about the market size?
The market size is estimated to be USD 36.17 billion as of 2022.
5. What are some drivers contributing to market growth?
N/A
6. What are the notable trends driving market growth?
N/A
7. Are there any restraints impacting market growth?
N/A
8. Can you provide examples of recent developments in the market?
N/A
9. What pricing options are available for accessing the report?
Pricing options include single-user, multi-user, and enterprise licenses priced at USD 2900.00, USD 4350.00, and USD 5800.00 respectively.
10. Is the market size provided in terms of value or volume?
The market size is provided in terms of value, measured in billion.
11. Are there any specific market keywords associated with the report?
Yes, the market keyword associated with the report is "Transfer Pricing Tax Service," which aids in identifying and referencing the specific market segment covered.
12. How do I determine which pricing option suits my needs best?
The pricing options vary based on user requirements and access needs. Individual users may opt for single-user licenses, while businesses requiring broader access may choose multi-user or enterprise licenses for cost-effective access to the report.
13. Are there any additional resources or data provided in the Transfer Pricing Tax Service report?
While the report offers comprehensive insights, it's advisable to review the specific contents or supplementary materials provided to ascertain if additional resources or data are available.
14. How can I stay updated on further developments or reports in the Transfer Pricing Tax Service?
To stay informed about further developments, trends, and reports in the Transfer Pricing Tax Service, consider subscribing to industry newsletters, following relevant companies and organizations, or regularly checking reputable industry news sources and publications.
Methodology
Step 1 - Identification of Relevant Samples Size from Population Database


Step 2 - Approaches for Defining Global Market Size (Value, Volume* & Price*)

Note*: In applicable scenarios
Step 3 - Data Sources
Primary Research
- Web Analytics
- Survey Reports
- Research Institute
- Latest Research Reports
- Opinion Leaders
Secondary Research
- Annual Reports
- White Paper
- Latest Press Release
- Industry Association
- Paid Database
- Investor Presentations

Step 4 - Data Triangulation
Involves using different sources of information in order to increase the validity of a study
These sources are likely to be stakeholders in a program - participants, other researchers, program staff, other community members, and so on.
Then we put all data in single framework & apply various statistical tools to find out the dynamic on the market.
During the analysis stage, feedback from the stakeholder groups would be compared to determine areas of agreement as well as areas of divergence