

Key Insights
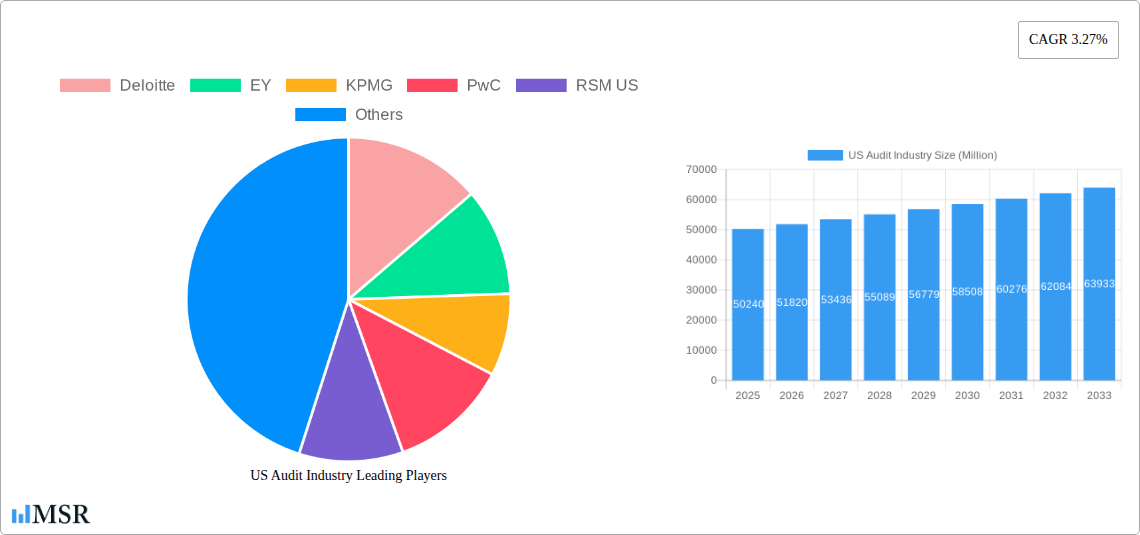
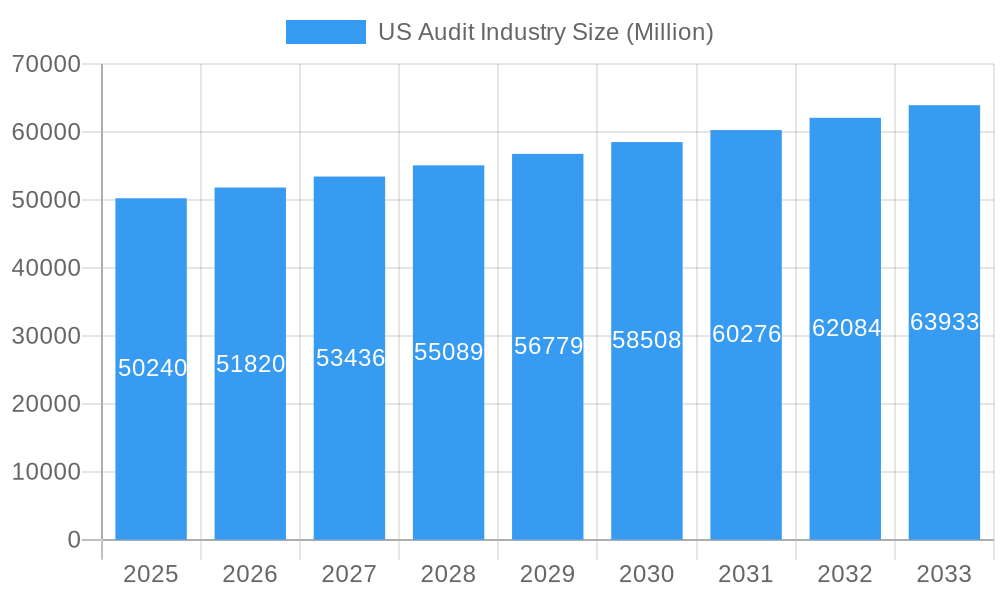
The US audit industry, a cornerstone of financial transparency and regulatory compliance, is a multi-billion dollar market projected to experience steady growth. With a 2025 market size of $50.24 billion and a Compound Annual Growth Rate (CAGR) of 3.27% from 2025 to 2033, the sector shows sustained, albeit moderate, expansion. This growth is fueled by several key factors. Increasing regulatory scrutiny across various sectors, particularly in the wake of high-profile financial scandals, necessitates robust auditing practices. The expanding complexity of financial reporting standards and the rise of data-driven auditing techniques also drive demand for specialized audit services. Furthermore, the ongoing digital transformation across businesses is leading to the adoption of advanced analytics and automation tools within the audit process, enhancing efficiency and effectiveness. Major players such as Deloitte, EY, KPMG, PwC, and other national and regional firms compete for market share, offering diverse service packages tailored to specific client needs.
US Audit Industry Market Size (In Billion)
However, the industry faces challenges. The increasing cost of compliance with evolving regulations puts pressure on both audit firms and their clients. Competition among firms, particularly from smaller, specialized players, intensifies the need for continuous innovation and the development of niche expertise. Furthermore, the evolving threat landscape, including cybersecurity concerns and data breaches, adds another layer of complexity to the audit process, demanding significant investments in technology and expertise. While the market exhibits healthy growth projections, strategic adaptation to these challenges is crucial for firms to maintain profitability and market position in the long term. The increasing demand for environmental, social, and governance (ESG) audits also represents a significant emerging opportunity for growth within the sector.
US Audit Industry Company Market Share
US Audit Industry Market Report: 2019-2033 Forecast
This comprehensive report provides a detailed analysis of the US Audit Industry, covering market size, growth drivers, competitive landscape, and future outlook. With a study period spanning 2019-2033 (base year 2025, forecast period 2025-2033), this report is an invaluable resource for industry stakeholders, investors, and strategic planners. The report leverages a wealth of data to offer actionable insights into the $XX Million market, including significant developments and technological disruptions.
US Audit Industry Market Concentration & Dynamics
The US audit industry is characterized by high market concentration, with the "Big Four" firms – Deloitte, EY, KPMG, and PwC – commanding a significant majority of the market share. Their combined market share is estimated at approximately 70% in 2025. Smaller firms like RSM US, Grant Thornton LLP, BDO USA, CBIZ, Mayer Hoffman McCann, and Crowe Horwath, along with numerous niche players, compete for the remaining share.
The industry is marked by a robust innovation ecosystem, driven by technological advancements and the increasing demand for sophisticated audit solutions. Regulatory frameworks, such as those set by the Public Company Accounting Oversight Board (PCAOB), significantly influence industry practices. Substitute products, such as automated auditing tools and specialized software, are emerging, presenting both opportunities and challenges for traditional audit firms. End-user trends, particularly the growing adoption of cloud-based technologies and data analytics, are shaping the demand for audit services. Furthermore, M&A activity remains a significant factor, with an estimated xx number of deals recorded between 2019 and 2024, primarily involving smaller firms seeking to expand their capabilities or geographical reach.
- Market Share (2025 Estimate): Big Four (70%), Others (30%)
- M&A Deal Count (2019-2024): xx
- Key Trends: Technological disruption, regulatory changes, consolidation through M&A.
US Audit Industry Industry Insights & Trends
The US audit industry is currently experiencing a period of dynamic growth, propelled by a confluence of factors including heightened regulatory oversight, the ever-increasing intricacy of financial reporting frameworks, and a surging demand for comprehensive assurance services across a diverse spectrum of industries. While specific market size figures and CAGR require granular data, the trajectory indicates a robust expansion. This growth is fundamentally driven by several key catalysts: the pervasive trend of globalization necessitating complex international audits, the transformative integration of data analytics into audit methodologies, and the widespread adoption of agile cloud-based technologies. The escalating complexity of financial reporting standards and regulatory mandates continually fuels the demand for specialized audit expertise, acting as a significant propellant for the industry's advancement. Moreover, a heightened global consciousness regarding corporate governance principles and proactive risk management strategies further amplifies the imperative for reliable, transparent, and insightful audit services. Technological innovations are not merely influencing but are actively reshaping the audit landscape. The strategic implementation of Artificial Intelligence (AI) and Machine Learning (ML) is demonstrably enhancing both the efficiency and accuracy of audit procedures. Concurrently, shifts in business consumer behavior, increasingly prioritizing robust risk management and operational transparency, are directly contributing to the expanding market and the evolution of audit services.
Key Markets & Segments Leading US Audit Industry
While the US audit market is geographically widespread, certain segments demonstrate higher growth potential and dominance. The financial services sector, with its complex regulatory environment and high-value transactions, consistently accounts for a large portion of audit revenue. Similarly, the technology and healthcare sectors, both characterized by rapid innovation and evolving regulatory landscapes, present significant opportunities for audit firms.
- Dominant Segments: Financial Services, Technology, Healthcare
- Growth Drivers: Stringent regulatory compliance, technological advancements, increasing complexity of business operations.
The dominance of these segments stems from their need for specialized audit expertise and the higher perceived risk associated with their operations, leading to increased demand for audit services. Further, strong economic growth and significant infrastructure investments in these sectors drive the need for robust financial reporting and auditing practices.
US Audit Industry Product Developments
Recent groundbreaking advancements in audit technology, particularly the seamless integration of Artificial Intelligence (AI) and Machine Learning (ML), are ushering in a new era for the audit industry. The development of sophisticated automated audit tools and cutting-edge data analytics platforms has dramatically amplified efficiency, precision, and the overall velocity of the audit process. These transformative innovations are not only providing audit firms with significant competitive advantages but are also empowering them to adeptly manage and analyze vast datasets, thereby delivering more profound and actionable insights to their clients. The escalating focus on robust cybersecurity measures and stringent data privacy regulations is also a significant impetus for the development of highly specialized audit services tailored to address these critical areas. Furthermore, the emergence of generative AI is poised to revolutionize numerous audit processes, facilitating the automation of intricate tasks and heralding the potential for substantial cost reductions and a marked improvement in audit accuracy and reliability.
Challenges in the US Audit Industry Market
The US audit industry faces several key challenges, including increasing regulatory scrutiny, the rising costs of compliance, and fierce competition, especially among smaller firms. Supply chain disruptions can indirectly impact the availability of skilled professionals, potentially affecting service delivery and capacity. The industry also experiences intense competitive pressure, with established firms constantly striving to maintain their market share against emerging competitors and technological advancements. These factors place pressure on profit margins and require continuous innovation to stay competitive. Quantifying these impacts precisely is difficult, but anecdotal evidence suggests reduced profitability and increased pressure on staffing levels within smaller and medium sized firms.
Forces Driving US Audit Industry Growth
A multifaceted interplay of forces is propelling the sustained growth of the US audit industry. Foremost among these is the escalating complexity and ever-evolving nature of financial regulations and reporting standards, which inherently necessitate the engagement of specialized and highly skilled audit expertise. Concurrently, rapid technological advancements, particularly the integration of Artificial Intelligence (AI) and Machine Learning (ML), are demonstrably augmenting the efficiency and accuracy of audit processes, consequently driving increased demand for these enhanced services. The increasing globalization of businesses and the proliferation of intricate cross-border transactions demand sophisticated audit services capable of ensuring rigorous compliance with the diverse regulatory frameworks of multiple jurisdictions. Finally, the pervasive emphasis on strong corporate governance and effective risk management across all business sectors creates a foundational and growing demand for the highest quality of assurance services, underpinning the industry's expansion.
Long-Term Growth Catalysts in the US Audit Industry
Long-term growth in the US audit industry will be fueled by strategic partnerships and market expansions, particularly into new and emerging markets. Innovation in audit technology, including the wider adoption of AI and blockchain technology, will remain a key driver. Furthermore, the ongoing expansion of global financial markets presents opportunities for growth through increased cross-border auditing services. The focus on data security and privacy regulation will necessitate specialized expertise and contribute to sustained growth.
Emerging Opportunities in US Audit Industry
The widespread adoption of cloud computing infrastructure and the burgeoning utilization of big data analytics present a fertile ground of significant opportunities for forward-thinking audit firms. The development and offering of specialized audit services focused on the critical domains of cybersecurity and data privacy represent another rapidly expanding niche. Furthermore, emerging market segments, such as the rapidly growing sustainable finance sector and the increasingly vital area of Environmental, Social, and Governance (ESG) reporting, offer substantial untapped potential for strategic growth and market penetration. The expansion into nascent markets that may possess less developed audit infrastructures also represents valuable diversification and growth avenues for established firms.
Key Milestones in US Audit Industry Industry
- May 2023: Deloitte and Google Cloud have significantly strengthened their strategic alliance, with a pronounced focus on the seamless integration of advanced generative AI capabilities into their audit service offerings. This collaboration is designed to substantially enhance audit efficiency and the depth of analytical insights.
- May 2023: EY has unveiled an impressive portfolio of over 20 new assurance technology capabilities following a pivotal partnership with Microsoft. This strategic move, backed by an investment exceeding USD 1 Billion, signifies a commitment to a next-generation assurance technology platform, poised to markedly improve audit speed and accuracy.
Strategic Outlook for US Audit Industry Market
The US audit industry is poised for continued growth, driven by technological advancements, evolving regulatory landscapes, and the increasing complexity of business operations. Strategic partnerships, expansion into new markets, and the development of innovative audit solutions will be crucial for success. Firms that successfully adapt to the changing technological and regulatory environment, particularly embracing AI and data analytics, will be best positioned to capture future market opportunities. The long-term potential for growth remains substantial, with the industry expected to continue its expansion throughout the forecast period.
US Audit Industry Segmentation
-
1. Type
- 1.1. Internal Audit
- 1.2. External Audit
-
2. Service line
- 2.1. Operational Audits
- 2.2. Financial Audits
- 2.3. Advisory and Consulting
- 2.4. Investigation Audit
- 2.5. Information System Audit
- 2.6. Compliance Audit
- 2.7. Other
US Audit Industry Segmentation By Geography
-
1. North America
- 1.1. United States
- 1.2. Canada
- 1.3. Mexico
-
2. South America
- 2.1. Brazil
- 2.2. Argentina
- 2.3. Rest of South America
-
3. Europe
- 3.1. United Kingdom
- 3.2. Germany
- 3.3. France
- 3.4. Italy
- 3.5. Spain
- 3.6. Russia
- 3.7. Benelux
- 3.8. Nordics
- 3.9. Rest of Europe
-
4. Middle East & Africa
- 4.1. Turkey
- 4.2. Israel
- 4.3. GCC
- 4.4. North Africa
- 4.5. South Africa
- 4.6. Rest of Middle East & Africa
-
5. Asia Pacific
- 5.1. China
- 5.2. India
- 5.3. Japan
- 5.4. South Korea
- 5.5. ASEAN
- 5.6. Oceania
- 5.7. Rest of Asia Pacific
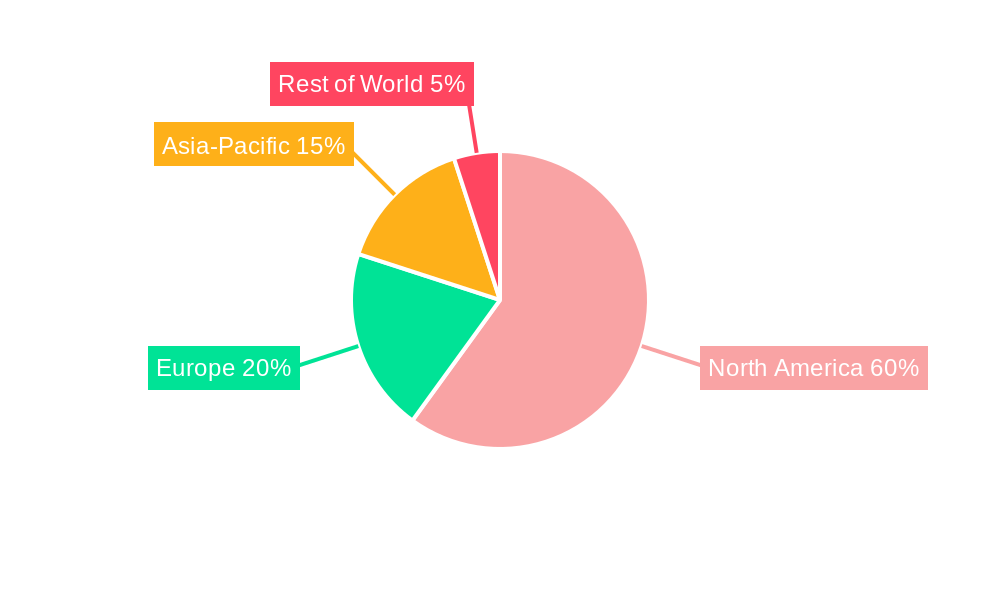
US Audit Industry Regional Market Share
Geographic Coverage of US Audit Industry
US Audit Industry REPORT HIGHLIGHTS
| Aspects | Details |
|---|---|
| Study Period | 2020-2034 |
| Base Year | 2025 |
| Estimated Year | 2026 |
| Forecast Period | 2026-2034 |
| Historical Period | 2020-2025 |
| Growth Rate | CAGR of 3.27% from 2020-2034 |
| Segmentation |
|
Table of Contents
- 1. Introduction
- 1.1. Research Scope
- 1.2. Market Segmentation
- 1.3. Research Objective
- 1.4. Definitions and Assumptions
- 2. Executive Summary
- 2.1. Market Snapshot
- 3. Market Dynamics
- 3.1. Market Drivers
- 3.2. Market Restrains
- 3.3. Market Trends
- 3.4. Market Opportunities
- 4. Market Factor Analysis
- 4.1. Porters Five Forces
- 4.1.1. Bargaining Power of Suppliers
- 4.1.2. Bargaining Power of Buyers
- 4.1.3. Threat of New Entrants
- 4.1.4. Threat of Substitutes
- 4.1.5. Competitive Rivalry
- 4.2. PESTEL analysis
- 4.3. BCG Analysis
- 4.3.1. Stars (High Growth, High Market Share)
- 4.3.2. Cash Cows (Low Growth, High Market Share)
- 4.3.3. Question Mark (High Growth, Low Market Share)
- 4.3.4. Dogs (Low Growth, Low Market Share)
- 4.4. Ansoff Matrix Analysis
- 4.5. Supply Chain Analysis
- 4.6. Regulatory Landscape
- 4.7. Current Market Potential and Opportunity Assessment (TAM–SAM–SOM Framework)
- 4.8. MSR Analyst Note
- 4.1. Porters Five Forces
- 5. Market Analysis, Insights and Forecast 2021-2033
- 5.1. Market Analysis, Insights and Forecast - by Type
- 5.1.1. Internal Audit
- 5.1.2. External Audit
- 5.2. Market Analysis, Insights and Forecast - by Service line
- 5.2.1. Operational Audits
- 5.2.2. Financial Audits
- 5.2.3. Advisory and Consulting
- 5.2.4. Investigation Audit
- 5.2.5. Information System Audit
- 5.2.6. Compliance Audit
- 5.2.7. Other
- 5.3. Market Analysis, Insights and Forecast - by Region
- 5.3.1. North America
- 5.3.2. South America
- 5.3.3. Europe
- 5.3.4. Middle East & Africa
- 5.3.5. Asia Pacific
- 5.1. Market Analysis, Insights and Forecast - by Type
- 6. Global US Audit Industry Analysis, Insights and Forecast, 2021-2033
- 6.1. Market Analysis, Insights and Forecast - by Type
- 6.1.1. Internal Audit
- 6.1.2. External Audit
- 6.2. Market Analysis, Insights and Forecast - by Service line
- 6.2.1. Operational Audits
- 6.2.2. Financial Audits
- 6.2.3. Advisory and Consulting
- 6.2.4. Investigation Audit
- 6.2.5. Information System Audit
- 6.2.6. Compliance Audit
- 6.2.7. Other
- 6.1. Market Analysis, Insights and Forecast - by Type
- 7. North America US Audit Industry Analysis, Insights and Forecast, 2020-2032
- 7.1. Market Analysis, Insights and Forecast - by Type
- 7.1.1. Internal Audit
- 7.1.2. External Audit
- 7.2. Market Analysis, Insights and Forecast - by Service line
- 7.2.1. Operational Audits
- 7.2.2. Financial Audits
- 7.2.3. Advisory and Consulting
- 7.2.4. Investigation Audit
- 7.2.5. Information System Audit
- 7.2.6. Compliance Audit
- 7.2.7. Other
- 7.1. Market Analysis, Insights and Forecast - by Type
- 8. South America US Audit Industry Analysis, Insights and Forecast, 2020-2032
- 8.1. Market Analysis, Insights and Forecast - by Type
- 8.1.1. Internal Audit
- 8.1.2. External Audit
- 8.2. Market Analysis, Insights and Forecast - by Service line
- 8.2.1. Operational Audits
- 8.2.2. Financial Audits
- 8.2.3. Advisory and Consulting
- 8.2.4. Investigation Audit
- 8.2.5. Information System Audit
- 8.2.6. Compliance Audit
- 8.2.7. Other
- 8.1. Market Analysis, Insights and Forecast - by Type
- 9. Europe US Audit Industry Analysis, Insights and Forecast, 2020-2032
- 9.1. Market Analysis, Insights and Forecast - by Type
- 9.1.1. Internal Audit
- 9.1.2. External Audit
- 9.2. Market Analysis, Insights and Forecast - by Service line
- 9.2.1. Operational Audits
- 9.2.2. Financial Audits
- 9.2.3. Advisory and Consulting
- 9.2.4. Investigation Audit
- 9.2.5. Information System Audit
- 9.2.6. Compliance Audit
- 9.2.7. Other
- 9.1. Market Analysis, Insights and Forecast - by Type
- 10. Middle East & Africa US Audit Industry Analysis, Insights and Forecast, 2020-2032
- 10.1. Market Analysis, Insights and Forecast - by Type
- 10.1.1. Internal Audit
- 10.1.2. External Audit
- 10.2. Market Analysis, Insights and Forecast - by Service line
- 10.2.1. Operational Audits
- 10.2.2. Financial Audits
- 10.2.3. Advisory and Consulting
- 10.2.4. Investigation Audit
- 10.2.5. Information System Audit
- 10.2.6. Compliance Audit
- 10.2.7. Other
- 10.1. Market Analysis, Insights and Forecast - by Type
- 11. Asia Pacific US Audit Industry Analysis, Insights and Forecast, 2020-2032
- 11.1. Market Analysis, Insights and Forecast - by Type
- 11.1.1. Internal Audit
- 11.1.2. External Audit
- 11.2. Market Analysis, Insights and Forecast - by Service line
- 11.2.1. Operational Audits
- 11.2.2. Financial Audits
- 11.2.3. Advisory and Consulting
- 11.2.4. Investigation Audit
- 11.2.5. Information System Audit
- 11.2.6. Compliance Audit
- 11.2.7. Other
- 11.1. Market Analysis, Insights and Forecast - by Type
- 12. Competitive Analysis
- 12.1. Company Profiles
- 12.1.1 Deloitte
- 12.1.1.1. Company Overview
- 12.1.1.2. Products
- 12.1.1.3. Company Financials
- 12.1.1.4. SWOT Analysis
- 12.1.2 EY
- 12.1.2.1. Company Overview
- 12.1.2.2. Products
- 12.1.2.3. Company Financials
- 12.1.2.4. SWOT Analysis
- 12.1.3 KPMG
- 12.1.3.1. Company Overview
- 12.1.3.2. Products
- 12.1.3.3. Company Financials
- 12.1.3.4. SWOT Analysis
- 12.1.4 PwC
- 12.1.4.1. Company Overview
- 12.1.4.2. Products
- 12.1.4.3. Company Financials
- 12.1.4.4. SWOT Analysis
- 12.1.5 RSM US
- 12.1.5.1. Company Overview
- 12.1.5.2. Products
- 12.1.5.3. Company Financials
- 12.1.5.4. SWOT Analysis
- 12.1.6 Grant Thornton LLP
- 12.1.6.1. Company Overview
- 12.1.6.2. Products
- 12.1.6.3. Company Financials
- 12.1.6.4. SWOT Analysis
- 12.1.7 A T Kearney
- 12.1.7.1. Company Overview
- 12.1.7.2. Products
- 12.1.7.3. Company Financials
- 12.1.7.4. SWOT Analysis
- 12.1.8 BDO USA
- 12.1.8.1. Company Overview
- 12.1.8.2. Products
- 12.1.8.3. Company Financials
- 12.1.8.4. SWOT Analysis
- 12.1.9 CBIZ & Mayer Hoffman McCann
- 12.1.9.1. Company Overview
- 12.1.9.2. Products
- 12.1.9.3. Company Financials
- 12.1.9.4. SWOT Analysis
- 12.1.10 Crowe Horwath**List Not Exhaustive
- 12.1.10.1. Company Overview
- 12.1.10.2. Products
- 12.1.10.3. Company Financials
- 12.1.10.4. SWOT Analysis
- 12.1.1 Deloitte
- 12.2. Market Entropy
- 12.2.1 Company's Key Areas Served
- 12.2.2 Recent Developments
- 12.3. Company Market Share Analysis 2025
- 12.3.1 Top 5 Companies Market Share Analysis
- 12.3.2 Top 3 Companies Market Share Analysis
- 12.4. List of Potential Customers
- 13. Research Methodology
List of Figures
- Figure 1: Global US Audit Industry Revenue Breakdown (Million, %) by Region 2025 & 2033
- Figure 2: Global US Audit Industry Volume Breakdown (Billion, %) by Region 2025 & 2033
- Figure 3: North America US Audit Industry Revenue (Million), by Type 2025 & 2033
- Figure 4: North America US Audit Industry Volume (Billion), by Type 2025 & 2033
- Figure 5: North America US Audit Industry Revenue Share (%), by Type 2025 & 2033
- Figure 6: North America US Audit Industry Volume Share (%), by Type 2025 & 2033
- Figure 7: North America US Audit Industry Revenue (Million), by Service line 2025 & 2033
- Figure 8: North America US Audit Industry Volume (Billion), by Service line 2025 & 2033
- Figure 9: North America US Audit Industry Revenue Share (%), by Service line 2025 & 2033
- Figure 10: North America US Audit Industry Volume Share (%), by Service line 2025 & 2033
- Figure 11: North America US Audit Industry Revenue (Million), by Country 2025 & 2033
- Figure 12: North America US Audit Industry Volume (Billion), by Country 2025 & 2033
- Figure 13: North America US Audit Industry Revenue Share (%), by Country 2025 & 2033
- Figure 14: North America US Audit Industry Volume Share (%), by Country 2025 & 2033
- Figure 15: South America US Audit Industry Revenue (Million), by Type 2025 & 2033
- Figure 16: South America US Audit Industry Volume (Billion), by Type 2025 & 2033
- Figure 17: South America US Audit Industry Revenue Share (%), by Type 2025 & 2033
- Figure 18: South America US Audit Industry Volume Share (%), by Type 2025 & 2033
- Figure 19: South America US Audit Industry Revenue (Million), by Service line 2025 & 2033
- Figure 20: South America US Audit Industry Volume (Billion), by Service line 2025 & 2033
- Figure 21: South America US Audit Industry Revenue Share (%), by Service line 2025 & 2033
- Figure 22: South America US Audit Industry Volume Share (%), by Service line 2025 & 2033
- Figure 23: South America US Audit Industry Revenue (Million), by Country 2025 & 2033
- Figure 24: South America US Audit Industry Volume (Billion), by Country 2025 & 2033
- Figure 25: South America US Audit Industry Revenue Share (%), by Country 2025 & 2033
- Figure 26: South America US Audit Industry Volume Share (%), by Country 2025 & 2033
- Figure 27: Europe US Audit Industry Revenue (Million), by Type 2025 & 2033
- Figure 28: Europe US Audit Industry Volume (Billion), by Type 2025 & 2033
- Figure 29: Europe US Audit Industry Revenue Share (%), by Type 2025 & 2033
- Figure 30: Europe US Audit Industry Volume Share (%), by Type 2025 & 2033
- Figure 31: Europe US Audit Industry Revenue (Million), by Service line 2025 & 2033
- Figure 32: Europe US Audit Industry Volume (Billion), by Service line 2025 & 2033
- Figure 33: Europe US Audit Industry Revenue Share (%), by Service line 2025 & 2033
- Figure 34: Europe US Audit Industry Volume Share (%), by Service line 2025 & 2033
- Figure 35: Europe US Audit Industry Revenue (Million), by Country 2025 & 2033
- Figure 36: Europe US Audit Industry Volume (Billion), by Country 2025 & 2033
- Figure 37: Europe US Audit Industry Revenue Share (%), by Country 2025 & 2033
- Figure 38: Europe US Audit Industry Volume Share (%), by Country 2025 & 2033
- Figure 39: Middle East & Africa US Audit Industry Revenue (Million), by Type 2025 & 2033
- Figure 40: Middle East & Africa US Audit Industry Volume (Billion), by Type 2025 & 2033
- Figure 41: Middle East & Africa US Audit Industry Revenue Share (%), by Type 2025 & 2033
- Figure 42: Middle East & Africa US Audit Industry Volume Share (%), by Type 2025 & 2033
- Figure 43: Middle East & Africa US Audit Industry Revenue (Million), by Service line 2025 & 2033
- Figure 44: Middle East & Africa US Audit Industry Volume (Billion), by Service line 2025 & 2033
- Figure 45: Middle East & Africa US Audit Industry Revenue Share (%), by Service line 2025 & 2033
- Figure 46: Middle East & Africa US Audit Industry Volume Share (%), by Service line 2025 & 2033
- Figure 47: Middle East & Africa US Audit Industry Revenue (Million), by Country 2025 & 2033
- Figure 48: Middle East & Africa US Audit Industry Volume (Billion), by Country 2025 & 2033
- Figure 49: Middle East & Africa US Audit Industry Revenue Share (%), by Country 2025 & 2033
- Figure 50: Middle East & Africa US Audit Industry Volume Share (%), by Country 2025 & 2033
- Figure 51: Asia Pacific US Audit Industry Revenue (Million), by Type 2025 & 2033
- Figure 52: Asia Pacific US Audit Industry Volume (Billion), by Type 2025 & 2033
- Figure 53: Asia Pacific US Audit Industry Revenue Share (%), by Type 2025 & 2033
- Figure 54: Asia Pacific US Audit Industry Volume Share (%), by Type 2025 & 2033
- Figure 55: Asia Pacific US Audit Industry Revenue (Million), by Service line 2025 & 2033
- Figure 56: Asia Pacific US Audit Industry Volume (Billion), by Service line 2025 & 2033
- Figure 57: Asia Pacific US Audit Industry Revenue Share (%), by Service line 2025 & 2033
- Figure 58: Asia Pacific US Audit Industry Volume Share (%), by Service line 2025 & 2033
- Figure 59: Asia Pacific US Audit Industry Revenue (Million), by Country 2025 & 2033
- Figure 60: Asia Pacific US Audit Industry Volume (Billion), by Country 2025 & 2033
- Figure 61: Asia Pacific US Audit Industry Revenue Share (%), by Country 2025 & 2033
- Figure 62: Asia Pacific US Audit Industry Volume Share (%), by Country 2025 & 2033
List of Tables
- Table 1: Global US Audit Industry Revenue Million Forecast, by Type 2020 & 2033
- Table 2: Global US Audit Industry Volume Billion Forecast, by Type 2020 & 2033
- Table 3: Global US Audit Industry Revenue Million Forecast, by Service line 2020 & 2033
- Table 4: Global US Audit Industry Volume Billion Forecast, by Service line 2020 & 2033
- Table 5: Global US Audit Industry Revenue Million Forecast, by Region 2020 & 2033
- Table 6: Global US Audit Industry Volume Billion Forecast, by Region 2020 & 2033
- Table 7: Global US Audit Industry Revenue Million Forecast, by Type 2020 & 2033
- Table 8: Global US Audit Industry Volume Billion Forecast, by Type 2020 & 2033
- Table 9: Global US Audit Industry Revenue Million Forecast, by Service line 2020 & 2033
- Table 10: Global US Audit Industry Volume Billion Forecast, by Service line 2020 & 2033
- Table 11: Global US Audit Industry Revenue Million Forecast, by Country 2020 & 2033
- Table 12: Global US Audit Industry Volume Billion Forecast, by Country 2020 & 2033
- Table 13: United States US Audit Industry Revenue (Million) Forecast, by Application 2020 & 2033
- Table 14: United States US Audit Industry Volume (Billion) Forecast, by Application 2020 & 2033
- Table 15: Canada US Audit Industry Revenue (Million) Forecast, by Application 2020 & 2033
- Table 16: Canada US Audit Industry Volume (Billion) Forecast, by Application 2020 & 2033
- Table 17: Mexico US Audit Industry Revenue (Million) Forecast, by Application 2020 & 2033
- Table 18: Mexico US Audit Industry Volume (Billion) Forecast, by Application 2020 & 2033
- Table 19: Global US Audit Industry Revenue Million Forecast, by Type 2020 & 2033
- Table 20: Global US Audit Industry Volume Billion Forecast, by Type 2020 & 2033
- Table 21: Global US Audit Industry Revenue Million Forecast, by Service line 2020 & 2033
- Table 22: Global US Audit Industry Volume Billion Forecast, by Service line 2020 & 2033
- Table 23: Global US Audit Industry Revenue Million Forecast, by Country 2020 & 2033
- Table 24: Global US Audit Industry Volume Billion Forecast, by Country 2020 & 2033
- Table 25: Brazil US Audit Industry Revenue (Million) Forecast, by Application 2020 & 2033
- Table 26: Brazil US Audit Industry Volume (Billion) Forecast, by Application 2020 & 2033
- Table 27: Argentina US Audit Industry Revenue (Million) Forecast, by Application 2020 & 2033
- Table 28: Argentina US Audit Industry Volume (Billion) Forecast, by Application 2020 & 2033
- Table 29: Rest of South America US Audit Industry Revenue (Million) Forecast, by Application 2020 & 2033
- Table 30: Rest of South America US Audit Industry Volume (Billion) Forecast, by Application 2020 & 2033
- Table 31: Global US Audit Industry Revenue Million Forecast, by Type 2020 & 2033
- Table 32: Global US Audit Industry Volume Billion Forecast, by Type 2020 & 2033
- Table 33: Global US Audit Industry Revenue Million Forecast, by Service line 2020 & 2033
- Table 34: Global US Audit Industry Volume Billion Forecast, by Service line 2020 & 2033
- Table 35: Global US Audit Industry Revenue Million Forecast, by Country 2020 & 2033
- Table 36: Global US Audit Industry Volume Billion Forecast, by Country 2020 & 2033
- Table 37: United Kingdom US Audit Industry Revenue (Million) Forecast, by Application 2020 & 2033
- Table 38: United Kingdom US Audit Industry Volume (Billion) Forecast, by Application 2020 & 2033
- Table 39: Germany US Audit Industry Revenue (Million) Forecast, by Application 2020 & 2033
- Table 40: Germany US Audit Industry Volume (Billion) Forecast, by Application 2020 & 2033
- Table 41: France US Audit Industry Revenue (Million) Forecast, by Application 2020 & 2033
- Table 42: France US Audit Industry Volume (Billion) Forecast, by Application 2020 & 2033
- Table 43: Italy US Audit Industry Revenue (Million) Forecast, by Application 2020 & 2033
- Table 44: Italy US Audit Industry Volume (Billion) Forecast, by Application 2020 & 2033
- Table 45: Spain US Audit Industry Revenue (Million) Forecast, by Application 2020 & 2033
- Table 46: Spain US Audit Industry Volume (Billion) Forecast, by Application 2020 & 2033
- Table 47: Russia US Audit Industry Revenue (Million) Forecast, by Application 2020 & 2033
- Table 48: Russia US Audit Industry Volume (Billion) Forecast, by Application 2020 & 2033
- Table 49: Benelux US Audit Industry Revenue (Million) Forecast, by Application 2020 & 2033
- Table 50: Benelux US Audit Industry Volume (Billion) Forecast, by Application 2020 & 2033
- Table 51: Nordics US Audit Industry Revenue (Million) Forecast, by Application 2020 & 2033
- Table 52: Nordics US Audit Industry Volume (Billion) Forecast, by Application 2020 & 2033
- Table 53: Rest of Europe US Audit Industry Revenue (Million) Forecast, by Application 2020 & 2033
- Table 54: Rest of Europe US Audit Industry Volume (Billion) Forecast, by Application 2020 & 2033
- Table 55: Global US Audit Industry Revenue Million Forecast, by Type 2020 & 2033
- Table 56: Global US Audit Industry Volume Billion Forecast, by Type 2020 & 2033
- Table 57: Global US Audit Industry Revenue Million Forecast, by Service line 2020 & 2033
- Table 58: Global US Audit Industry Volume Billion Forecast, by Service line 2020 & 2033
- Table 59: Global US Audit Industry Revenue Million Forecast, by Country 2020 & 2033
- Table 60: Global US Audit Industry Volume Billion Forecast, by Country 2020 & 2033
- Table 61: Turkey US Audit Industry Revenue (Million) Forecast, by Application 2020 & 2033
- Table 62: Turkey US Audit Industry Volume (Billion) Forecast, by Application 2020 & 2033
- Table 63: Israel US Audit Industry Revenue (Million) Forecast, by Application 2020 & 2033
- Table 64: Israel US Audit Industry Volume (Billion) Forecast, by Application 2020 & 2033
- Table 65: GCC US Audit Industry Revenue (Million) Forecast, by Application 2020 & 2033
- Table 66: GCC US Audit Industry Volume (Billion) Forecast, by Application 2020 & 2033
- Table 67: North Africa US Audit Industry Revenue (Million) Forecast, by Application 2020 & 2033
- Table 68: North Africa US Audit Industry Volume (Billion) Forecast, by Application 2020 & 2033
- Table 69: South Africa US Audit Industry Revenue (Million) Forecast, by Application 2020 & 2033
- Table 70: South Africa US Audit Industry Volume (Billion) Forecast, by Application 2020 & 2033
- Table 71: Rest of Middle East & Africa US Audit Industry Revenue (Million) Forecast, by Application 2020 & 2033
- Table 72: Rest of Middle East & Africa US Audit Industry Volume (Billion) Forecast, by Application 2020 & 2033
- Table 73: Global US Audit Industry Revenue Million Forecast, by Type 2020 & 2033
- Table 74: Global US Audit Industry Volume Billion Forecast, by Type 2020 & 2033
- Table 75: Global US Audit Industry Revenue Million Forecast, by Service line 2020 & 2033
- Table 76: Global US Audit Industry Volume Billion Forecast, by Service line 2020 & 2033
- Table 77: Global US Audit Industry Revenue Million Forecast, by Country 2020 & 2033
- Table 78: Global US Audit Industry Volume Billion Forecast, by Country 2020 & 2033
- Table 79: China US Audit Industry Revenue (Million) Forecast, by Application 2020 & 2033
- Table 80: China US Audit Industry Volume (Billion) Forecast, by Application 2020 & 2033
- Table 81: India US Audit Industry Revenue (Million) Forecast, by Application 2020 & 2033
- Table 82: India US Audit Industry Volume (Billion) Forecast, by Application 2020 & 2033
- Table 83: Japan US Audit Industry Revenue (Million) Forecast, by Application 2020 & 2033
- Table 84: Japan US Audit Industry Volume (Billion) Forecast, by Application 2020 & 2033
- Table 85: South Korea US Audit Industry Revenue (Million) Forecast, by Application 2020 & 2033
- Table 86: South Korea US Audit Industry Volume (Billion) Forecast, by Application 2020 & 2033
- Table 87: ASEAN US Audit Industry Revenue (Million) Forecast, by Application 2020 & 2033
- Table 88: ASEAN US Audit Industry Volume (Billion) Forecast, by Application 2020 & 2033
- Table 89: Oceania US Audit Industry Revenue (Million) Forecast, by Application 2020 & 2033
- Table 90: Oceania US Audit Industry Volume (Billion) Forecast, by Application 2020 & 2033
- Table 91: Rest of Asia Pacific US Audit Industry Revenue (Million) Forecast, by Application 2020 & 2033
- Table 92: Rest of Asia Pacific US Audit Industry Volume (Billion) Forecast, by Application 2020 & 2033
Frequently Asked Questions
1. What is the projected Compound Annual Growth Rate (CAGR) of the US Audit Industry?
The projected CAGR is approximately 3.27%.
2. Which companies are prominent players in the US Audit Industry?
Key companies in the market include Deloitte, EY, KPMG, PwC, RSM US, Grant Thornton LLP, A T Kearney, BDO USA, CBIZ & Mayer Hoffman McCann, Crowe Horwath**List Not Exhaustive.
3. What are the main segments of the US Audit Industry?
The market segments include Type, Service line.
4. Can you provide details about the market size?
The market size is estimated to be USD 50.24 Million as of 2022.
5. What are some drivers contributing to market growth?
N/A
6. What are the notable trends driving market growth?
Declining Quality of Auditing from the Big 4.
7. Are there any restraints impacting market growth?
N/A
8. Can you provide examples of recent developments in the market?
In May 2023, Deloitte and Google Cloud have recently bolstered their decade-long alliance, with a specific focus on deploying Google Cloud's cutting-edge Generative AI capabilities across various industries.
9. What pricing options are available for accessing the report?
Pricing options include single-user, multi-user, and enterprise licenses priced at USD 3800, USD 4500, and USD 5800 respectively.
10. Is the market size provided in terms of value or volume?
The market size is provided in terms of value, measured in Million and volume, measured in Billion.
11. Are there any specific market keywords associated with the report?
Yes, the market keyword associated with the report is "US Audit Industry," which aids in identifying and referencing the specific market segment covered.
12. How do I determine which pricing option suits my needs best?
The pricing options vary based on user requirements and access needs. Individual users may opt for single-user licenses, while businesses requiring broader access may choose multi-user or enterprise licenses for cost-effective access to the report.
13. Are there any additional resources or data provided in the US Audit Industry report?
While the report offers comprehensive insights, it's advisable to review the specific contents or supplementary materials provided to ascertain if additional resources or data are available.
14. How can I stay updated on further developments or reports in the US Audit Industry?
To stay informed about further developments, trends, and reports in the US Audit Industry, consider subscribing to industry newsletters, following relevant companies and organizations, or regularly checking reputable industry news sources and publications.
Methodology
Step 1 - Identification of Relevant Samples Size from Population Database


Step 2 - Approaches for Defining Global Market Size (Value, Volume* & Price*)

Note*: In applicable scenarios
Step 3 - Data Sources
Primary Research
- Web Analytics
- Survey Reports
- Research Institute
- Latest Research Reports
- Opinion Leaders
Secondary Research
- Annual Reports
- White Paper
- Latest Press Release
- Industry Association
- Paid Database
- Investor Presentations

Step 4 - Data Triangulation
Involves using different sources of information in order to increase the validity of a study
These sources are likely to be stakeholders in a program - participants, other researchers, program staff, other community members, and so on.
Then we put all data in single framework & apply various statistical tools to find out the dynamic on the market.
During the analysis stage, feedback from the stakeholder groups would be compared to determine areas of agreement as well as areas of divergence