

Key Insights for Virtual Assistant Services Market
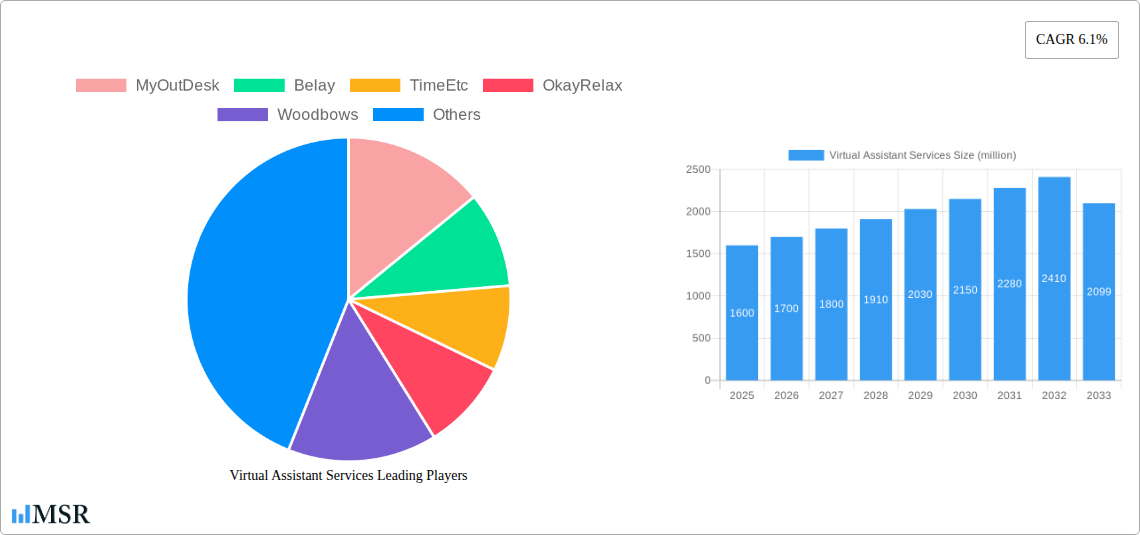
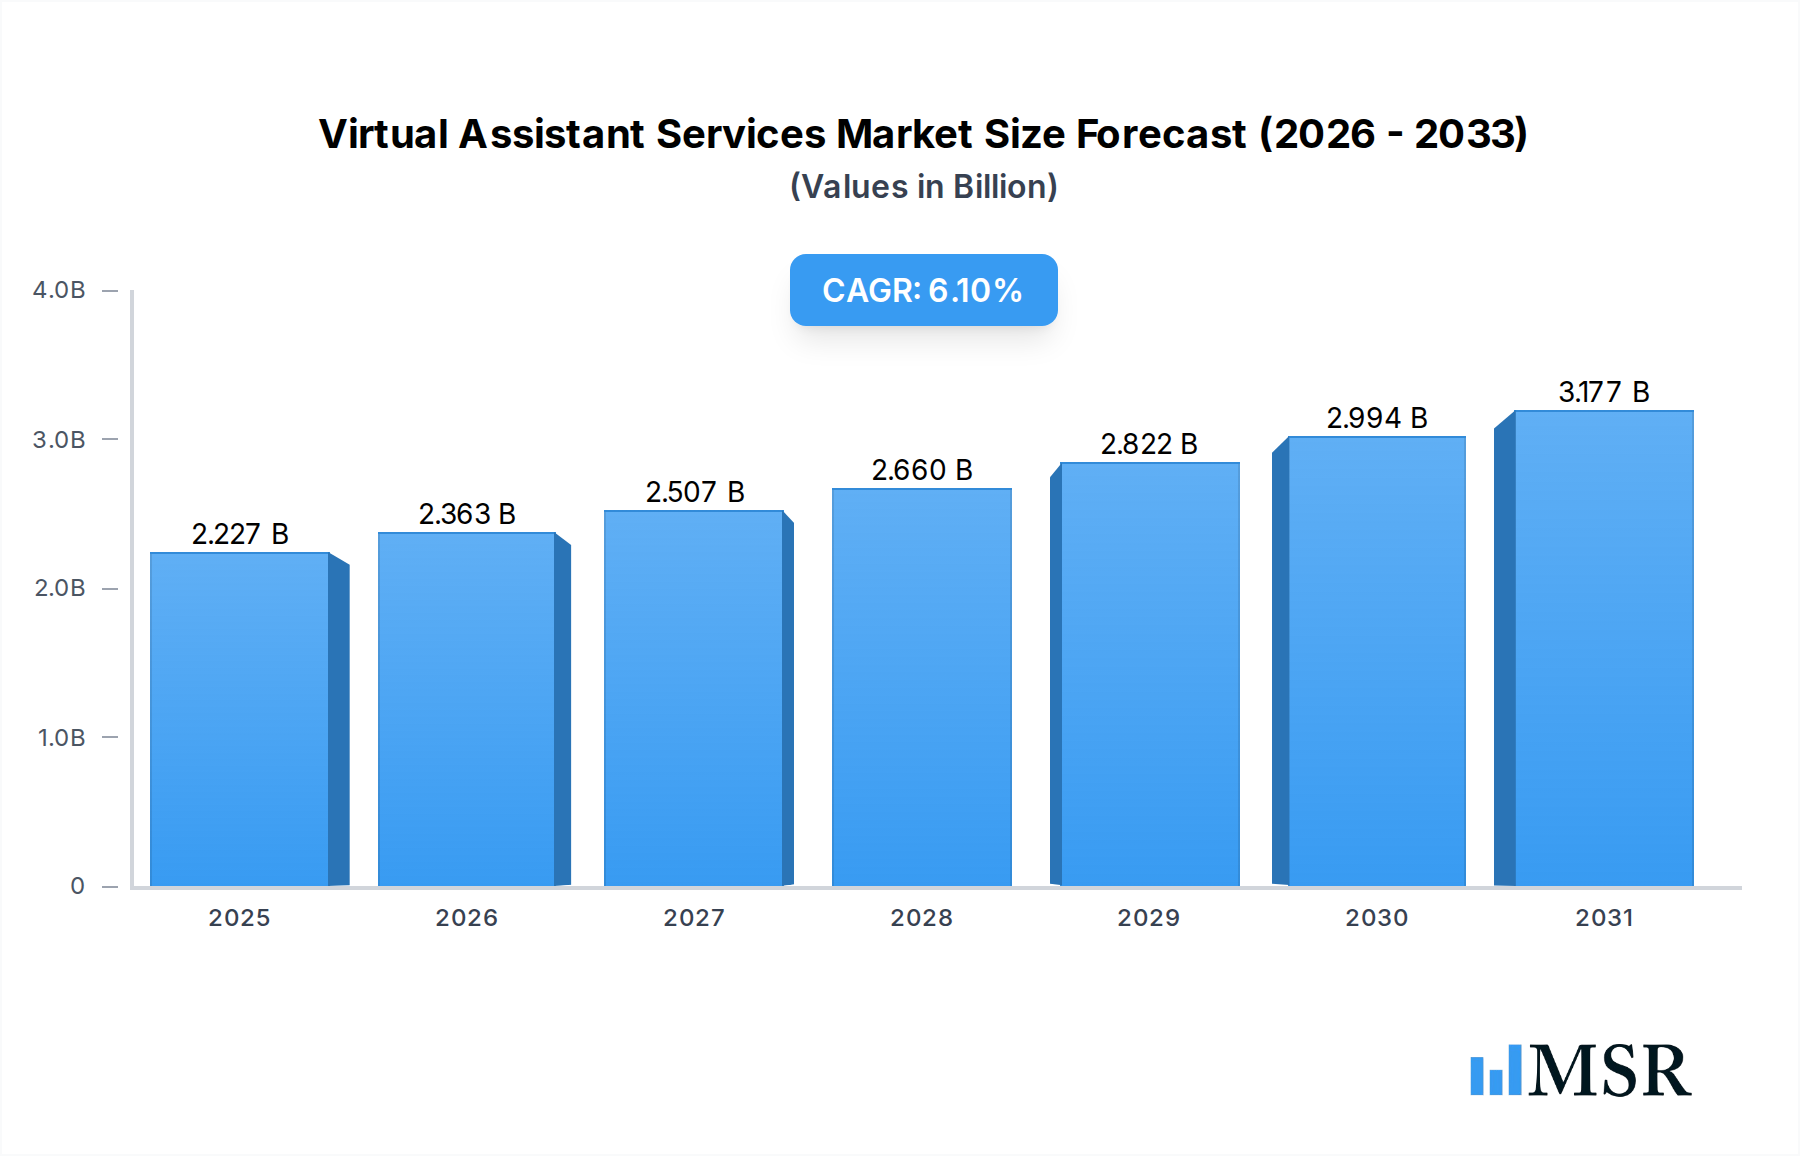
The Virtual Assistant Services Market was valued at approximately $2099 million in 2024 and is projected to expand significantly, reaching an estimated $3799 million by 2034, exhibiting a robust Compound Annual Growth Rate (CAGR) of 6.1% over the forecast period. This growth trajectory is underpinned by the increasing global demand for operational efficiency, cost optimization, and specialized expertise across diverse business functions. A primary demand driver stems from the accelerating adoption of remote work models and the ongoing digital transformation initiatives, compelling businesses of all sizes to re-evaluate traditional staffing paradigms. The market is witnessing substantial tailwinds from technological advancements, particularly in artificial intelligence (AI) and automation, which enhance the capabilities and scope of virtual assistant offerings. Businesses are increasingly leveraging virtual assistant services not just for administrative support, but also for specialized roles in marketing, customer service, technical support, and finance. This shift allows organizations to focus on core competencies, scale operations flexibly, and access a global talent pool without the overheads associated with full-time hires. The rising prominence of the gig economy and the increasing acceptance of outsourced business functions are further catalyzing market expansion. From a segmentation perspective, administrative tasks continue to represent a foundational demand, though growth in customer-facing and technical virtual assistant roles is accelerating due to the complexity of modern business operations. The Business Process Outsourcing Market provides a significant context, as virtual assistant services are a crucial component of broader BPO strategies aimed at streamlining non-core activities. Geographically, North America and Europe remain key revenue contributors, characterized by a mature digital infrastructure and a high propensity for outsourcing. However, the Asia Pacific region is rapidly emerging as a high-growth nexus, driven by cost-effectiveness, a vast talent pool, and increasing digitalization across its economies. The future outlook for the Virtual Assistant Services Market suggests continued innovation, with providers integrating more sophisticated AI tools to deliver predictive analytics and proactive support. This evolution will likely lead to more specialized service offerings and hybrid models that combine human expertise with intelligent automation, addressing complex operational requirements and further solidifying the market's indispensable role in the modern enterprise landscape. The demand for flexible and scalable solutions will ensure sustained market buoyancy, with a notable trend towards niche specializations and industry-specific virtual assistant solutions. The pervasive adoption of Remote Work Software Market solutions has normalized and facilitated the operational frameworks required for seamless virtual assistant integration, further bolstering market growth by making remote collaboration more efficient and secure.
Virtual Assistant Services Market Size (In Billion)
Dominant Segment Analysis in Virtual Assistant Services Market
Within the diverse landscape of the Virtual Assistant Services Market, the Administrative Virtual Assistant Market segment consistently holds the largest revenue share, a testament to the universal and perennial need for foundational operational support across businesses and individuals. This dominance is primarily attributable to the broad applicability of administrative tasks, which are essential for the smooth functioning of nearly every organization, regardless of industry or size. These services encompass a wide array of activities, including email management, scheduling and calendar organization, data entry, document preparation, travel arrangements, transcription, and basic research. Such tasks, while critical, are often time-consuming and can detract internal employees from focusing on higher-value, core strategic objectives. By outsourcing these routine, yet vital, functions to administrative virtual assistants, companies can significantly enhance internal productivity, optimize resource allocation, and reduce operational overheads associated with hiring full-time administrative staff, including benefits and office space.
Virtual Assistant Services Company Market Share
Key Market Drivers & Constraints for Virtual Assistant Services Market
The Virtual Assistant Services Market expansion is driven by a confluence of economic and operational factors. A significant driver is the pervasive push for cost efficiency and operational scalability. According to industry analyses, businesses can realize savings of up to 70% on administrative and support functions by opting for virtual assistant services over full-time employees, factoring in salaries, benefits, and infrastructure costs. This allows businesses, especially SMBs, to manage fluctuating workloads and access specialized skills without incurring high fixed overheads, providing unparalleled agility.
Another potent driver is the imperative for organizations to focus on core competencies. By delegating non-core, routine tasks such as data entry and scheduling to virtual assistants, internal teams can redirect their efforts towards strategic initiatives that directly impact revenue and innovation. This strategic re-prioritization aligns with broader Business Process Outsourcing Market trends, enhancing overall organizational productivity and competitive positioning.
Furthermore, access to specialized skills acts as a crucial catalyst. Virtual assistants offer a diverse range of expertise, from digital marketing to technical support, which can be prohibitively expensive or difficult to recruit in-house. The global talent pool accessible through virtual assistant platforms democratizes specialized knowledge, enabling businesses to acquire targeted skills on demand.
The dramatic increase in remote work adoption and digital transformation initiatives globally has normalized the operational framework for virtual assistant services. The widespread implementation of Remote Work Software Market solutions has enabled seamless collaboration, communication, and project management. This trend, accelerated significantly since 2020, has cemented virtual assistance as a mainstream operational model. The growth of the Digital Transformation Services Market also plays a role, as companies investing in digital change often seek agile, virtual support structures.
However, the market faces notable constraints. Data security and privacy concerns represent a significant barrier, particularly in highly regulated sectors. Businesses are often hesitant to share sensitive data with external parties, necessitating robust security protocols and verifiable trust from providers to ensure compliance with regulations like GDPR or CCPA.
Communication and coordination challenges also pose a restraint. Differences in time zones, cultural nuances, and potential for misinterpretation can lead to inefficiencies or project delays in distributed teams. Effective communication strategies and standardized protocols are vital to mitigate these risks. Lastly, quality control and standardization issues can arise due to variability in skill sets among individual virtual assistants, requiring thorough vetting and clear performance metrics for clients.
Competitive Ecosystem of Virtual Assistant Services Market
The Virtual Assistant Services Market is characterized by a fragmented yet evolving competitive landscape, featuring a mix of dedicated virtual assistant firms, broader outsourcing providers, and talent platforms. Key players leverage distinct service models, technological integration, and specialization to differentiate themselves:
- Virtalent: A UK-based virtual assistant company specializing in offering highly skilled administrative and marketing support to entrepreneurs and businesses.
- MyTasker: An India-based virtual assistant service provider known for delivering comprehensive administrative, technical, and customer support solutions globally.
- MyOutDesk: Specializes in providing virtual assistant solutions for the real estate industry, focusing on administrative, marketing, and transaction coordination tasks.
- Belay Solutions: Offers executive assistants, bookkeepers, and marketing managers as virtual solutions, primarily targeting small and medium-sized businesses in North America.
- Prialto: Provides managed executive assistant services for busy executives and teams, focusing on productivity enhancement through dedicated virtual support.
- Fancy Hands: A task-based virtual assistant service that allows clients to delegate small, one-off administrative and personal tasks efficiently.
- Time Etc: A provider of experienced virtual assistants in the UK and US, offering administrative, marketing, and secretarial support to a diverse clientele.
- Magic: Known for its "on-demand" virtual assistant service, leveraging AI and human support for a wide array of personal and business requests, including the Customer Support Services Market.
- Upwork: While primarily a freelancing platform, it significantly facilitates businesses in finding and hiring independent virtual assistants for various roles, thereby dynamically shaping the Virtual Assistant Services Market.
- Virtual Gurus: A Canadian company offering dedicated virtual assistants specializing in administrative, marketing, and technical support, with a focus on matching skilled professionals to client needs.
- Valenta: Offers a range of outsourcing services, including virtual assistants, to enhance business efficiency and productivity for companies globally, often serving the Enterprise Solutions Market.
- Zirtual: Provides dedicated, US-based virtual assistants for busy executives and entrepreneurs, focusing on administrative and lifestyle management tasks.
- Nuance: Though recognized for AI-powered customer engagement, its underlying speech recognition technologies significantly influence the capabilities and adoption of voice-based virtual assistants across the market.
Recent Developments & Milestones in Virtual Assistant Services Market
The Virtual Assistant Services Market has been actively evolving with strategic integrations and service expansions aimed at enhancing efficiency and broadening capabilities:
- October 2023: Several leading virtual assistant platforms announced the integration of advanced generative AI tools to automate routine tasks, such as initial email drafting and social media scheduling, significantly improving efficiency for administrative and marketing virtual assistants.
- August 2023: A major global virtual assistant provider secured a strategic partnership with a prominent Remote Work Software Market developer, aiming to create a more seamless and integrated workflow experience for clients managing remote teams and virtual assistants.
- June 2023: Specialized virtual assistant firms introduced new service packages explicitly tailored for the SMB Solutions Market, focusing on affordable, scalable support for digital marketing, e-commerce management, and basic financial administration.
- April 2023: A notable venture capital firm closed a significant funding round for a startup specializing in AI-powered virtual assistants for legal and compliance tasks, highlighting growing investment in niche, high-value segments.
- February 2023: Leading providers expanded their geographical footprints, particularly into emerging markets in Southeast Asia and Latin America, capitalizing on growing digitalization and a cost-effective talent pool.
- November 2022: Several virtual assistant platforms launched enhanced data security protocols and compliance certifications (e.g., ISO 27001) in response to escalating client concerns regarding data privacy, particularly from large enterprises.
- September 2022: A major virtual assistant service provider acquired a smaller, specialized creative services agency, broadening its offerings to include advanced graphic design, content creation, and social media strategy, serving the demand for comprehensive digital support.
- July 2022: Collaboration tools within various virtual assistant platforms saw significant upgrades, introducing features like real-time project tracking, shared document editing, and integrated communication channels to optimize client-assistant interactions.
Regional Market Breakdown for Virtual Assistant Services Market
The global Virtual Assistant Services Market exhibits distinct regional dynamics, influenced by varying levels of digital adoption, economic structures, and outsourcing trends.
North America holds a significant revenue share in the Virtual Assistant Services Market and is considered a mature market. Characterized by high digital penetration and a strong entrepreneurial culture, the region, particularly the United States, sees businesses widely outsourcing non-core functions to enhance efficiency. Primary drivers include high labor costs and the need for specialized skills. Its growth rate is steady, estimated at a CAGR of approximately 5.5%.
Europe represents a substantial portion of the market, with key contributions from the UK, Germany, and France. Businesses leverage virtual assistants for administrative, customer service, and marketing tasks to optimize costs. The region's stringent data privacy regulations (e.g., GDPR) necessitate robust compliance from providers. Europe is projected to grow at a CAGR of around 5.9%, driven by ongoing digitalization and increasing remote work adoption.
The Asia Pacific (APAC) region is the fastest-growing market for virtual assistant services, expected to demonstrate a CAGR exceeding 7.5%. This rapid expansion is fueled by large, cost-effective talent pools (e.g., India, Philippines), escalating digital literacy, and increasing foreign investments. Domestic SMBs and startups are rapidly adopting these services. The demand for Artificial Intelligence Services Market integration within VA platforms is particularly strong here, as businesses seek to automate and enhance service delivery.
Latin America is an emerging market with significant growth potential, exhibiting a projected CAGR of about 6.8%. Increasing internet penetration, a growing number of startups, and a cultural shift towards remote collaboration are driving demand. Brazil and Mexico are leading adoption, primarily for administrative and customer support virtual assistants.
The Middle East & Africa (MEA) region, while smaller, is showing promising growth, with a CAGR estimated around 6.3%. Investments in digital infrastructure and economic diversification are creating opportunities, particularly in the GCC countries and South Africa, as businesses seek flexible staffing solutions.
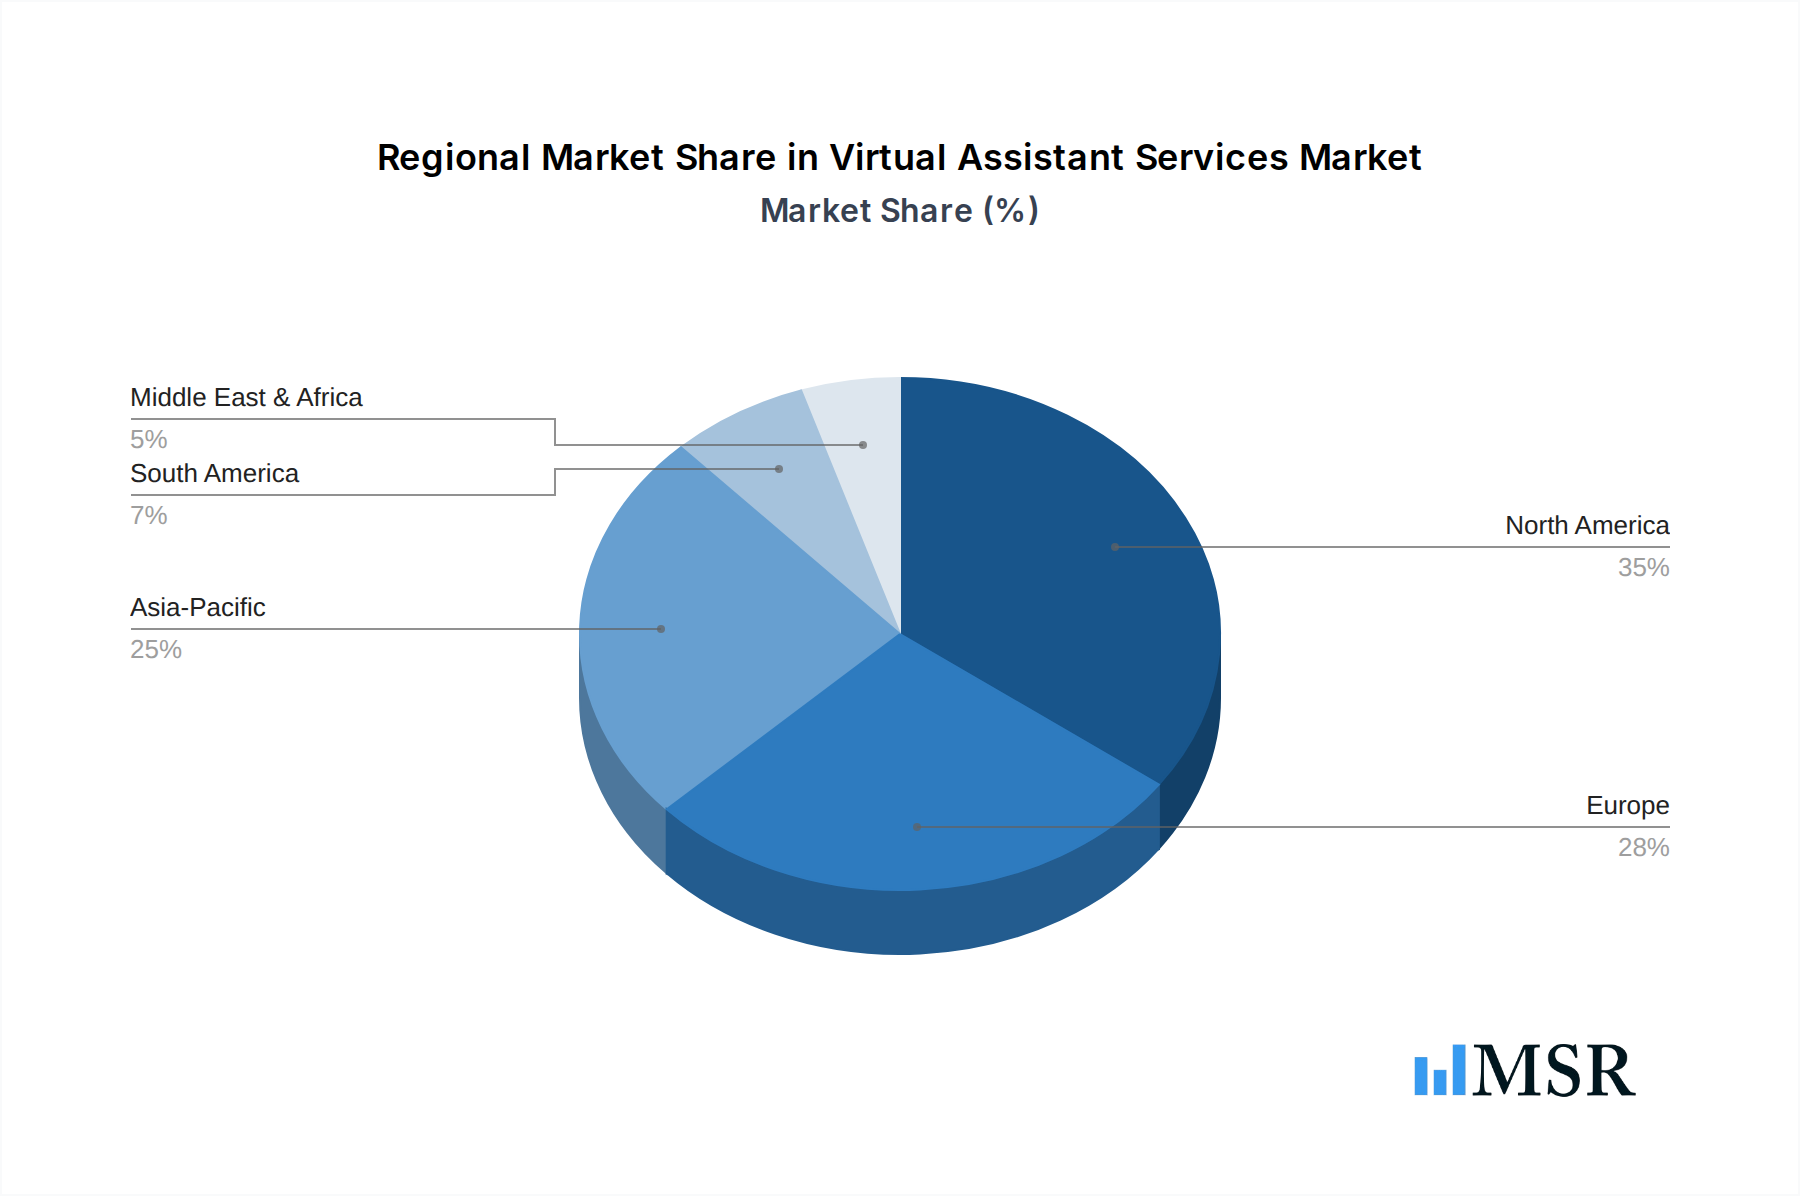
Virtual Assistant Services Regional Market Share
Investment & Funding Activity in Virtual Assistant Services Market
The Virtual Assistant Services Market has attracted significant investment and funding activity over the past 2-3 years, reflecting growing confidence in its long-term potential. Venture capital (VC) funding has increasingly flowed into startups that leverage Artificial Intelligence Services Market capabilities to offer advanced virtual assistant solutions. These include platforms that provide intelligent automation for routine tasks, natural language processing for enhanced customer interactions, and predictive analytics to anticipate client needs.
Strategic partnerships have also become a common theme, with virtual assistant providers collaborating with technology companies to integrate new features or expand service offerings. For instance, partnerships with developers of project management software or CRM systems enable virtual assistants to seamlessly integrate into existing business workflows, increasing their value proposition. Acquisitions have also occurred, typically involving larger service providers acquiring smaller, niche virtual assistant agencies to broaden their specialized expertise, such as in legal, medical, or creative virtual assistance.
Sub-segments attracting the most capital are those focused on specialized, high-value tasks and AI-driven efficiency. This includes virtual assistants for specialized marketing (e.g., SEO, content strategy), technical support, financial administration, and data analysis. Investors are particularly keen on solutions that offer a quantifiable return on investment through significant time savings or cost reductions. Furthermore, platforms that facilitate hybrid models—combining human virtual assistants with AI tools—are seeing strong interest, as they promise the best of both worlds: personalized human touch with scalable automation. The drive towards the SMB Solutions Market also fuels investment in scalable and affordable VA platforms, designed to empower smaller businesses with enterprise-grade support.
Customer Segmentation & Buying Behavior in Virtual Assistant Services Market
The Virtual Assistant Services Market caters to a diverse range of end-users, each exhibiting distinct purchasing criteria, price sensitivities, and preferred procurement channels. The primary end-user segments are Individuals, Small and Medium-sized Businesses (SMBs), Large Enterprises, and Government and Public sector entities.
Individuals (Entrepreneurs, Freelancers, High-Net-Worth Individuals): These buyers are often price-sensitive, seeking cost-effective solutions for personal and basic administrative tasks. Their purchasing criteria prioritize affordability, ease of onboarding, and flexibility (e.g., hourly rates, task-based pricing). They typically procure services through online freelance platforms like Upwork or subscription-based services like Fancy Hands, often prioritizing immediate availability and a broad range of general administrative support.
Small and Medium-sized Businesses (SMBs): This segment is highly focused on cost-effectiveness, scalability, and access to a diverse skill set that may be too expensive to hire in-house. They require virtual assistants for administrative support, digital marketing, customer service, and basic bookkeeping. SMBs prioritize providers offering flexible packages (retainer-based or monthly subscriptions) and transparent pricing. Reliability and the ability to free up internal staff for core activities are crucial. The SMB Solutions Market segment is driven by the need for operational leverage without significant capital investment.
Large Enterprises: These clients prioritize specialized expertise, data security, compliance with corporate governance, and seamless integration with existing IT systems. Their purchasing criteria often involve robust Service Level Agreements (SLAs), dedicated account management, and verifiable security certifications. Price sensitivity is lower than for SMBs, with value placed on strategic partnership and high-quality, specialized support for complex functions. Procurement often occurs through direct contracts with established virtual assistant agencies or Business Process Outsourcing (BPO) firms. Large enterprises particularly seek virtual assistants for specialized tasks within the Enterprise Solutions Market, such as advanced technical support, financial analysis, or specialized customer engagement, integrating with their existing CRM or ERP systems.
Government and Public Sector: This segment is characterized by stringent procurement processes, high security requirements, and a strong emphasis on compliance and transparency. They typically seek virtual assistants for administrative tasks, data management, and public inquiry support. While highly bureaucratic, the demand is growing due to the push for efficiency and digital public services. Price sensitivity is balanced with the need for reliability and adherence to strict regulations.
Notable shifts in buyer preference include an increasing demand for virtual assistants with specialized technical skills (e.g., familiarity with CRM software, specific industry tools) and a growing interest in hybrid models that combine human assistance with AI-powered automation for enhanced efficiency and personalized service. Clients are also placing greater emphasis on providers who can demonstrate strong data protection practices and clear communication protocols.
Virtual Assistant Services Segmentation
-
1. Type
- 1.1. Administrative Virtual Assistant
- 1.2. Customer Facing Virtual Assistant
- 1.3. Creative/Design Virtual Assistant
- 1.4. Technical Virtual Assistant
- 1.5. Finance/Accounting Virtual Assistant
-
2. Channel
- 2.1. Text-based
- 2.2. Voice-based
- 2.3. Omnichannel/Multichannel
-
3. Pricing
- 3.1. Hourly/Task-Based
- 3.2. Retainer / Package-based
- 3.3. Subscription-based
-
4. End User
- 4.1. Individuals
- 4.2. SMBs
- 4.3. Large Enterprises
- 4.4. Government and Public
Virtual Assistant Services Segmentation By Geography
-
1. North America
- 1.1. United States
- 1.2. Canada
- 1.3. Mexico
-
2. South America
- 2.1. Brazil
- 2.2. Argentina
- 2.3. Rest of South America
-
3. Europe
- 3.1. United Kingdom
- 3.2. Germany
- 3.3. France
- 3.4. Italy
- 3.5. Spain
- 3.6. Russia
- 3.7. Benelux
- 3.8. Nordics
- 3.9. Rest of Europe
-
4. Middle East & Africa
- 4.1. Turkey
- 4.2. Israel
- 4.3. GCC
- 4.4. North Africa
- 4.5. South Africa
- 4.6. Rest of Middle East & Africa
-
5. Asia Pacific
- 5.1. China
- 5.2. India
- 5.3. Japan
- 5.4. South Korea
- 5.5. ASEAN
- 5.6. Oceania
- 5.7. Rest of Asia Pacific
Virtual Assistant Services Regional Market Share
Geographic Coverage of Virtual Assistant Services
Virtual Assistant Services REPORT HIGHLIGHTS
| Aspects | Details |
|---|---|
| Study Period | 2020-2034 |
| Base Year | 2025 |
| Estimated Year | 2026 |
| Forecast Period | 2026-2034 |
| Historical Period | 2020-2025 |
| Growth Rate | CAGR of 6.1% from 2020-2034 |
| Segmentation |
|
Table of Contents
- 1. Introduction
- 1.1. Research Scope
- 1.2. Market Segmentation
- 1.3. Research Objective
- 1.4. Definitions and Assumptions
- 2. Executive Summary
- 2.1. Market Snapshot
- 3. Market Dynamics
- 3.1. Market Drivers
- 3.2. Market Restrains
- 3.3. Market Trends
- 3.4. Market Opportunities
- 4. Market Factor Analysis
- 4.1. Porters Five Forces
- 4.1.1. Bargaining Power of Suppliers
- 4.1.2. Bargaining Power of Buyers
- 4.1.3. Threat of New Entrants
- 4.1.4. Threat of Substitutes
- 4.1.5. Competitive Rivalry
- 4.2. PESTEL analysis
- 4.3. BCG Analysis
- 4.3.1. Stars (High Growth, High Market Share)
- 4.3.2. Cash Cows (Low Growth, High Market Share)
- 4.3.3. Question Mark (High Growth, Low Market Share)
- 4.3.4. Dogs (Low Growth, Low Market Share)
- 4.4. Ansoff Matrix Analysis
- 4.5. Supply Chain Analysis
- 4.6. Regulatory Landscape
- 4.7. Current Market Potential and Opportunity Assessment (TAM–SAM–SOM Framework)
- 4.8. MSR Analyst Note
- 4.1. Porters Five Forces
- 5. Market Analysis, Insights and Forecast 2021-2033
- 5.1. Market Analysis, Insights and Forecast - by Type
- 5.1.1. Administrative Virtual Assistant
- 5.1.2. Customer Facing Virtual Assistant
- 5.1.3. Creative/Design Virtual Assistant
- 5.1.4. Technical Virtual Assistant
- 5.1.5. Finance/Accounting Virtual Assistant
- 5.2. Market Analysis, Insights and Forecast - by Channel
- 5.2.1. Text-based
- 5.2.2. Voice-based
- 5.2.3. Omnichannel/Multichannel
- 5.3. Market Analysis, Insights and Forecast - by Pricing
- 5.3.1. Hourly/Task-Based
- 5.3.2. Retainer / Package-based
- 5.3.3. Subscription-based
- 5.4. Market Analysis, Insights and Forecast - by End User
- 5.4.1. Individuals
- 5.4.2. SMBs
- 5.4.3. Large Enterprises
- 5.4.4. Government and Public
- 5.5. Market Analysis, Insights and Forecast - by Region
- 5.5.1. North America
- 5.5.2. South America
- 5.5.3. Europe
- 5.5.4. Middle East & Africa
- 5.5.5. Asia Pacific
- 5.1. Market Analysis, Insights and Forecast - by Type
- 6. Global Virtual Assistant Services Analysis, Insights and Forecast, 2021-2033
- 6.1. Market Analysis, Insights and Forecast - by Type
- 6.1.1. Administrative Virtual Assistant
- 6.1.2. Customer Facing Virtual Assistant
- 6.1.3. Creative/Design Virtual Assistant
- 6.1.4. Technical Virtual Assistant
- 6.1.5. Finance/Accounting Virtual Assistant
- 6.2. Market Analysis, Insights and Forecast - by Channel
- 6.2.1. Text-based
- 6.2.2. Voice-based
- 6.2.3. Omnichannel/Multichannel
- 6.3. Market Analysis, Insights and Forecast - by Pricing
- 6.3.1. Hourly/Task-Based
- 6.3.2. Retainer / Package-based
- 6.3.3. Subscription-based
- 6.4. Market Analysis, Insights and Forecast - by End User
- 6.4.1. Individuals
- 6.4.2. SMBs
- 6.4.3. Large Enterprises
- 6.4.4. Government and Public
- 6.1. Market Analysis, Insights and Forecast - by Type
- 7. North America Virtual Assistant Services Analysis, Insights and Forecast, 2020-2032
- 7.1. Market Analysis, Insights and Forecast - by Type
- 7.1.1. Administrative Virtual Assistant
- 7.1.2. Customer Facing Virtual Assistant
- 7.1.3. Creative/Design Virtual Assistant
- 7.1.4. Technical Virtual Assistant
- 7.1.5. Finance/Accounting Virtual Assistant
- 7.2. Market Analysis, Insights and Forecast - by Channel
- 7.2.1. Text-based
- 7.2.2. Voice-based
- 7.2.3. Omnichannel/Multichannel
- 7.3. Market Analysis, Insights and Forecast - by Pricing
- 7.3.1. Hourly/Task-Based
- 7.3.2. Retainer / Package-based
- 7.3.3. Subscription-based
- 7.4. Market Analysis, Insights and Forecast - by End User
- 7.4.1. Individuals
- 7.4.2. SMBs
- 7.4.3. Large Enterprises
- 7.4.4. Government and Public
- 7.1. Market Analysis, Insights and Forecast - by Type
- 8. South America Virtual Assistant Services Analysis, Insights and Forecast, 2020-2032
- 8.1. Market Analysis, Insights and Forecast - by Type
- 8.1.1. Administrative Virtual Assistant
- 8.1.2. Customer Facing Virtual Assistant
- 8.1.3. Creative/Design Virtual Assistant
- 8.1.4. Technical Virtual Assistant
- 8.1.5. Finance/Accounting Virtual Assistant
- 8.2. Market Analysis, Insights and Forecast - by Channel
- 8.2.1. Text-based
- 8.2.2. Voice-based
- 8.2.3. Omnichannel/Multichannel
- 8.3. Market Analysis, Insights and Forecast - by Pricing
- 8.3.1. Hourly/Task-Based
- 8.3.2. Retainer / Package-based
- 8.3.3. Subscription-based
- 8.4. Market Analysis, Insights and Forecast - by End User
- 8.4.1. Individuals
- 8.4.2. SMBs
- 8.4.3. Large Enterprises
- 8.4.4. Government and Public
- 8.1. Market Analysis, Insights and Forecast - by Type
- 9. Europe Virtual Assistant Services Analysis, Insights and Forecast, 2020-2032
- 9.1. Market Analysis, Insights and Forecast - by Type
- 9.1.1. Administrative Virtual Assistant
- 9.1.2. Customer Facing Virtual Assistant
- 9.1.3. Creative/Design Virtual Assistant
- 9.1.4. Technical Virtual Assistant
- 9.1.5. Finance/Accounting Virtual Assistant
- 9.2. Market Analysis, Insights and Forecast - by Channel
- 9.2.1. Text-based
- 9.2.2. Voice-based
- 9.2.3. Omnichannel/Multichannel
- 9.3. Market Analysis, Insights and Forecast - by Pricing
- 9.3.1. Hourly/Task-Based
- 9.3.2. Retainer / Package-based
- 9.3.3. Subscription-based
- 9.4. Market Analysis, Insights and Forecast - by End User
- 9.4.1. Individuals
- 9.4.2. SMBs
- 9.4.3. Large Enterprises
- 9.4.4. Government and Public
- 9.1. Market Analysis, Insights and Forecast - by Type
- 10. Middle East & Africa Virtual Assistant Services Analysis, Insights and Forecast, 2020-2032
- 10.1. Market Analysis, Insights and Forecast - by Type
- 10.1.1. Administrative Virtual Assistant
- 10.1.2. Customer Facing Virtual Assistant
- 10.1.3. Creative/Design Virtual Assistant
- 10.1.4. Technical Virtual Assistant
- 10.1.5. Finance/Accounting Virtual Assistant
- 10.2. Market Analysis, Insights and Forecast - by Channel
- 10.2.1. Text-based
- 10.2.2. Voice-based
- 10.2.3. Omnichannel/Multichannel
- 10.3. Market Analysis, Insights and Forecast - by Pricing
- 10.3.1. Hourly/Task-Based
- 10.3.2. Retainer / Package-based
- 10.3.3. Subscription-based
- 10.4. Market Analysis, Insights and Forecast - by End User
- 10.4.1. Individuals
- 10.4.2. SMBs
- 10.4.3. Large Enterprises
- 10.4.4. Government and Public
- 10.1. Market Analysis, Insights and Forecast - by Type
- 11. Asia Pacific Virtual Assistant Services Analysis, Insights and Forecast, 2020-2032
- 11.1. Market Analysis, Insights and Forecast - by Type
- 11.1.1. Administrative Virtual Assistant
- 11.1.2. Customer Facing Virtual Assistant
- 11.1.3. Creative/Design Virtual Assistant
- 11.1.4. Technical Virtual Assistant
- 11.1.5. Finance/Accounting Virtual Assistant
- 11.2. Market Analysis, Insights and Forecast - by Channel
- 11.2.1. Text-based
- 11.2.2. Voice-based
- 11.2.3. Omnichannel/Multichannel
- 11.3. Market Analysis, Insights and Forecast - by Pricing
- 11.3.1. Hourly/Task-Based
- 11.3.2. Retainer / Package-based
- 11.3.3. Subscription-based
- 11.4. Market Analysis, Insights and Forecast - by End User
- 11.4.1. Individuals
- 11.4.2. SMBs
- 11.4.3. Large Enterprises
- 11.4.4. Government and Public
- 11.1. Market Analysis, Insights and Forecast - by Type
- 12. Competitive Analysis
- 12.1. Company Profiles
- 12.1.1 Virtalent
- 12.1.1.1. Company Overview
- 12.1.1.2. Products
- 12.1.1.3. Company Financials
- 12.1.1.4. SWOT Analysis
- 12.1.2 MyTasker
- 12.1.2.1. Company Overview
- 12.1.2.2. Products
- 12.1.2.3. Company Financials
- 12.1.2.4. SWOT Analysis
- 12.1.3 MyOutDesk
- 12.1.3.1. Company Overview
- 12.1.3.2. Products
- 12.1.3.3. Company Financials
- 12.1.3.4. SWOT Analysis
- 12.1.4 Belay Solutions
- 12.1.4.1. Company Overview
- 12.1.4.2. Products
- 12.1.4.3. Company Financials
- 12.1.4.4. SWOT Analysis
- 12.1.5 Okay Relax
- 12.1.5.1. Company Overview
- 12.1.5.2. Products
- 12.1.5.3. Company Financials
- 12.1.5.4. SWOT Analysis
- 12.1.6 WoodBows
- 12.1.6.1. Company Overview
- 12.1.6.2. Products
- 12.1.6.3. Company Financials
- 12.1.6.4. SWOT Analysis
- 12.1.7 Prialto
- 12.1.7.1. Company Overview
- 12.1.7.2. Products
- 12.1.7.3. Company Financials
- 12.1.7.4. SWOT Analysis
- 12.1.8 Fancy Hands
- 12.1.8.1. Company Overview
- 12.1.8.2. Products
- 12.1.8.3. Company Financials
- 12.1.8.4. SWOT Analysis
- 12.1.9 Time Etc
- 12.1.9.1. Company Overview
- 12.1.9.2. Products
- 12.1.9.3. Company Financials
- 12.1.9.4. SWOT Analysis
- 12.1.10 Magic
- 12.1.10.1. Company Overview
- 12.1.10.2. Products
- 12.1.10.3. Company Financials
- 12.1.10.4. SWOT Analysis
- 12.1.11 Upwork
- 12.1.11.1. Company Overview
- 12.1.11.2. Products
- 12.1.11.3. Company Financials
- 12.1.11.4. SWOT Analysis
- 12.1.12 Uassist.ME
- 12.1.12.1. Company Overview
- 12.1.12.2. Products
- 12.1.12.3. Company Financials
- 12.1.12.4. SWOT Analysis
- 12.1.13 Virtual Assistant Canada
- 12.1.13.1. Company Overview
- 12.1.13.2. Products
- 12.1.13.3. Company Financials
- 12.1.13.4. SWOT Analysis
- 12.1.14 Virtual Gurus
- 12.1.14.1. Company Overview
- 12.1.14.2. Products
- 12.1.14.3. Company Financials
- 12.1.14.4. SWOT Analysis
- 12.1.15 Pepper Virtual Assistant Services
- 12.1.15.1. Company Overview
- 12.1.15.2. Products
- 12.1.15.3. Company Financials
- 12.1.15.4. SWOT Analysis
- 12.1.16 CIBC
- 12.1.16.1. Company Overview
- 12.1.16.2. Products
- 12.1.16.3. Company Financials
- 12.1.16.4. SWOT Analysis
- 12.1.17 Valenta
- 12.1.17.1. Company Overview
- 12.1.17.2. Products
- 12.1.17.3. Company Financials
- 12.1.17.4. SWOT Analysis
- 12.1.18 Zirtual
- 12.1.18.1. Company Overview
- 12.1.18.2. Products
- 12.1.18.3. Company Financials
- 12.1.18.4. SWOT Analysis
- 12.1.19 Nuance
- 12.1.19.1. Company Overview
- 12.1.19.2. Products
- 12.1.19.3. Company Financials
- 12.1.19.4. SWOT Analysis
- 12.1.20 Fidelity
- 12.1.20.1. Company Overview
- 12.1.20.2. Products
- 12.1.20.3. Company Financials
- 12.1.20.4. SWOT Analysis
- 12.1.21 Others
- 12.1.21.1. Company Overview
- 12.1.21.2. Products
- 12.1.21.3. Company Financials
- 12.1.21.4. SWOT Analysis
- 12.1.1 Virtalent
- 12.2. Market Entropy
- 12.2.1 Company's Key Areas Served
- 12.2.2 Recent Developments
- 12.3. Company Market Share Analysis 2025
- 12.3.1 Top 5 Companies Market Share Analysis
- 12.3.2 Top 3 Companies Market Share Analysis
- 12.4. List of Potential Customers
- 13. Research Methodology
List of Figures
- Figure 1: Global Virtual Assistant Services Revenue Breakdown (million, %) by Region 2025 & 2033
- Figure 2: North America Virtual Assistant Services Revenue (million), by Type 2025 & 2033
- Figure 3: North America Virtual Assistant Services Revenue Share (%), by Type 2025 & 2033
- Figure 4: North America Virtual Assistant Services Revenue (million), by Channel 2025 & 2033
- Figure 5: North America Virtual Assistant Services Revenue Share (%), by Channel 2025 & 2033
- Figure 6: North America Virtual Assistant Services Revenue (million), by Pricing 2025 & 2033
- Figure 7: North America Virtual Assistant Services Revenue Share (%), by Pricing 2025 & 2033
- Figure 8: North America Virtual Assistant Services Revenue (million), by End User 2025 & 2033
- Figure 9: North America Virtual Assistant Services Revenue Share (%), by End User 2025 & 2033
- Figure 10: North America Virtual Assistant Services Revenue (million), by Country 2025 & 2033
- Figure 11: North America Virtual Assistant Services Revenue Share (%), by Country 2025 & 2033
- Figure 12: South America Virtual Assistant Services Revenue (million), by Type 2025 & 2033
- Figure 13: South America Virtual Assistant Services Revenue Share (%), by Type 2025 & 2033
- Figure 14: South America Virtual Assistant Services Revenue (million), by Channel 2025 & 2033
- Figure 15: South America Virtual Assistant Services Revenue Share (%), by Channel 2025 & 2033
- Figure 16: South America Virtual Assistant Services Revenue (million), by Pricing 2025 & 2033
- Figure 17: South America Virtual Assistant Services Revenue Share (%), by Pricing 2025 & 2033
- Figure 18: South America Virtual Assistant Services Revenue (million), by End User 2025 & 2033
- Figure 19: South America Virtual Assistant Services Revenue Share (%), by End User 2025 & 2033
- Figure 20: South America Virtual Assistant Services Revenue (million), by Country 2025 & 2033
- Figure 21: South America Virtual Assistant Services Revenue Share (%), by Country 2025 & 2033
- Figure 22: Europe Virtual Assistant Services Revenue (million), by Type 2025 & 2033
- Figure 23: Europe Virtual Assistant Services Revenue Share (%), by Type 2025 & 2033
- Figure 24: Europe Virtual Assistant Services Revenue (million), by Channel 2025 & 2033
- Figure 25: Europe Virtual Assistant Services Revenue Share (%), by Channel 2025 & 2033
- Figure 26: Europe Virtual Assistant Services Revenue (million), by Pricing 2025 & 2033
- Figure 27: Europe Virtual Assistant Services Revenue Share (%), by Pricing 2025 & 2033
- Figure 28: Europe Virtual Assistant Services Revenue (million), by End User 2025 & 2033
- Figure 29: Europe Virtual Assistant Services Revenue Share (%), by End User 2025 & 2033
- Figure 30: Europe Virtual Assistant Services Revenue (million), by Country 2025 & 2033
- Figure 31: Europe Virtual Assistant Services Revenue Share (%), by Country 2025 & 2033
- Figure 32: Middle East & Africa Virtual Assistant Services Revenue (million), by Type 2025 & 2033
- Figure 33: Middle East & Africa Virtual Assistant Services Revenue Share (%), by Type 2025 & 2033
- Figure 34: Middle East & Africa Virtual Assistant Services Revenue (million), by Channel 2025 & 2033
- Figure 35: Middle East & Africa Virtual Assistant Services Revenue Share (%), by Channel 2025 & 2033
- Figure 36: Middle East & Africa Virtual Assistant Services Revenue (million), by Pricing 2025 & 2033
- Figure 37: Middle East & Africa Virtual Assistant Services Revenue Share (%), by Pricing 2025 & 2033
- Figure 38: Middle East & Africa Virtual Assistant Services Revenue (million), by End User 2025 & 2033
- Figure 39: Middle East & Africa Virtual Assistant Services Revenue Share (%), by End User 2025 & 2033
- Figure 40: Middle East & Africa Virtual Assistant Services Revenue (million), by Country 2025 & 2033
- Figure 41: Middle East & Africa Virtual Assistant Services Revenue Share (%), by Country 2025 & 2033
- Figure 42: Asia Pacific Virtual Assistant Services Revenue (million), by Type 2025 & 2033
- Figure 43: Asia Pacific Virtual Assistant Services Revenue Share (%), by Type 2025 & 2033
- Figure 44: Asia Pacific Virtual Assistant Services Revenue (million), by Channel 2025 & 2033
- Figure 45: Asia Pacific Virtual Assistant Services Revenue Share (%), by Channel 2025 & 2033
- Figure 46: Asia Pacific Virtual Assistant Services Revenue (million), by Pricing 2025 & 2033
- Figure 47: Asia Pacific Virtual Assistant Services Revenue Share (%), by Pricing 2025 & 2033
- Figure 48: Asia Pacific Virtual Assistant Services Revenue (million), by End User 2025 & 2033
- Figure 49: Asia Pacific Virtual Assistant Services Revenue Share (%), by End User 2025 & 2033
- Figure 50: Asia Pacific Virtual Assistant Services Revenue (million), by Country 2025 & 2033
- Figure 51: Asia Pacific Virtual Assistant Services Revenue Share (%), by Country 2025 & 2033
List of Tables
- Table 1: Global Virtual Assistant Services Revenue million Forecast, by Type 2020 & 2033
- Table 2: Global Virtual Assistant Services Revenue million Forecast, by Channel 2020 & 2033
- Table 3: Global Virtual Assistant Services Revenue million Forecast, by Pricing 2020 & 2033
- Table 4: Global Virtual Assistant Services Revenue million Forecast, by End User 2020 & 2033
- Table 5: Global Virtual Assistant Services Revenue million Forecast, by Region 2020 & 2033
- Table 6: Global Virtual Assistant Services Revenue million Forecast, by Type 2020 & 2033
- Table 7: Global Virtual Assistant Services Revenue million Forecast, by Channel 2020 & 2033
- Table 8: Global Virtual Assistant Services Revenue million Forecast, by Pricing 2020 & 2033
- Table 9: Global Virtual Assistant Services Revenue million Forecast, by End User 2020 & 2033
- Table 10: Global Virtual Assistant Services Revenue million Forecast, by Country 2020 & 2033
- Table 11: United States Virtual Assistant Services Revenue (million) Forecast, by Application 2020 & 2033
- Table 12: Canada Virtual Assistant Services Revenue (million) Forecast, by Application 2020 & 2033
- Table 13: Mexico Virtual Assistant Services Revenue (million) Forecast, by Application 2020 & 2033
- Table 14: Global Virtual Assistant Services Revenue million Forecast, by Type 2020 & 2033
- Table 15: Global Virtual Assistant Services Revenue million Forecast, by Channel 2020 & 2033
- Table 16: Global Virtual Assistant Services Revenue million Forecast, by Pricing 2020 & 2033
- Table 17: Global Virtual Assistant Services Revenue million Forecast, by End User 2020 & 2033
- Table 18: Global Virtual Assistant Services Revenue million Forecast, by Country 2020 & 2033
- Table 19: Brazil Virtual Assistant Services Revenue (million) Forecast, by Application 2020 & 2033
- Table 20: Argentina Virtual Assistant Services Revenue (million) Forecast, by Application 2020 & 2033
- Table 21: Rest of South America Virtual Assistant Services Revenue (million) Forecast, by Application 2020 & 2033
- Table 22: Global Virtual Assistant Services Revenue million Forecast, by Type 2020 & 2033
- Table 23: Global Virtual Assistant Services Revenue million Forecast, by Channel 2020 & 2033
- Table 24: Global Virtual Assistant Services Revenue million Forecast, by Pricing 2020 & 2033
- Table 25: Global Virtual Assistant Services Revenue million Forecast, by End User 2020 & 2033
- Table 26: Global Virtual Assistant Services Revenue million Forecast, by Country 2020 & 2033
- Table 27: United Kingdom Virtual Assistant Services Revenue (million) Forecast, by Application 2020 & 2033
- Table 28: Germany Virtual Assistant Services Revenue (million) Forecast, by Application 2020 & 2033
- Table 29: France Virtual Assistant Services Revenue (million) Forecast, by Application 2020 & 2033
- Table 30: Italy Virtual Assistant Services Revenue (million) Forecast, by Application 2020 & 2033
- Table 31: Spain Virtual Assistant Services Revenue (million) Forecast, by Application 2020 & 2033
- Table 32: Russia Virtual Assistant Services Revenue (million) Forecast, by Application 2020 & 2033
- Table 33: Benelux Virtual Assistant Services Revenue (million) Forecast, by Application 2020 & 2033
- Table 34: Nordics Virtual Assistant Services Revenue (million) Forecast, by Application 2020 & 2033
- Table 35: Rest of Europe Virtual Assistant Services Revenue (million) Forecast, by Application 2020 & 2033
- Table 36: Global Virtual Assistant Services Revenue million Forecast, by Type 2020 & 2033
- Table 37: Global Virtual Assistant Services Revenue million Forecast, by Channel 2020 & 2033
- Table 38: Global Virtual Assistant Services Revenue million Forecast, by Pricing 2020 & 2033
- Table 39: Global Virtual Assistant Services Revenue million Forecast, by End User 2020 & 2033
- Table 40: Global Virtual Assistant Services Revenue million Forecast, by Country 2020 & 2033
- Table 41: Turkey Virtual Assistant Services Revenue (million) Forecast, by Application 2020 & 2033
- Table 42: Israel Virtual Assistant Services Revenue (million) Forecast, by Application 2020 & 2033
- Table 43: GCC Virtual Assistant Services Revenue (million) Forecast, by Application 2020 & 2033
- Table 44: North Africa Virtual Assistant Services Revenue (million) Forecast, by Application 2020 & 2033
- Table 45: South Africa Virtual Assistant Services Revenue (million) Forecast, by Application 2020 & 2033
- Table 46: Rest of Middle East & Africa Virtual Assistant Services Revenue (million) Forecast, by Application 2020 & 2033
- Table 47: Global Virtual Assistant Services Revenue million Forecast, by Type 2020 & 2033
- Table 48: Global Virtual Assistant Services Revenue million Forecast, by Channel 2020 & 2033
- Table 49: Global Virtual Assistant Services Revenue million Forecast, by Pricing 2020 & 2033
- Table 50: Global Virtual Assistant Services Revenue million Forecast, by End User 2020 & 2033
- Table 51: Global Virtual Assistant Services Revenue million Forecast, by Country 2020 & 2033
- Table 52: China Virtual Assistant Services Revenue (million) Forecast, by Application 2020 & 2033
- Table 53: India Virtual Assistant Services Revenue (million) Forecast, by Application 2020 & 2033
- Table 54: Japan Virtual Assistant Services Revenue (million) Forecast, by Application 2020 & 2033
- Table 55: South Korea Virtual Assistant Services Revenue (million) Forecast, by Application 2020 & 2033
- Table 56: ASEAN Virtual Assistant Services Revenue (million) Forecast, by Application 2020 & 2033
- Table 57: Oceania Virtual Assistant Services Revenue (million) Forecast, by Application 2020 & 2033
- Table 58: Rest of Asia Pacific Virtual Assistant Services Revenue (million) Forecast, by Application 2020 & 2033
Frequently Asked Questions
1. What is the projected Compound Annual Growth Rate (CAGR) of the Virtual Assistant Services?
The projected CAGR is approximately 6.1%.
2. Which companies are prominent players in the Virtual Assistant Services?
Key companies in the market include Virtalent, MyTasker, MyOutDesk, Belay Solutions, Okay Relax, WoodBows, Prialto, Fancy Hands, Time Etc, Magic, Upwork, Uassist.ME, Virtual Assistant Canada, Virtual Gurus, Pepper Virtual Assistant Services, CIBC, Valenta, Zirtual, Nuance, Fidelity, Others.
3. What are the main segments of the Virtual Assistant Services?
The market segments include Type, Channel, Pricing, End User.
4. Can you provide details about the market size?
The market size is estimated to be USD 2099 million as of 2022.
5. What are some drivers contributing to market growth?
N/A
6. What are the notable trends driving market growth?
N/A
7. Are there any restraints impacting market growth?
N/A
8. Can you provide examples of recent developments in the market?
N/A
9. What pricing options are available for accessing the report?
Pricing options include single-user, multi-user, and enterprise licenses priced at USD 2900.00, USD 4350.00, and USD 5800.00 respectively.
10. Is the market size provided in terms of value or volume?
The market size is provided in terms of value, measured in million.
11. Are there any specific market keywords associated with the report?
Yes, the market keyword associated with the report is "Virtual Assistant Services," which aids in identifying and referencing the specific market segment covered.
12. How do I determine which pricing option suits my needs best?
The pricing options vary based on user requirements and access needs. Individual users may opt for single-user licenses, while businesses requiring broader access may choose multi-user or enterprise licenses for cost-effective access to the report.
13. Are there any additional resources or data provided in the Virtual Assistant Services report?
While the report offers comprehensive insights, it's advisable to review the specific contents or supplementary materials provided to ascertain if additional resources or data are available.
14. How can I stay updated on further developments or reports in the Virtual Assistant Services?
To stay informed about further developments, trends, and reports in the Virtual Assistant Services, consider subscribing to industry newsletters, following relevant companies and organizations, or regularly checking reputable industry news sources and publications.
Methodology
Step 1 - Identification of Relevant Samples Size from Population Database


Step 2 - Approaches for Defining Global Market Size (Value, Volume* & Price*)

Note*: In applicable scenarios
Step 3 - Data Sources
Primary Research
- Web Analytics
- Survey Reports
- Research Institute
- Latest Research Reports
- Opinion Leaders
Secondary Research
- Annual Reports
- White Paper
- Latest Press Release
- Industry Association
- Paid Database
- Investor Presentations

Step 4 - Data Triangulation
Involves using different sources of information in order to increase the validity of a study
These sources are likely to be stakeholders in a program - participants, other researchers, program staff, other community members, and so on.
Then we put all data in single framework & apply various statistical tools to find out the dynamic on the market.
During the analysis stage, feedback from the stakeholder groups would be compared to determine areas of agreement as well as areas of divergence