


Key Insights
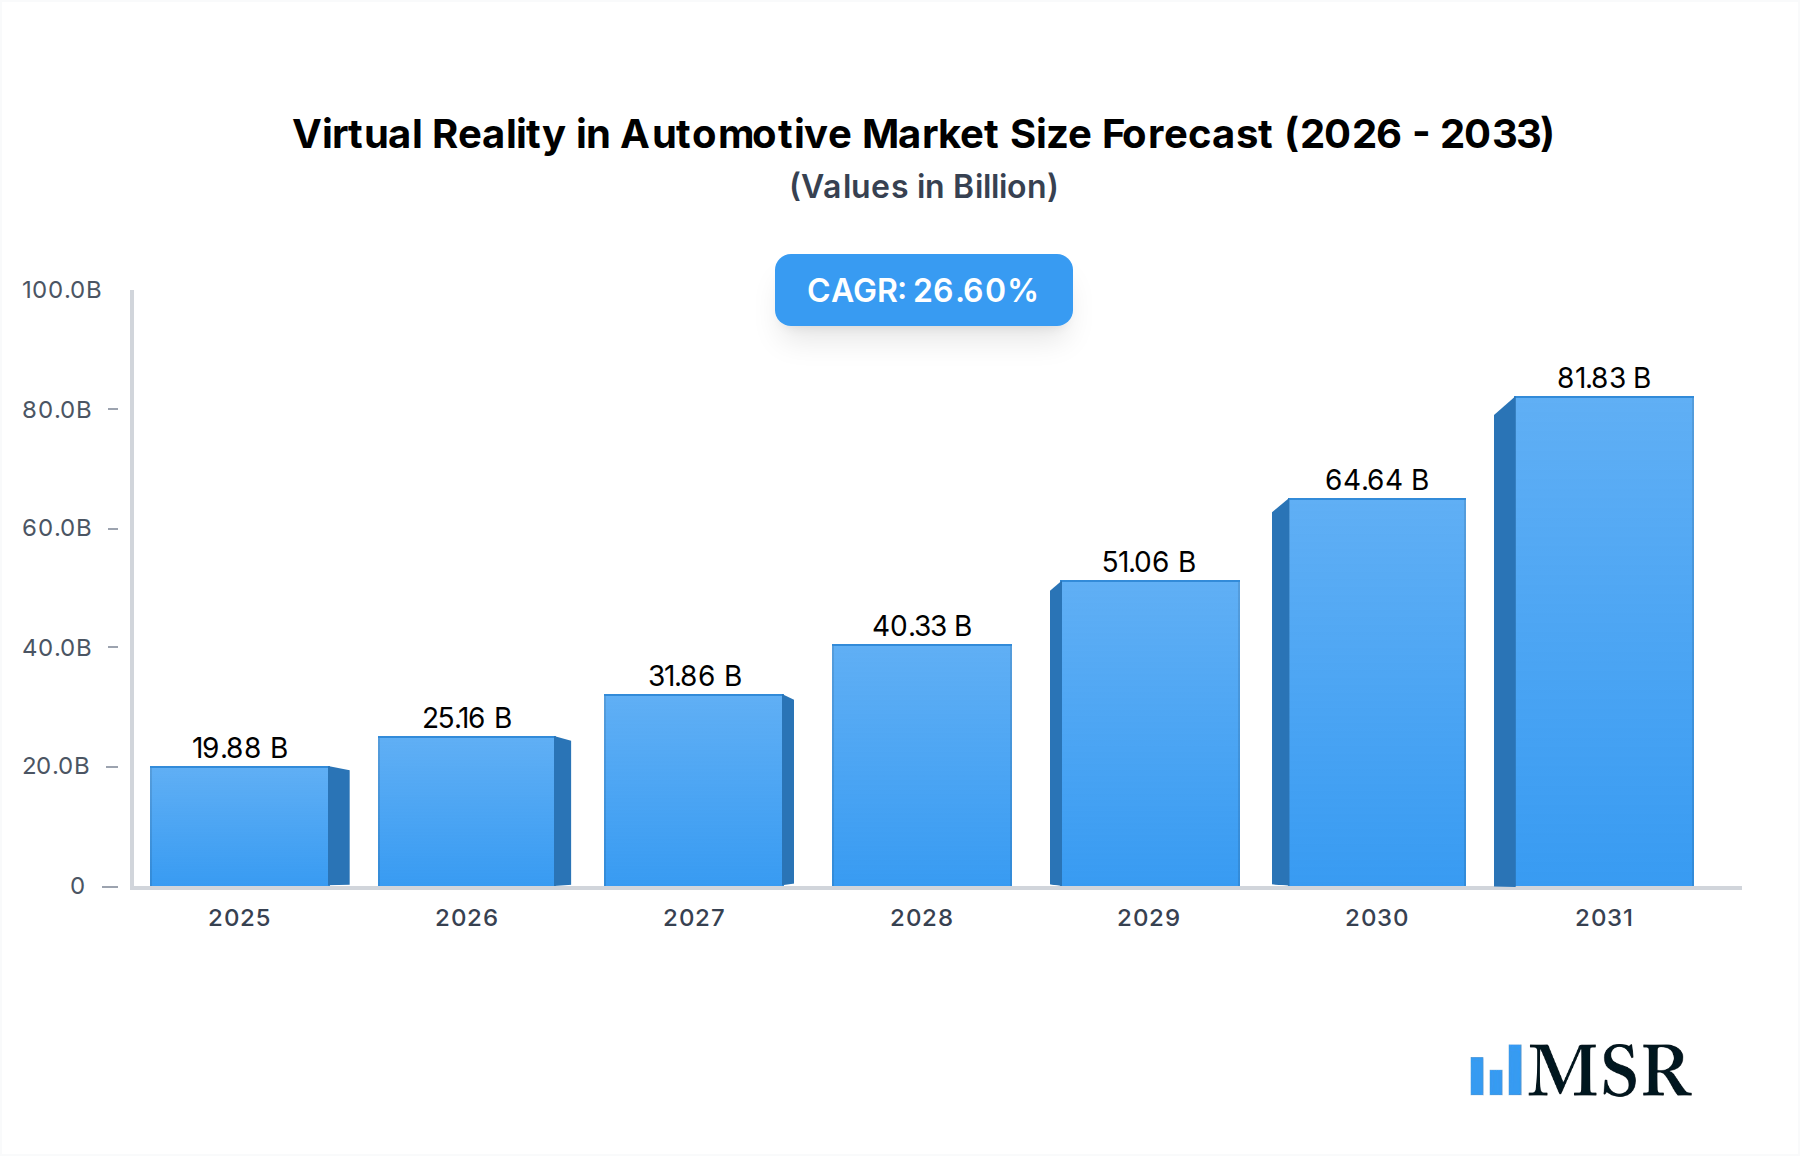
The Virtual Reality in Automotive Market is experiencing robust expansion, driven by the escalating demand for advanced visualization, simulation, and prototyping solutions across the automotive value chain. Valued at an estimated $15.7 billion in 2023, the market is poised for significant growth, projected to achieve a formidable Compound Annual Growth Rate (CAGR) of 26.6% over the forecast period. This rapid acceleration underscores the automotive industry's increasing reliance on immersive technologies to streamline design cycles, enhance engineering precision, and facilitate remote collaboration.
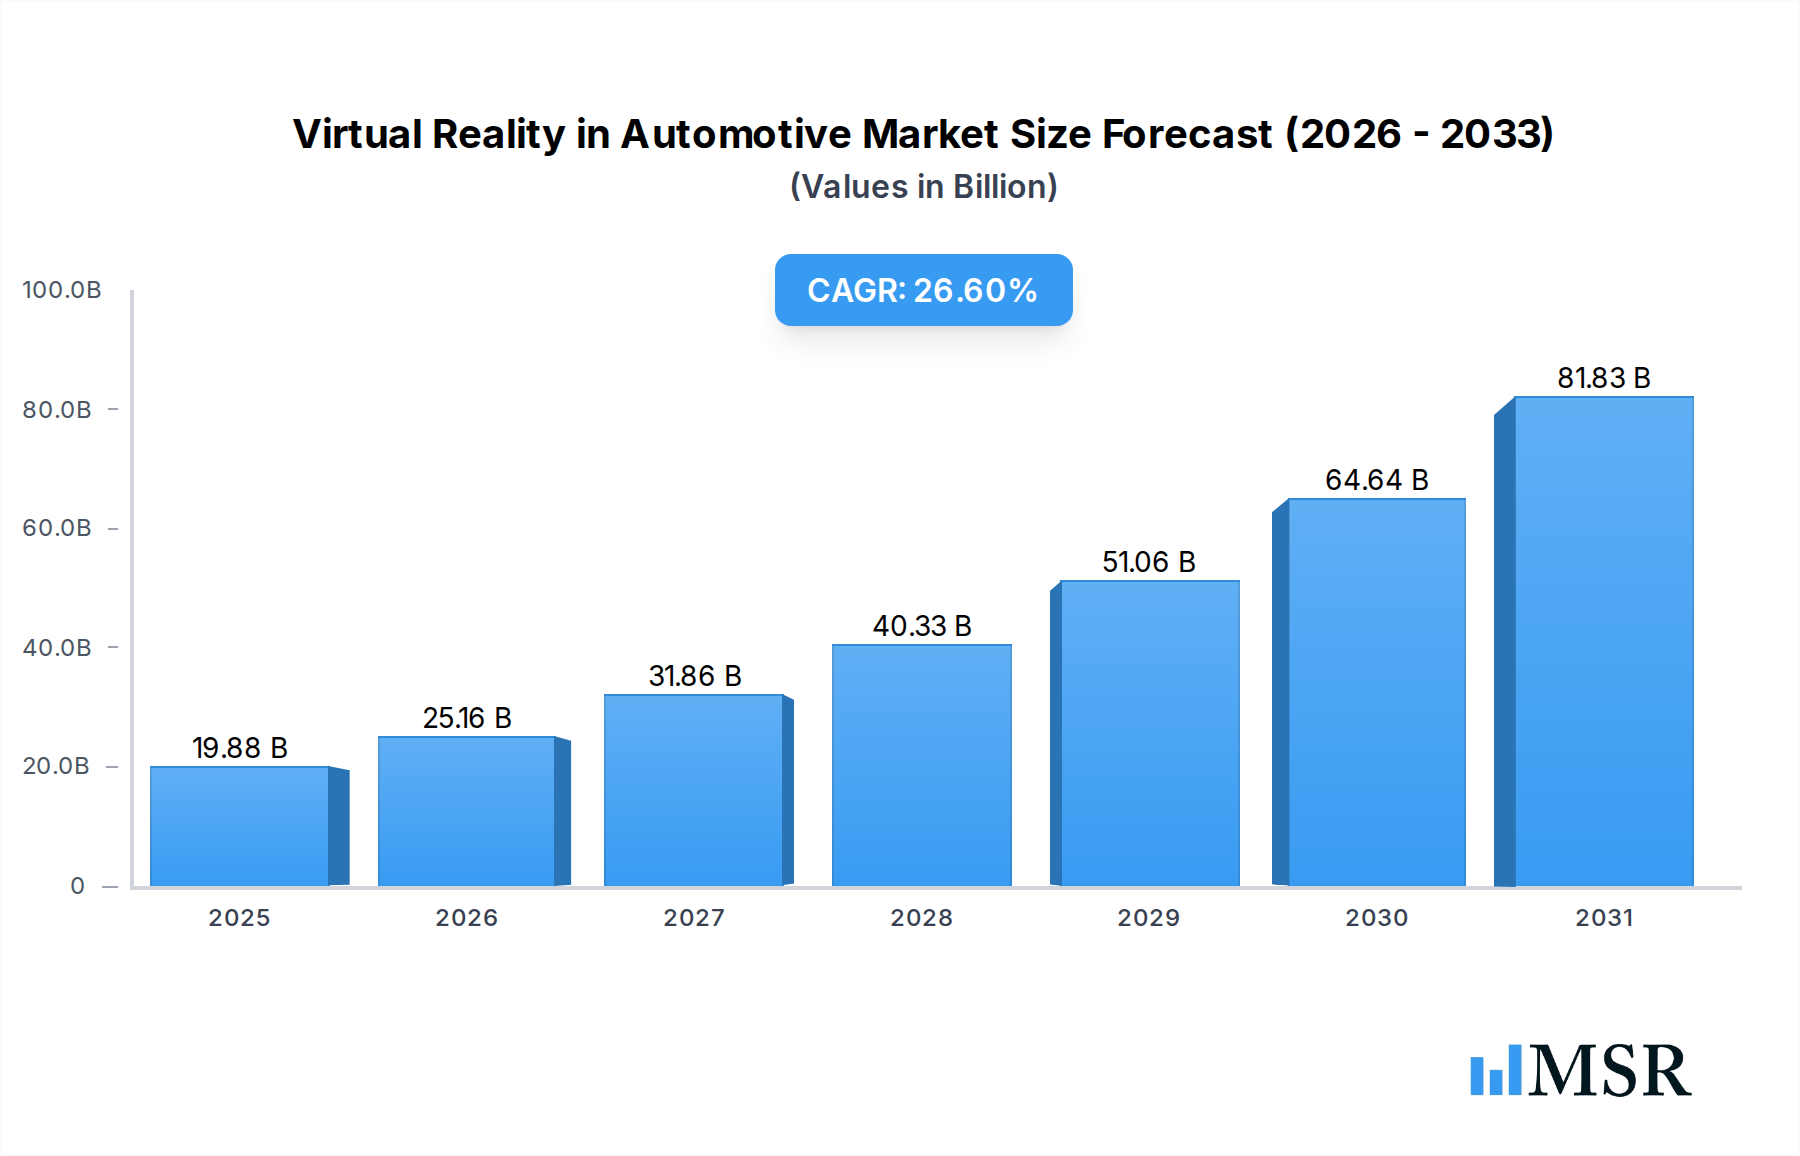
Virtual Reality in Automotive Market Size (In Billion)

Key demand drivers include the imperative for faster time-to-market, the need to manage increasing vehicle complexity, and the shift towards digital transformation initiatives among OEMs and Tier 1 suppliers. Virtual Reality (VR) applications are proving indispensable in areas such as design validation, virtual testing of components, assembly planning, and immersive training for manufacturing personnel. The technology facilitates early error detection, significantly reducing costs associated with physical prototypes and rework. Furthermore, the integration of VR with Artificial Intelligence (AI) and haptic feedback systems is opening new frontiers for realism and interactivity, deepening its utility in critical automotive processes.
Virtual Reality in Automotive Company Market Share
Macro tailwinds such as the global push for electric vehicles (EVs) and autonomous driving systems, which necessitate complex software and hardware integration, further fuel the adoption of VR solutions. The ability to simulate diverse driving conditions, user interfaces, and environmental interactions in a controlled, virtual environment is a critical enabler for innovation in these sectors. The competitive landscape is characterized by a blend of dedicated VR solution providers, established software giants, and automotive industry incumbents who are either developing in-house capabilities or forging strategic partnerships. This dynamic ecosystem continues to foster innovation, driving down the cost of entry for some applications while simultaneously pushing the boundaries of high-fidelity enterprise solutions. As the technology matures and becomes more accessible, its pervasive integration into every facet of the automotive lifecycle is expected to reshape traditional workflows, contributing significantly to the broader Automotive Technology Market.
Hardware Segment Dominance in Virtual Reality in Automotive Market
Within the Virtual Reality in Automotive Market, the Hardware segment is currently the most dominant in terms of revenue share, serving as the foundational layer for all immersive experiences. This segment encompasses a range of critical components including VR headsets (head-mounted displays), haptic devices, motion tracking systems, high-performance computing units, and specialized peripherals designed to facilitate interaction within virtual environments. The dominance of the Virtual Reality Hardware Market stems from the significant upfront investment required for high-fidelity, industrial-grade equipment necessary to meet the stringent demands of automotive design, engineering, and manufacturing. These demands include ultra-high resolution displays, precise tracking capabilities for intricate details, and robust construction suitable for continuous professional use.
Key players like NVIDIA, renowned for its powerful GPUs essential for rendering complex 3D models and simulations, and Meta Platforms, Inc., which offers a range of VR headsets, contribute substantially to this segment. Companies such as Vection Technologies Ltd. and XR Labs also play a role by integrating specialized hardware components into comprehensive VR solutions tailored for the automotive sector. The need for precise visual fidelity, low latency, and expansive field-of-view in applications like Automotive Design & Styling Market and Automotive Prototyping Market mandates the use of cutting-edge hardware. Without robust and reliable hardware, the effectiveness of even the most sophisticated Virtual Reality Software Market is severely limited.
The initial capital expenditure for setting up a comprehensive VR design studio or engineering simulation facility can be substantial, making the hardware component a major cost driver and thus a primary revenue generator within the market. As the technology evolves, there is a continuous push for lighter, more comfortable headsets with improved visual capabilities and advanced sensor integration. This constant innovation, while driving down unit costs in some consumer-grade segments, sustains high value in the enterprise space where performance and reliability are paramount. Furthermore, the integration with other automotive systems, such as the Automotive Sensor Market for real-time data input, ensures that the hardware component remains central to the evolution and continued growth of the Virtual Reality in Automotive Market. The demand for specialized haptic feedback devices to simulate tactile sensations during prototyping and assembly planning also reinforces the hardware segment's leading position, as these specialized tools are crucial for realistic interaction and validation in the Vehicle Engineering Market.
Key Market Drivers & Constraints in Virtual Reality in Automotive Market
The Virtual Reality in Automotive Market is propelled by several key drivers while simultaneously navigating distinct constraints. A primary driver is the demonstrable efficiency gains and cost reductions realized through virtual prototyping and simulation. Industry reports suggest that utilizing VR for design and engineering can reduce physical prototyping cycles by up to 50% and slash associated costs by 30-40%. This is particularly critical in the highly competitive automotive sector, where faster time-to-market is a significant advantage. The ability to iterate designs rapidly in a virtual environment before committing to expensive physical mock-ups dramatically streamlines the development process.
Another significant driver is the increasing complexity of modern vehicles, especially with the advent of electric vehicles (EVs) and advanced driver-assistance systems (ADAS). VR provides an unparalleled platform for visualizing intricate wiring harnesses, complex sensor arrays, and ergonomic layouts, aiding engineers in identifying potential clashes or inefficiencies early in the Vehicle Engineering Market phase. This advanced visualization can reduce design errors by an estimated 25-35%, minimizing costly rework in later stages. The demand for superior quality control and robust testing methodologies further elevates the role of VR in this context, aligning closely with the needs of the Automotive Simulation Market. Additionally, the need for enhanced global collaboration among geographically dispersed design and engineering teams fuels VR adoption, enabling real-time co-creation and review of 3D models, which can cut travel-related costs by 20%.
However, the market faces notable constraints. The high initial investment required for sophisticated VR hardware, specialized software licenses, and robust IT infrastructure presents a significant barrier, especially for smaller players. Enterprise-grade VR setups can range from $50,000 to $500,000, deterring some potential adopters. Furthermore, the scarcity of skilled VR developers and engineers who can integrate and customize these solutions within existing automotive workflows poses a challenge. The learning curve for new VR tools and platforms also requires substantial training investment. Lastly, persistent issues such as motion sickness, user discomfort during prolonged use, and the need for continuous technological advancements to achieve photorealism and seamless interaction can hinder widespread adoption, particularly in applications requiring extended immersive sessions.
Competitive Ecosystem of Virtual Reality in Automotive Market
The Virtual Reality in Automotive Market features a diverse array of companies, ranging from pure-play VR developers to established automotive giants integrating VR into their operations. This ecosystem is characterized by continuous innovation and strategic collaborations.
- Vection Technologies Ltd.: Specializes in extended reality (XR) solutions, offering integrated platforms that combine virtual, augmented, and mixed reality for enterprise clients, particularly in design and engineering applications within the automotive sector.
- Wear Studio: Focuses on creating immersive experiences and digital twins for industrial applications, helping automotive companies visualize and interact with complex designs and data in virtual environments.
- Unity Technologies: A leading provider of a real-time 3D development platform, widely adopted in the automotive industry for creating interactive prototypes, simulations, and visualizations across various VR applications.
- XR Labs: Delivers custom-built XR solutions for specific industrial challenges, including tailored VR applications for automotive training, manufacturing, and product development.
- NVIDIA: A dominant force in high-performance computing, providing essential GPU hardware and software platforms like NVIDIA Omniverse, which are critical for real-time 3D simulation and advanced VR rendering in automotive.
- Bosch GmbH: A global supplier of technology and services, leveraging VR for internal training, product development, and manufacturing process optimization within its vast automotive divisions.
- Meta Platforms, Inc.: While known for consumer VR, Meta is increasingly exploring enterprise applications, offering VR hardware (Quest line) and platforms that can be adapted for automotive design reviews and collaboration.
- Tecknotrove: Focuses on developing simulation and training solutions for various industries, including advanced VR-based simulators for driver training and equipment operation in the automotive and heavy commercial vehicle sectors.
- Volkswagen AG: A major automotive OEM, extensively utilizes VR across its brands for vehicle design, prototyping, factory planning, and employee training, showcasing a commitment to digital transformation.
- BMW M GmbH: The high-performance division of BMW, employs VR for driver simulation, performance vehicle development, and immersive brand experiences, pushing the boundaries of virtual interaction with its products.
- WayRay AG: Specializes in holographic augmented reality (AR) displays for cars, but its focus on immersive in-vehicle experiences demonstrates a broader trend towards integrating advanced visualization technologies relevant to the Virtual Reality in Automotive Market.
- Autodesk: A global leader in 3D design, engineering, and entertainment software, providing tools like VRED and Fusion 360 that are fundamental for creating the 3D models and environments used in automotive VR applications.
Recent Developments & Milestones in Virtual Reality in Automotive Market
Q4 2023: A significant partnership was announced between a prominent European OEM and a leading Virtual Reality Software Market provider to co-develop an advanced, cloud-based VR platform for collaborative vehicle design and engineering. This initiative aims to reduce concept-to-production timelines by integrating real-time feedback loops.
Q1 2024: A major hardware manufacturer unveiled a new generation of high-resolution, lightweight VR headsets specifically optimized for professional automotive use. These devices featured enhanced passthrough capabilities for mixed reality applications and improved ergonomic designs for extended use in the Automotive Design & Styling Market.
Q2 2024: An international industry consortium, including several major automotive manufacturers and tech companies, initiated a working group to establish open standards for VR content interoperability and data exchange formats. This effort seeks to facilitate seamless integration of different VR platforms and tools across the automotive value chain, impacting the Vehicle Engineering Market.
Q3 2024: A specialized startup secured a substantial Series B funding round to scale its development of ultra-realistic haptic feedback gloves and suits. These peripherals are designed to enhance the tactile fidelity of virtual Automotive Prototyping Market, allowing engineers to "feel" surfaces and resistance during virtual assembly tasks.
Q4 2024: A leading university research team, in collaboration with an OEM, published findings on the successful implementation of AI-driven adaptive VR environments for automotive training. This system dynamically adjusts simulation scenarios based on individual trainee performance, promising more personalized and effective learning experiences for complex assembly procedures and driver assistance system operation.
Regional Market Breakdown for Virtual Reality in Automotive Market
The global Virtual Reality in Automotive Market exhibits varied adoption patterns and growth trajectories across different regions, influenced by technological infrastructure, automotive manufacturing prowess, and investment in R&D.
North America holds a substantial revenue share in the Virtual Reality in Automotive Market, driven by the presence of major technology companies, significant investment in R&D, and early adoption of advanced digital solutions by leading OEMs and research centers. The United States, in particular, demonstrates strong traction due to a robust innovation ecosystem and substantial venture capital funding directed towards XR technologies. Adoption is high in Automotive Prototyping Market and advanced visualization.
Europe also commands a significant portion of the market, primarily fueled by automotive manufacturing powerhouses like Germany, France, and Italy. These nations have a long history of precision engineering and are increasingly integrating VR into their design, manufacturing, and quality control processes. The emphasis on sophisticated Vehicle Engineering Market solutions and the stringent regulatory environment for safety and emissions drive the demand for comprehensive virtual testing and simulation.
Asia Pacific is recognized as the fastest-growing region in the Virtual Reality in Automotive Market. Countries such as China, Japan, and South Korea are witnessing rapid adoption, propelled by massive investments in automotive manufacturing capabilities, digital transformation initiatives, and government support for technological innovation. China's burgeoning EV market and its ambition to lead in autonomous driving technology are particularly strong drivers for VR integration in design, simulation, and manufacturing planning. The growth here is also significantly impacting the broader Automotive Simulation Market as companies seek to validate new designs quickly.
While representing a smaller share, the Middle East & Africa and South America regions are emerging markets with increasing interest in VR solutions. Growth here is primarily driven by the expansion of local automotive manufacturing facilities and a desire to adopt modern production techniques to enhance efficiency and competitiveness. Although adoption rates are lower compared to more mature markets, the CAGR in select countries is expected to rise as infrastructure improves and awareness of VR's benefits propagates, albeit at a slower pace due to higher initial investment barriers.
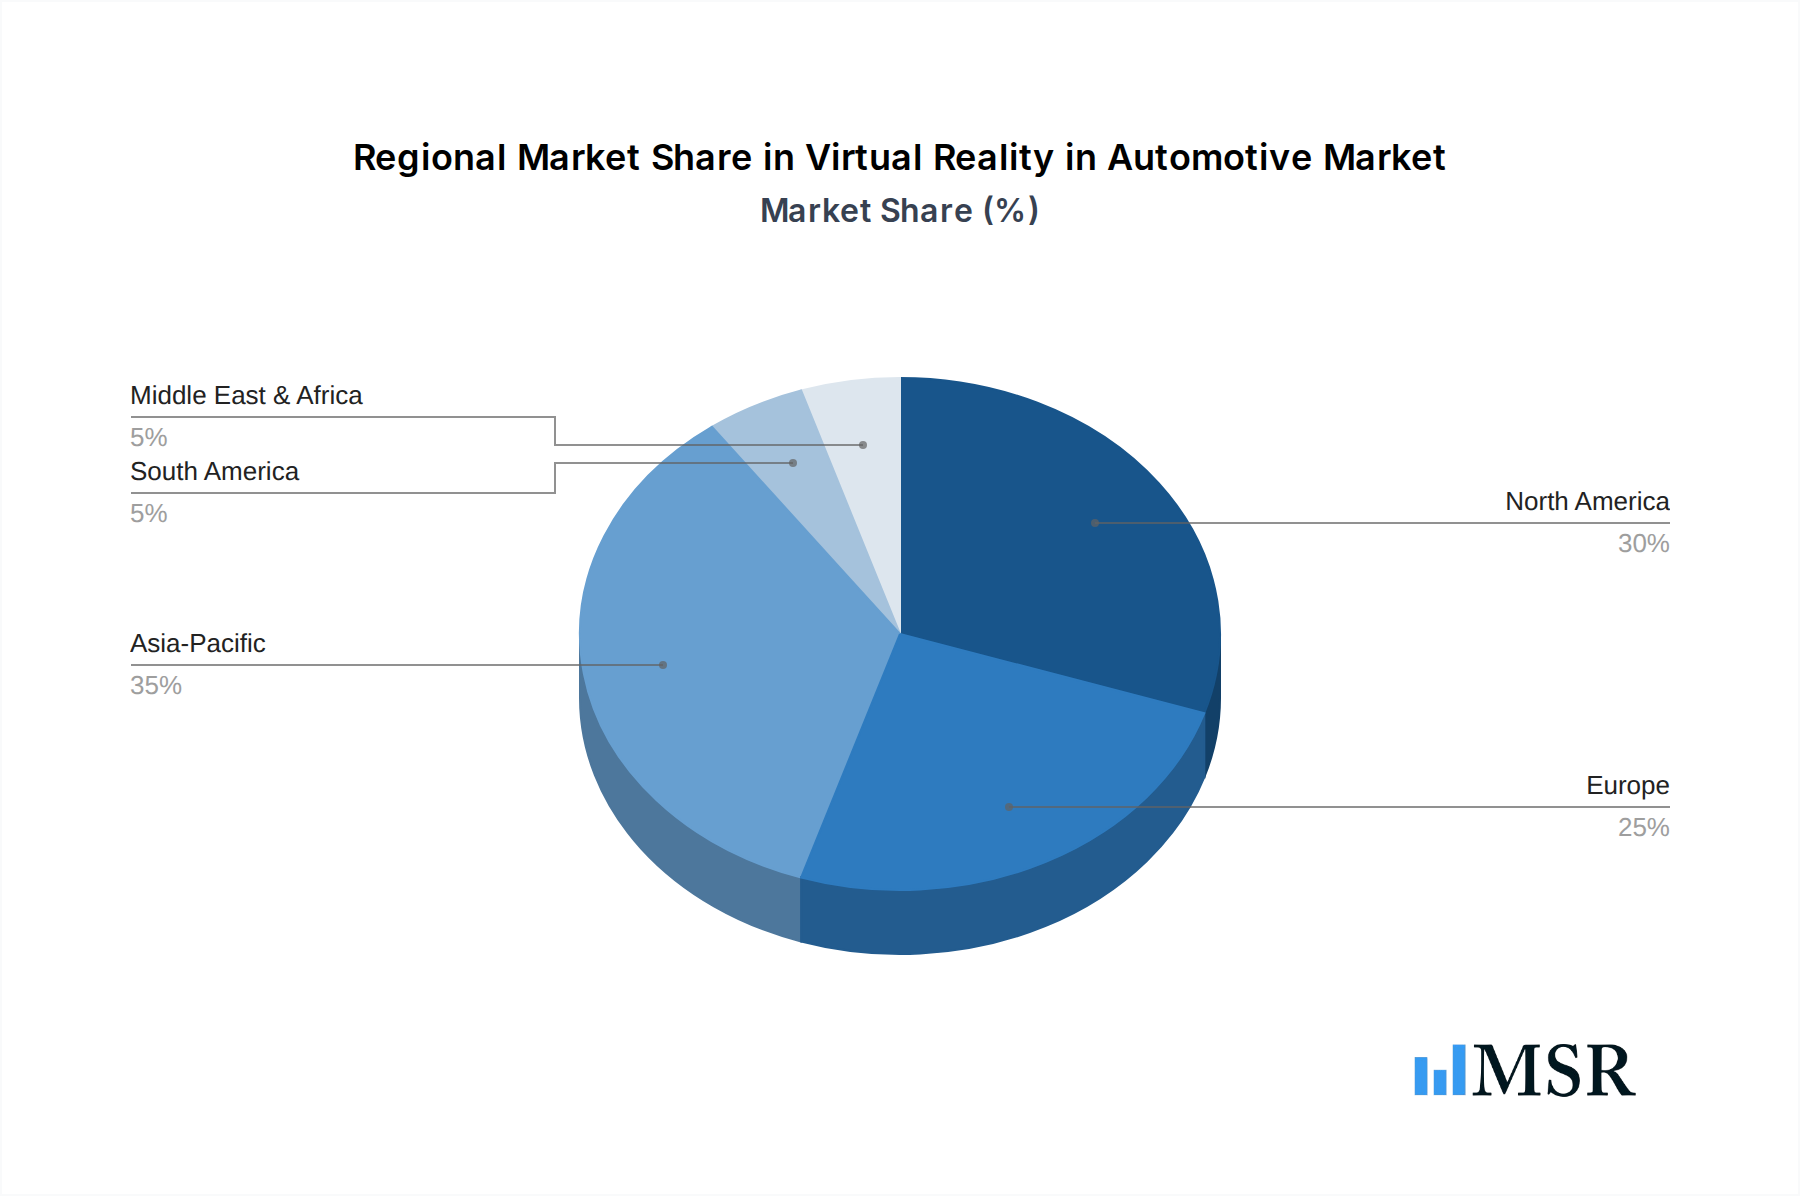
Virtual Reality in Automotive Regional Market Share
Pricing Dynamics & Margin Pressure in Virtual Reality in Automotive Market
The pricing dynamics within the Virtual Reality in Automotive Market are complex, influenced by the distinct cost structures of hardware, software, and services, alongside evolving competitive landscapes. In the Virtual Reality Hardware Market, average selling prices (ASPs) for consumer-grade devices have generally trended downwards, but high-fidelity, enterprise-grade VR headsets and peripherals specifically engineered for automotive applications (e.g., those requiring extreme precision, durability, and integration capabilities) maintain premium price points. These specialized hardware components are subject to margin pressures from component costs, particularly for high-resolution displays, advanced optics, and sophisticated sensor arrays. Companies like NVIDIA, while providing essential GPU hardware, also influence pricing for the underlying computational power required.
For the Virtual Reality Software Market, pricing models typically include perpetual licenses or, more commonly, subscription-based models. Enterprise software suites, offering comprehensive features for Automotive Design & Styling Market, Vehicle Engineering Market, and Automotive Prototyping Market, command substantial annual fees. Margin pressure in software is primarily driven by intense competition from alternative visualization tools, the continuous need for R&D to integrate new features (e.g., AI, cloud capabilities), and the cost of maintaining extensive customer support and customization services. The rise of open-source frameworks for certain VR components can also exert downward pressure on entry-level software pricing.
Services, including custom content development, system integration, training, and ongoing technical support, often represent the highest-margin segment. These services require specialized expertise, which limits commoditization. However, as more in-house teams develop VR capabilities, the demand for external integration services might stabilize. The competitive intensity, especially from the closely related Augmented Reality Market and Digital Twin Technology Market, necessitates that VR solution providers continually innovate and justify their value proposition, thereby influencing their pricing power. Commodity cycles for raw materials affecting electronic components can also indirectly impact the overall cost of VR solutions, although the high value-add of software and services often buffers these fluctuations.
Regulatory & Policy Landscape Shaping Virtual Reality in Automotive Market
The Virtual Reality in Automotive Market is increasingly shaped by an evolving tapestry of regulatory frameworks and policy initiatives across key geographies. Data privacy and security stand as paramount concerns, with regulations such as Europe's General Data Protection Regulation (GDPR) and California's Consumer Privacy Act (CCPA) influencing how user data, design iterations, and intellectual property within VR environments are collected, stored, and processed. As VR systems capture highly detailed interaction data, ensuring compliance with these stringent privacy mandates is critical, especially when simulating user experiences or internal corporate design reviews.
Safety standards are also gaining traction, particularly concerning the ergonomics and potential health impacts of extended VR use in industrial settings. Standards bodies are beginning to formulate guidelines for display flicker, motion sickness mitigation, and occupational health related to wearing head-mounted devices for prolonged periods. These regulations aim to protect workers engaged in tasks such as Automotive Prototyping Market or manufacturing assembly planning using VR.
Intellectual property (IP) protection is another significant area. As automotive designs, proprietary algorithms, and sensitive vehicle data are frequently visualized and manipulated within VR, robust legal frameworks are essential to prevent unauthorized access or replication. Policies are needed to clarify ownership and rights for digital assets created or modified within shared virtual spaces, particularly in collaborative multi-party projects relevant to the Vehicle Engineering Market. The increasing adoption of the Digital Twin Technology Market alongside VR amplifies these IP concerns.
Furthermore, government policies promoting digital transformation, industry 4.0, and advanced manufacturing can significantly accelerate VR adoption through grants, tax incentives, and research funding. Conversely, restrictive import tariffs on high-tech hardware or slow development of digital infrastructure in certain regions can act as impediments. Standardization efforts, such as OpenXR, driven by industry consortia, are crucial for ensuring interoperability across different VR platforms and hardware, thereby reducing fragmentation and fostering broader market growth, ultimately impacting the entire Virtual Reality Hardware Market and Virtual Reality Software Market landscape.
Virtual Reality in Automotive Segmentation
-
1. Offering
- 1.1. Hardware
- 1.2. Software
- 1.3. Service
-
2. Vehicle Type
- 2.1. Passenger Vehicles
- 2.2. Light Commercial Vehicles
- 2.3. Heavy Commercial Vehicles
-
3. Application
- 3.1. Design & Styling
- 3.2. Engineering & Simulation
- 3.3. Prototyping & Digital Mock-ups
- 3.4. Advanced Visualization
- 3.5. Manufacturing & Assembly Planning
- 3.6. Others
-
4. End User
- 4.1. OEMs
- 4.2. Tier 1 & Tier 2 Suppliers
- 4.3. Aftermarket & Service Providers
- 4.4. Research & Development Centers
- 4.5. Others
Virtual Reality in Automotive Segmentation By Geography
-
1. North America
- 1.1. United States
- 1.2. Canada
- 1.3. Mexico
-
2. South America
- 2.1. Brazil
- 2.2. Argentina
- 2.3. Rest of South America
-
3. Europe
- 3.1. United Kingdom
- 3.2. Germany
- 3.3. France
- 3.4. Italy
- 3.5. Spain
- 3.6. Russia
- 3.7. Benelux
- 3.8. Nordics
- 3.9. Rest of Europe
-
4. Middle East & Africa
- 4.1. Turkey
- 4.2. Israel
- 4.3. GCC
- 4.4. North Africa
- 4.5. South Africa
- 4.6. Rest of Middle East & Africa
-
5. Asia Pacific
- 5.1. China
- 5.2. India
- 5.3. Japan
- 5.4. South Korea
- 5.5. ASEAN
- 5.6. Oceania
- 5.7. Rest of Asia Pacific
Virtual Reality in Automotive Regional Market Share
Geographic Coverage of Virtual Reality in Automotive
Virtual Reality in Automotive REPORT HIGHLIGHTS
| Aspects | Details |
|---|---|
| Study Period | 2020-2034 |
| Base Year | 2025 |
| Estimated Year | 2026 |
| Forecast Period | 2026-2034 |
| Historical Period | 2020-2025 |
| Growth Rate | CAGR of 26.6% from 2020-2034 |
| Segmentation |
|
Table of Contents
- 1. Introduction
- 1.1. Research Scope
- 1.2. Market Segmentation
- 1.3. Research Objective
- 1.4. Definitions and Assumptions
- 2. Executive Summary
- 2.1. Market Snapshot
- 3. Market Dynamics
- 3.1. Market Drivers
- 3.2. Market Restrains
- 3.3. Market Trends
- 3.4. Market Opportunities
- 4. Market Factor Analysis
- 4.1. Porters Five Forces
- 4.1.1. Bargaining Power of Suppliers
- 4.1.2. Bargaining Power of Buyers
- 4.1.3. Threat of New Entrants
- 4.1.4. Threat of Substitutes
- 4.1.5. Competitive Rivalry
- 4.2. PESTEL analysis
- 4.3. BCG Analysis
- 4.3.1. Stars (High Growth, High Market Share)
- 4.3.2. Cash Cows (Low Growth, High Market Share)
- 4.3.3. Question Mark (High Growth, Low Market Share)
- 4.3.4. Dogs (Low Growth, Low Market Share)
- 4.4. Ansoff Matrix Analysis
- 4.5. Supply Chain Analysis
- 4.6. Regulatory Landscape
- 4.7. Current Market Potential and Opportunity Assessment (TAM–SAM–SOM Framework)
- 4.8. MSR Analyst Note
- 4.1. Porters Five Forces
- 5. Market Analysis, Insights and Forecast 2021-2033
- 5.1. Market Analysis, Insights and Forecast - by Offering
- 5.1.1. Hardware
- 5.1.2. Software
- 5.1.3. Service
- 5.2. Market Analysis, Insights and Forecast - by Vehicle Type
- 5.2.1. Passenger Vehicles
- 5.2.2. Light Commercial Vehicles
- 5.2.3. Heavy Commercial Vehicles
- 5.3. Market Analysis, Insights and Forecast - by Application
- 5.3.1. Design & Styling
- 5.3.2. Engineering & Simulation
- 5.3.3. Prototyping & Digital Mock-ups
- 5.3.4. Advanced Visualization
- 5.3.5. Manufacturing & Assembly Planning
- 5.3.6. Others
- 5.4. Market Analysis, Insights and Forecast - by End User
- 5.4.1. OEMs
- 5.4.2. Tier 1 & Tier 2 Suppliers
- 5.4.3. Aftermarket & Service Providers
- 5.4.4. Research & Development Centers
- 5.4.5. Others
- 5.5. Market Analysis, Insights and Forecast - by Region
- 5.5.1. North America
- 5.5.2. South America
- 5.5.3. Europe
- 5.5.4. Middle East & Africa
- 5.5.5. Asia Pacific
- 5.1. Market Analysis, Insights and Forecast - by Offering
- 6. Global Virtual Reality in Automotive Analysis, Insights and Forecast, 2021-2033
- 6.1. Market Analysis, Insights and Forecast - by Offering
- 6.1.1. Hardware
- 6.1.2. Software
- 6.1.3. Service
- 6.2. Market Analysis, Insights and Forecast - by Vehicle Type
- 6.2.1. Passenger Vehicles
- 6.2.2. Light Commercial Vehicles
- 6.2.3. Heavy Commercial Vehicles
- 6.3. Market Analysis, Insights and Forecast - by Application
- 6.3.1. Design & Styling
- 6.3.2. Engineering & Simulation
- 6.3.3. Prototyping & Digital Mock-ups
- 6.3.4. Advanced Visualization
- 6.3.5. Manufacturing & Assembly Planning
- 6.3.6. Others
- 6.4. Market Analysis, Insights and Forecast - by End User
- 6.4.1. OEMs
- 6.4.2. Tier 1 & Tier 2 Suppliers
- 6.4.3. Aftermarket & Service Providers
- 6.4.4. Research & Development Centers
- 6.4.5. Others
- 6.1. Market Analysis, Insights and Forecast - by Offering
- 7. North America Virtual Reality in Automotive Analysis, Insights and Forecast, 2020-2032
- 7.1. Market Analysis, Insights and Forecast - by Offering
- 7.1.1. Hardware
- 7.1.2. Software
- 7.1.3. Service
- 7.2. Market Analysis, Insights and Forecast - by Vehicle Type
- 7.2.1. Passenger Vehicles
- 7.2.2. Light Commercial Vehicles
- 7.2.3. Heavy Commercial Vehicles
- 7.3. Market Analysis, Insights and Forecast - by Application
- 7.3.1. Design & Styling
- 7.3.2. Engineering & Simulation
- 7.3.3. Prototyping & Digital Mock-ups
- 7.3.4. Advanced Visualization
- 7.3.5. Manufacturing & Assembly Planning
- 7.3.6. Others
- 7.4. Market Analysis, Insights and Forecast - by End User
- 7.4.1. OEMs
- 7.4.2. Tier 1 & Tier 2 Suppliers
- 7.4.3. Aftermarket & Service Providers
- 7.4.4. Research & Development Centers
- 7.4.5. Others
- 7.1. Market Analysis, Insights and Forecast - by Offering
- 8. South America Virtual Reality in Automotive Analysis, Insights and Forecast, 2020-2032
- 8.1. Market Analysis, Insights and Forecast - by Offering
- 8.1.1. Hardware
- 8.1.2. Software
- 8.1.3. Service
- 8.2. Market Analysis, Insights and Forecast - by Vehicle Type
- 8.2.1. Passenger Vehicles
- 8.2.2. Light Commercial Vehicles
- 8.2.3. Heavy Commercial Vehicles
- 8.3. Market Analysis, Insights and Forecast - by Application
- 8.3.1. Design & Styling
- 8.3.2. Engineering & Simulation
- 8.3.3. Prototyping & Digital Mock-ups
- 8.3.4. Advanced Visualization
- 8.3.5. Manufacturing & Assembly Planning
- 8.3.6. Others
- 8.4. Market Analysis, Insights and Forecast - by End User
- 8.4.1. OEMs
- 8.4.2. Tier 1 & Tier 2 Suppliers
- 8.4.3. Aftermarket & Service Providers
- 8.4.4. Research & Development Centers
- 8.4.5. Others
- 8.1. Market Analysis, Insights and Forecast - by Offering
- 9. Europe Virtual Reality in Automotive Analysis, Insights and Forecast, 2020-2032
- 9.1. Market Analysis, Insights and Forecast - by Offering
- 9.1.1. Hardware
- 9.1.2. Software
- 9.1.3. Service
- 9.2. Market Analysis, Insights and Forecast - by Vehicle Type
- 9.2.1. Passenger Vehicles
- 9.2.2. Light Commercial Vehicles
- 9.2.3. Heavy Commercial Vehicles
- 9.3. Market Analysis, Insights and Forecast - by Application
- 9.3.1. Design & Styling
- 9.3.2. Engineering & Simulation
- 9.3.3. Prototyping & Digital Mock-ups
- 9.3.4. Advanced Visualization
- 9.3.5. Manufacturing & Assembly Planning
- 9.3.6. Others
- 9.4. Market Analysis, Insights and Forecast - by End User
- 9.4.1. OEMs
- 9.4.2. Tier 1 & Tier 2 Suppliers
- 9.4.3. Aftermarket & Service Providers
- 9.4.4. Research & Development Centers
- 9.4.5. Others
- 9.1. Market Analysis, Insights and Forecast - by Offering
- 10. Middle East & Africa Virtual Reality in Automotive Analysis, Insights and Forecast, 2020-2032
- 10.1. Market Analysis, Insights and Forecast - by Offering
- 10.1.1. Hardware
- 10.1.2. Software
- 10.1.3. Service
- 10.2. Market Analysis, Insights and Forecast - by Vehicle Type
- 10.2.1. Passenger Vehicles
- 10.2.2. Light Commercial Vehicles
- 10.2.3. Heavy Commercial Vehicles
- 10.3. Market Analysis, Insights and Forecast - by Application
- 10.3.1. Design & Styling
- 10.3.2. Engineering & Simulation
- 10.3.3. Prototyping & Digital Mock-ups
- 10.3.4. Advanced Visualization
- 10.3.5. Manufacturing & Assembly Planning
- 10.3.6. Others
- 10.4. Market Analysis, Insights and Forecast - by End User
- 10.4.1. OEMs
- 10.4.2. Tier 1 & Tier 2 Suppliers
- 10.4.3. Aftermarket & Service Providers
- 10.4.4. Research & Development Centers
- 10.4.5. Others
- 10.1. Market Analysis, Insights and Forecast - by Offering
- 11. Asia Pacific Virtual Reality in Automotive Analysis, Insights and Forecast, 2020-2032
- 11.1. Market Analysis, Insights and Forecast - by Offering
- 11.1.1. Hardware
- 11.1.2. Software
- 11.1.3. Service
- 11.2. Market Analysis, Insights and Forecast - by Vehicle Type
- 11.2.1. Passenger Vehicles
- 11.2.2. Light Commercial Vehicles
- 11.2.3. Heavy Commercial Vehicles
- 11.3. Market Analysis, Insights and Forecast - by Application
- 11.3.1. Design & Styling
- 11.3.2. Engineering & Simulation
- 11.3.3. Prototyping & Digital Mock-ups
- 11.3.4. Advanced Visualization
- 11.3.5. Manufacturing & Assembly Planning
- 11.3.6. Others
- 11.4. Market Analysis, Insights and Forecast - by End User
- 11.4.1. OEMs
- 11.4.2. Tier 1 & Tier 2 Suppliers
- 11.4.3. Aftermarket & Service Providers
- 11.4.4. Research & Development Centers
- 11.4.5. Others
- 11.1. Market Analysis, Insights and Forecast - by Offering
- 12. Competitive Analysis
- 12.1. Company Profiles
- 12.1.1 Vection Technologies Ltd.
- 12.1.1.1. Company Overview
- 12.1.1.2. Products
- 12.1.1.3. Company Financials
- 12.1.1.4. SWOT Analysis
- 12.1.2 Wear Studio
- 12.1.2.1. Company Overview
- 12.1.2.2. Products
- 12.1.2.3. Company Financials
- 12.1.2.4. SWOT Analysis
- 12.1.3 Unity Technologies
- 12.1.3.1. Company Overview
- 12.1.3.2. Products
- 12.1.3.3. Company Financials
- 12.1.3.4. SWOT Analysis
- 12.1.4 XR Labs
- 12.1.4.1. Company Overview
- 12.1.4.2. Products
- 12.1.4.3. Company Financials
- 12.1.4.4. SWOT Analysis
- 12.1.5 NVIDIA
- 12.1.5.1. Company Overview
- 12.1.5.2. Products
- 12.1.5.3. Company Financials
- 12.1.5.4. SWOT Analysis
- 12.1.6 Bosch GmbH
- 12.1.6.1. Company Overview
- 12.1.6.2. Products
- 12.1.6.3. Company Financials
- 12.1.6.4. SWOT Analysis
- 12.1.7 Meta Platforms Inc.
- 12.1.7.1. Company Overview
- 12.1.7.2. Products
- 12.1.7.3. Company Financials
- 12.1.7.4. SWOT Analysis
- 12.1.8 Tecknotrove
- 12.1.8.1. Company Overview
- 12.1.8.2. Products
- 12.1.8.3. Company Financials
- 12.1.8.4. SWOT Analysis
- 12.1.9 Volkswagen AG
- 12.1.9.1. Company Overview
- 12.1.9.2. Products
- 12.1.9.3. Company Financials
- 12.1.9.4. SWOT Analysis
- 12.1.10 BMW M GmbH
- 12.1.10.1. Company Overview
- 12.1.10.2. Products
- 12.1.10.3. Company Financials
- 12.1.10.4. SWOT Analysis
- 12.1.11 WayRay AG
- 12.1.11.1. Company Overview
- 12.1.11.2. Products
- 12.1.11.3. Company Financials
- 12.1.11.4. SWOT Analysis
- 12.1.12 Autodesk
- 12.1.12.1. Company Overview
- 12.1.12.2. Products
- 12.1.12.3. Company Financials
- 12.1.12.4. SWOT Analysis
- 12.1.13 Others
- 12.1.13.1. Company Overview
- 12.1.13.2. Products
- 12.1.13.3. Company Financials
- 12.1.13.4. SWOT Analysis
- 12.1.1 Vection Technologies Ltd.
- 12.2. Market Entropy
- 12.2.1 Company's Key Areas Served
- 12.2.2 Recent Developments
- 12.3. Company Market Share Analysis 2025
- 12.3.1 Top 5 Companies Market Share Analysis
- 12.3.2 Top 3 Companies Market Share Analysis
- 12.4. List of Potential Customers
- 13. Research Methodology
List of Figures
- Figure 1: Global Virtual Reality in Automotive Revenue Breakdown (billion, %) by Region 2025 & 2033
- Figure 2: North America Virtual Reality in Automotive Revenue (billion), by Offering 2025 & 2033
- Figure 3: North America Virtual Reality in Automotive Revenue Share (%), by Offering 2025 & 2033
- Figure 4: North America Virtual Reality in Automotive Revenue (billion), by Vehicle Type 2025 & 2033
- Figure 5: North America Virtual Reality in Automotive Revenue Share (%), by Vehicle Type 2025 & 2033
- Figure 6: North America Virtual Reality in Automotive Revenue (billion), by Application 2025 & 2033
- Figure 7: North America Virtual Reality in Automotive Revenue Share (%), by Application 2025 & 2033
- Figure 8: North America Virtual Reality in Automotive Revenue (billion), by End User 2025 & 2033
- Figure 9: North America Virtual Reality in Automotive Revenue Share (%), by End User 2025 & 2033
- Figure 10: North America Virtual Reality in Automotive Revenue (billion), by Country 2025 & 2033
- Figure 11: North America Virtual Reality in Automotive Revenue Share (%), by Country 2025 & 2033
- Figure 12: South America Virtual Reality in Automotive Revenue (billion), by Offering 2025 & 2033
- Figure 13: South America Virtual Reality in Automotive Revenue Share (%), by Offering 2025 & 2033
- Figure 14: South America Virtual Reality in Automotive Revenue (billion), by Vehicle Type 2025 & 2033
- Figure 15: South America Virtual Reality in Automotive Revenue Share (%), by Vehicle Type 2025 & 2033
- Figure 16: South America Virtual Reality in Automotive Revenue (billion), by Application 2025 & 2033
- Figure 17: South America Virtual Reality in Automotive Revenue Share (%), by Application 2025 & 2033
- Figure 18: South America Virtual Reality in Automotive Revenue (billion), by End User 2025 & 2033
- Figure 19: South America Virtual Reality in Automotive Revenue Share (%), by End User 2025 & 2033
- Figure 20: South America Virtual Reality in Automotive Revenue (billion), by Country 2025 & 2033
- Figure 21: South America Virtual Reality in Automotive Revenue Share (%), by Country 2025 & 2033
- Figure 22: Europe Virtual Reality in Automotive Revenue (billion), by Offering 2025 & 2033
- Figure 23: Europe Virtual Reality in Automotive Revenue Share (%), by Offering 2025 & 2033
- Figure 24: Europe Virtual Reality in Automotive Revenue (billion), by Vehicle Type 2025 & 2033
- Figure 25: Europe Virtual Reality in Automotive Revenue Share (%), by Vehicle Type 2025 & 2033
- Figure 26: Europe Virtual Reality in Automotive Revenue (billion), by Application 2025 & 2033
- Figure 27: Europe Virtual Reality in Automotive Revenue Share (%), by Application 2025 & 2033
- Figure 28: Europe Virtual Reality in Automotive Revenue (billion), by End User 2025 & 2033
- Figure 29: Europe Virtual Reality in Automotive Revenue Share (%), by End User 2025 & 2033
- Figure 30: Europe Virtual Reality in Automotive Revenue (billion), by Country 2025 & 2033
- Figure 31: Europe Virtual Reality in Automotive Revenue Share (%), by Country 2025 & 2033
- Figure 32: Middle East & Africa Virtual Reality in Automotive Revenue (billion), by Offering 2025 & 2033
- Figure 33: Middle East & Africa Virtual Reality in Automotive Revenue Share (%), by Offering 2025 & 2033
- Figure 34: Middle East & Africa Virtual Reality in Automotive Revenue (billion), by Vehicle Type 2025 & 2033
- Figure 35: Middle East & Africa Virtual Reality in Automotive Revenue Share (%), by Vehicle Type 2025 & 2033
- Figure 36: Middle East & Africa Virtual Reality in Automotive Revenue (billion), by Application 2025 & 2033
- Figure 37: Middle East & Africa Virtual Reality in Automotive Revenue Share (%), by Application 2025 & 2033
- Figure 38: Middle East & Africa Virtual Reality in Automotive Revenue (billion), by End User 2025 & 2033
- Figure 39: Middle East & Africa Virtual Reality in Automotive Revenue Share (%), by End User 2025 & 2033
- Figure 40: Middle East & Africa Virtual Reality in Automotive Revenue (billion), by Country 2025 & 2033
- Figure 41: Middle East & Africa Virtual Reality in Automotive Revenue Share (%), by Country 2025 & 2033
- Figure 42: Asia Pacific Virtual Reality in Automotive Revenue (billion), by Offering 2025 & 2033
- Figure 43: Asia Pacific Virtual Reality in Automotive Revenue Share (%), by Offering 2025 & 2033
- Figure 44: Asia Pacific Virtual Reality in Automotive Revenue (billion), by Vehicle Type 2025 & 2033
- Figure 45: Asia Pacific Virtual Reality in Automotive Revenue Share (%), by Vehicle Type 2025 & 2033
- Figure 46: Asia Pacific Virtual Reality in Automotive Revenue (billion), by Application 2025 & 2033
- Figure 47: Asia Pacific Virtual Reality in Automotive Revenue Share (%), by Application 2025 & 2033
- Figure 48: Asia Pacific Virtual Reality in Automotive Revenue (billion), by End User 2025 & 2033
- Figure 49: Asia Pacific Virtual Reality in Automotive Revenue Share (%), by End User 2025 & 2033
- Figure 50: Asia Pacific Virtual Reality in Automotive Revenue (billion), by Country 2025 & 2033
- Figure 51: Asia Pacific Virtual Reality in Automotive Revenue Share (%), by Country 2025 & 2033
List of Tables
- Table 1: Global Virtual Reality in Automotive Revenue billion Forecast, by Offering 2020 & 2033
- Table 2: Global Virtual Reality in Automotive Revenue billion Forecast, by Vehicle Type 2020 & 2033
- Table 3: Global Virtual Reality in Automotive Revenue billion Forecast, by Application 2020 & 2033
- Table 4: Global Virtual Reality in Automotive Revenue billion Forecast, by End User 2020 & 2033
- Table 5: Global Virtual Reality in Automotive Revenue billion Forecast, by Region 2020 & 2033
- Table 6: Global Virtual Reality in Automotive Revenue billion Forecast, by Offering 2020 & 2033
- Table 7: Global Virtual Reality in Automotive Revenue billion Forecast, by Vehicle Type 2020 & 2033
- Table 8: Global Virtual Reality in Automotive Revenue billion Forecast, by Application 2020 & 2033
- Table 9: Global Virtual Reality in Automotive Revenue billion Forecast, by End User 2020 & 2033
- Table 10: Global Virtual Reality in Automotive Revenue billion Forecast, by Country 2020 & 2033
- Table 11: United States Virtual Reality in Automotive Revenue (billion) Forecast, by Application 2020 & 2033
- Table 12: Canada Virtual Reality in Automotive Revenue (billion) Forecast, by Application 2020 & 2033
- Table 13: Mexico Virtual Reality in Automotive Revenue (billion) Forecast, by Application 2020 & 2033
- Table 14: Global Virtual Reality in Automotive Revenue billion Forecast, by Offering 2020 & 2033
- Table 15: Global Virtual Reality in Automotive Revenue billion Forecast, by Vehicle Type 2020 & 2033
- Table 16: Global Virtual Reality in Automotive Revenue billion Forecast, by Application 2020 & 2033
- Table 17: Global Virtual Reality in Automotive Revenue billion Forecast, by End User 2020 & 2033
- Table 18: Global Virtual Reality in Automotive Revenue billion Forecast, by Country 2020 & 2033
- Table 19: Brazil Virtual Reality in Automotive Revenue (billion) Forecast, by Application 2020 & 2033
- Table 20: Argentina Virtual Reality in Automotive Revenue (billion) Forecast, by Application 2020 & 2033
- Table 21: Rest of South America Virtual Reality in Automotive Revenue (billion) Forecast, by Application 2020 & 2033
- Table 22: Global Virtual Reality in Automotive Revenue billion Forecast, by Offering 2020 & 2033
- Table 23: Global Virtual Reality in Automotive Revenue billion Forecast, by Vehicle Type 2020 & 2033
- Table 24: Global Virtual Reality in Automotive Revenue billion Forecast, by Application 2020 & 2033
- Table 25: Global Virtual Reality in Automotive Revenue billion Forecast, by End User 2020 & 2033
- Table 26: Global Virtual Reality in Automotive Revenue billion Forecast, by Country 2020 & 2033
- Table 27: United Kingdom Virtual Reality in Automotive Revenue (billion) Forecast, by Application 2020 & 2033
- Table 28: Germany Virtual Reality in Automotive Revenue (billion) Forecast, by Application 2020 & 2033
- Table 29: France Virtual Reality in Automotive Revenue (billion) Forecast, by Application 2020 & 2033
- Table 30: Italy Virtual Reality in Automotive Revenue (billion) Forecast, by Application 2020 & 2033
- Table 31: Spain Virtual Reality in Automotive Revenue (billion) Forecast, by Application 2020 & 2033
- Table 32: Russia Virtual Reality in Automotive Revenue (billion) Forecast, by Application 2020 & 2033
- Table 33: Benelux Virtual Reality in Automotive Revenue (billion) Forecast, by Application 2020 & 2033
- Table 34: Nordics Virtual Reality in Automotive Revenue (billion) Forecast, by Application 2020 & 2033
- Table 35: Rest of Europe Virtual Reality in Automotive Revenue (billion) Forecast, by Application 2020 & 2033
- Table 36: Global Virtual Reality in Automotive Revenue billion Forecast, by Offering 2020 & 2033
- Table 37: Global Virtual Reality in Automotive Revenue billion Forecast, by Vehicle Type 2020 & 2033
- Table 38: Global Virtual Reality in Automotive Revenue billion Forecast, by Application 2020 & 2033
- Table 39: Global Virtual Reality in Automotive Revenue billion Forecast, by End User 2020 & 2033
- Table 40: Global Virtual Reality in Automotive Revenue billion Forecast, by Country 2020 & 2033
- Table 41: Turkey Virtual Reality in Automotive Revenue (billion) Forecast, by Application 2020 & 2033
- Table 42: Israel Virtual Reality in Automotive Revenue (billion) Forecast, by Application 2020 & 2033
- Table 43: GCC Virtual Reality in Automotive Revenue (billion) Forecast, by Application 2020 & 2033
- Table 44: North Africa Virtual Reality in Automotive Revenue (billion) Forecast, by Application 2020 & 2033
- Table 45: South Africa Virtual Reality in Automotive Revenue (billion) Forecast, by Application 2020 & 2033
- Table 46: Rest of Middle East & Africa Virtual Reality in Automotive Revenue (billion) Forecast, by Application 2020 & 2033
- Table 47: Global Virtual Reality in Automotive Revenue billion Forecast, by Offering 2020 & 2033
- Table 48: Global Virtual Reality in Automotive Revenue billion Forecast, by Vehicle Type 2020 & 2033
- Table 49: Global Virtual Reality in Automotive Revenue billion Forecast, by Application 2020 & 2033
- Table 50: Global Virtual Reality in Automotive Revenue billion Forecast, by End User 2020 & 2033
- Table 51: Global Virtual Reality in Automotive Revenue billion Forecast, by Country 2020 & 2033
- Table 52: China Virtual Reality in Automotive Revenue (billion) Forecast, by Application 2020 & 2033
- Table 53: India Virtual Reality in Automotive Revenue (billion) Forecast, by Application 2020 & 2033
- Table 54: Japan Virtual Reality in Automotive Revenue (billion) Forecast, by Application 2020 & 2033
- Table 55: South Korea Virtual Reality in Automotive Revenue (billion) Forecast, by Application 2020 & 2033
- Table 56: ASEAN Virtual Reality in Automotive Revenue (billion) Forecast, by Application 2020 & 2033
- Table 57: Oceania Virtual Reality in Automotive Revenue (billion) Forecast, by Application 2020 & 2033
- Table 58: Rest of Asia Pacific Virtual Reality in Automotive Revenue (billion) Forecast, by Application 2020 & 2033
Frequently Asked Questions
1. What is the projected Compound Annual Growth Rate (CAGR) of the Virtual Reality in Automotive?
The projected CAGR is approximately 26.6%.
2. Which companies are prominent players in the Virtual Reality in Automotive?
Key companies in the market include Vection Technologies Ltd., Wear Studio, Unity Technologies, XR Labs, NVIDIA, Bosch GmbH, Meta Platforms, Inc., Tecknotrove, Volkswagen AG, BMW M GmbH, WayRay AG, Autodesk, Others.
3. What are the main segments of the Virtual Reality in Automotive?
The market segments include Offering, Vehicle Type, Application, End User.
4. Can you provide details about the market size?
The market size is estimated to be USD 15.7 billion as of 2022.
5. What are some drivers contributing to market growth?
N/A
6. What are the notable trends driving market growth?
N/A
7. Are there any restraints impacting market growth?
N/A
8. Can you provide examples of recent developments in the market?
N/A
9. What pricing options are available for accessing the report?
Pricing options include single-user, multi-user, and enterprise licenses priced at USD 4900.00, USD 7350.00, and USD 9800.00 respectively.
10. Is the market size provided in terms of value or volume?
The market size is provided in terms of value, measured in billion.
11. Are there any specific market keywords associated with the report?
Yes, the market keyword associated with the report is "Virtual Reality in Automotive," which aids in identifying and referencing the specific market segment covered.
12. How do I determine which pricing option suits my needs best?
The pricing options vary based on user requirements and access needs. Individual users may opt for single-user licenses, while businesses requiring broader access may choose multi-user or enterprise licenses for cost-effective access to the report.
13. Are there any additional resources or data provided in the Virtual Reality in Automotive report?
While the report offers comprehensive insights, it's advisable to review the specific contents or supplementary materials provided to ascertain if additional resources or data are available.
14. How can I stay updated on further developments or reports in the Virtual Reality in Automotive?
To stay informed about further developments, trends, and reports in the Virtual Reality in Automotive, consider subscribing to industry newsletters, following relevant companies and organizations, or regularly checking reputable industry news sources and publications.
Methodology
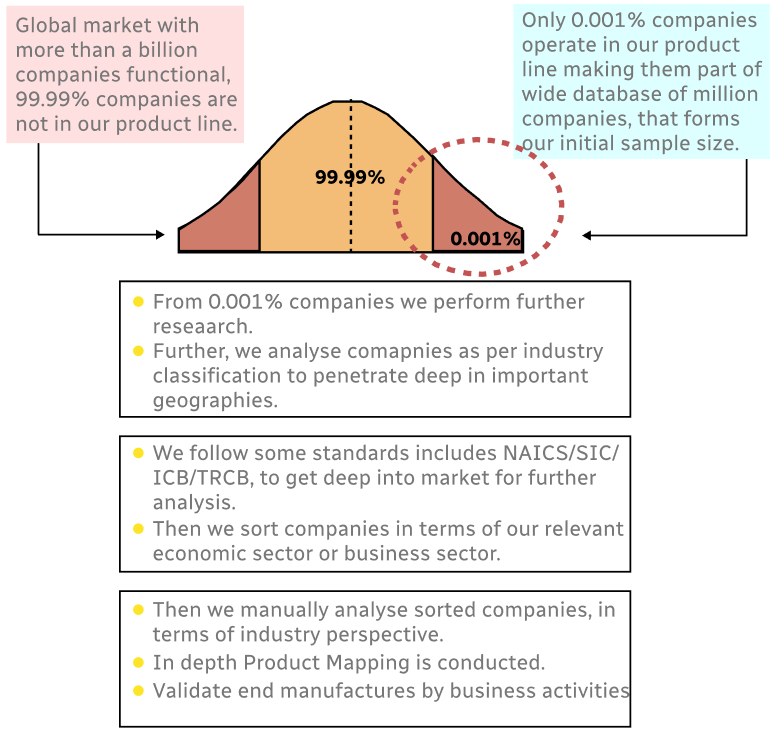
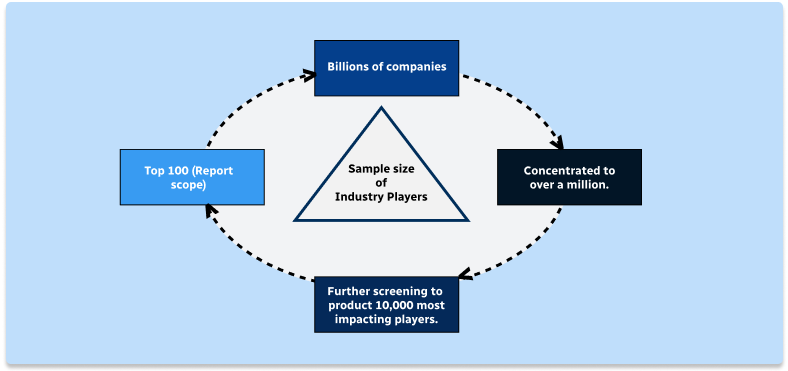
Step 1 - Identification of Relevant Samples Size from Population Database
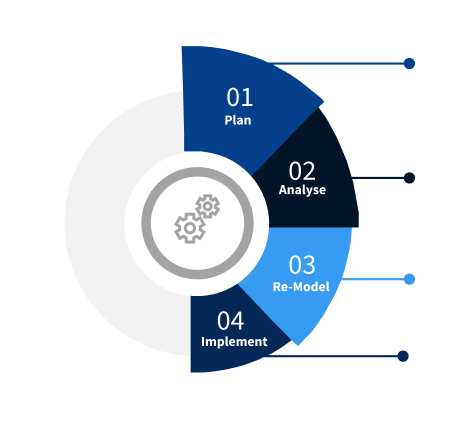
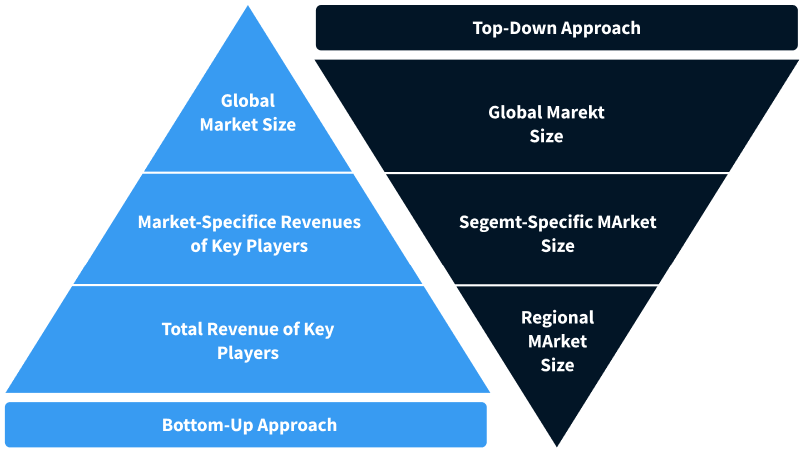
Step 2 - Approaches for Defining Global Market Size (Value, Volume* & Price*)
Note*: In applicable scenarios
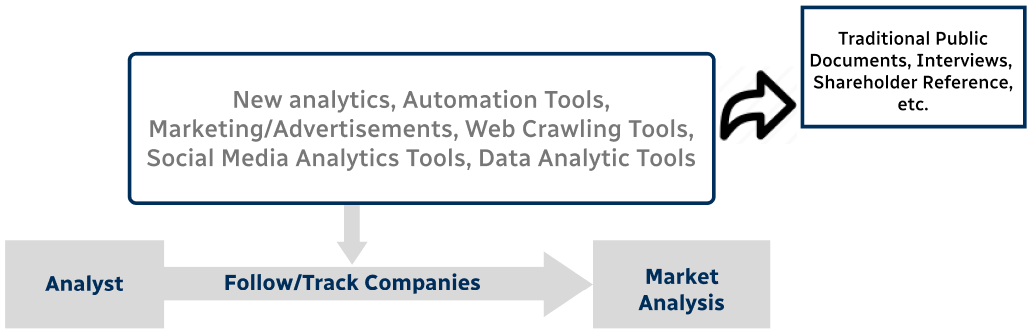
Step 3 - Data Sources
Primary Research
- Web Analytics
- Survey Reports
- Research Institute
- Latest Research Reports
- Opinion Leaders
Secondary Research
- Annual Reports
- White Paper
- Latest Press Release
- Industry Association
- Paid Database
- Investor Presentations
Step 4 - Data Triangulation
Involves using different sources of information in order to increase the validity of a study
These sources are likely to be stakeholders in a program - participants, other researchers, program staff, other community members, and so on.
Then we put all data in single framework & apply various statistical tools to find out the dynamic on the market.
During the analysis stage, feedback from the stakeholder groups would be compared to determine areas of agreement as well as areas of divergence