

Key Insights
The global antimony market, projected to reach $2.5 billion by 2033, is set for robust expansion with a Compound Annual Growth Rate (CAGR) of 6% from 2025. This growth trajectory is primarily fueled by escalating demand in critical applications including flame retardants, advanced battery technologies, and high-performance alloys. The burgeoning electronics and renewable energy sectors are significant drivers, capitalizing on antimony's inherent properties for enhanced fire safety and energy storage solutions. Key market challenges include raw material price volatility, stringent environmental regulations governing antimony extraction and processing, and the potential for material substitution. Addressing these necessitates a commitment to sustainable mining practices, pioneering recycling technologies, and developing novel high-value applications to secure long-term market viability.
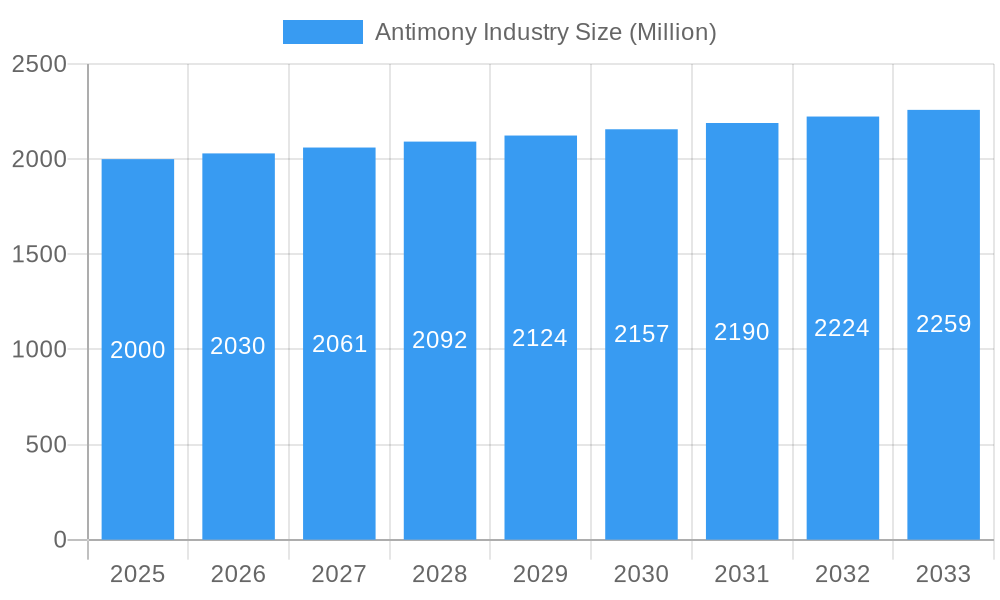
Antimony Industry Market Size (In Billion)
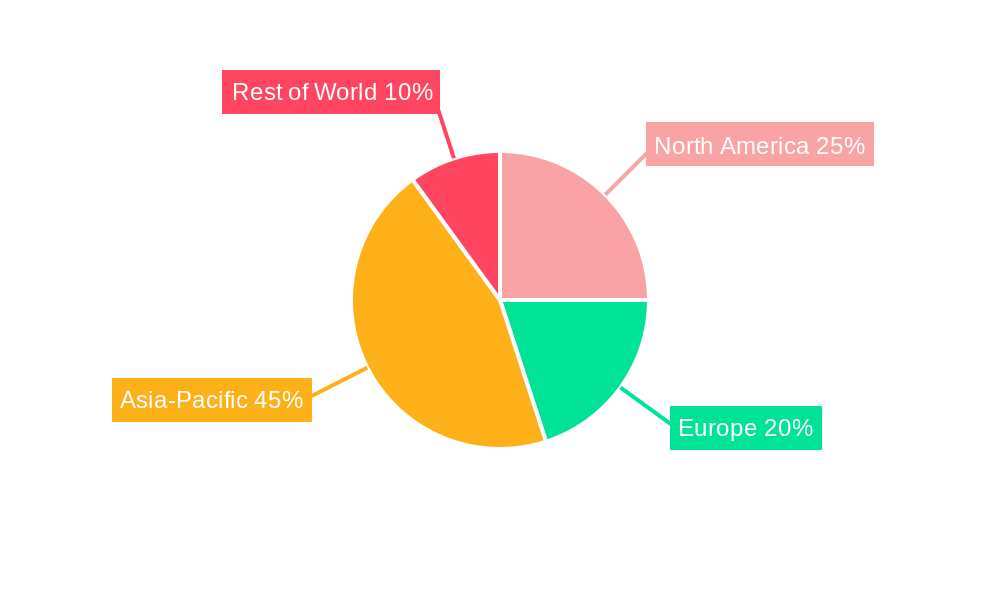
The competitive arena features established global entities and specialized regional manufacturers. Strategic alliances, advancements in extraction and processing technologies, and expansion into emerging markets are pivotal for maintaining a competitive advantage. Market segmentation is anticipated to encompass various antimony compounds (e.g., trioxide, metal) and diverse applications. Regional demand patterns and regulatory landscapes will significantly influence market dynamics, with the Asia-Pacific region expected to lead consumption, driven by its prominent electronics manufacturing base and other industrial sectors. Future growth will be contingent upon effectively mitigating environmental concerns and leveraging the expanding demand from the electric vehicle and renewable energy industries. The forecast period of 2025-2033 presents significant opportunities and strategic imperatives for market participants.
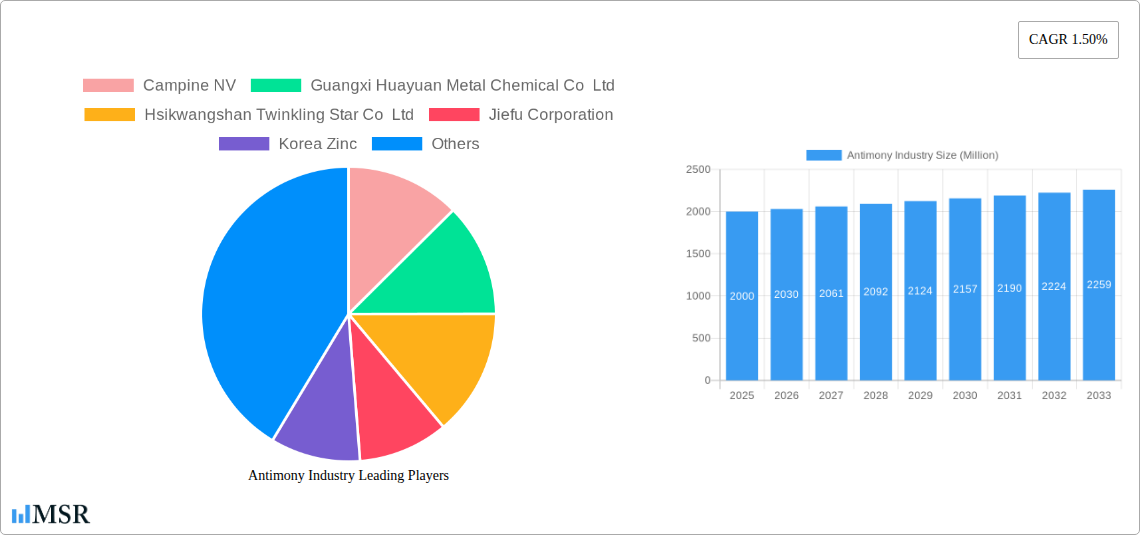
Antimony Industry Company Market Share
Antimony Industry Market Report: 2019-2033 Forecast
Dive deep into the lucrative Antimony Industry with our comprehensive market analysis, projecting a robust growth trajectory from 2019 to 2033. This in-depth report provides a 360° view of the antimony market, covering market dynamics, key segments, leading players, and emerging opportunities. Understand the current landscape and anticipate future trends to gain a competitive edge. This report is crucial for industry stakeholders, investors, and strategic decision-makers seeking to navigate this dynamic market. The study period spans 2019-2033, with a base year of 2025 and a forecast period of 2025-2033.
Antimony Industry Market Concentration & Dynamics
The global antimony market, valued at xx Million in 2025, exhibits a moderately concentrated structure. Key players such as Campine NV, Guangxi Huayuan Metal Chemical Co Ltd, Hsikwangshan Twinkling Star Co Ltd, Jiefu Corporation, Korea Zinc, Lambert Metals International Limited, Mandalay Resources, Nihon Seiko Co Ltd, Suzuhiro Chemical Co Ltd, United States Antimony Corporation, Yiyang City Huachang Antimony Industry Co Ltd, and Yunnan Muli Antimony Industry Co Ltd hold significant market share, though the exact percentages vary across segments. The market is influenced by several dynamic factors:
- Innovation Ecosystems: Ongoing research into new antimony applications and extraction techniques drives innovation.
- Regulatory Frameworks: Environmental regulations concerning antimony mining and processing impact production costs and market dynamics. Stringent regulations in certain regions may lead to shifting production patterns.
- Substitute Products: The availability of substitute materials in specific applications influences market demand.
- End-User Trends: The growth of specific end-use industries like flame retardants and batteries significantly affects antimony demand.
- M&A Activities: The number of mergers and acquisitions in the antimony industry has been relatively low (xx deals in the past 5 years), indicating a degree of market consolidation.
Market share dynamics are heavily influenced by production capacity, technological advancements, and access to raw materials. The report provides detailed analysis of these factors.
Antimony Industry Industry Insights & Trends
The global antimony market is projected to experience a CAGR of xx% during the forecast period (2025-2033), reaching a projected value of xx Million by 2033. This growth is driven by several key factors:
- Rising Demand from Battery Industry: The increasing adoption of electric vehicles and energy storage systems fuels demand for antimony-based battery materials.
- Growth in Electronics Sector: The expanding electronics industry requires antimony for various applications in semiconductors and other components.
- Technological Disruptions: Advances in antimony extraction techniques and improved material efficiency influence market dynamics.
- Evolving Consumer Behaviors: Increased awareness of environmental concerns and the need for sustainable materials could lead to shifts in demand for antimony-based products.
However, the market's growth is also subject to fluctuating commodity prices, geopolitical factors, and competition from alternative materials. Detailed analysis of market size and growth trajectory for different segments is included in the complete report.
Key Markets & Segments Leading Antimony Industry
The report identifies [Region/Country Name] as the dominant market for antimony, driven by:
- Robust Economic Growth: Strong economic growth in this region fosters increased demand across various sectors.
- Developing Infrastructure: Significant investments in infrastructure projects, particularly in [Specific Sector], further drive antimony demand.
- Favorable Government Policies: Supportive government policies and incentives for the antimony industry contribute to its growth.
Other significant markets include [Region/Country Name 2] and [Region/Country Name 3]. A detailed breakdown of regional and segmental performance, including market size and growth forecasts, is presented in the full report.
Antimony Industry Product Developments
Recent innovations focus on improving the efficiency of antimony extraction, developing new alloys with enhanced properties, and exploring novel applications. These developments aim to enhance the performance of antimony-based products and create new market opportunities. This includes research into more eco-friendly production methods and exploration of new applications, particularly in renewable energy technologies.
Challenges in the Antimony Industry Market
The antimony industry faces several challenges:
- Price Volatility: Fluctuations in antimony prices due to supply-demand imbalances and geopolitical factors affect profitability.
- Supply Chain Disruptions: Geopolitical instability and disruptions in global supply chains can impact the availability of antimony.
- Environmental Regulations: Stringent environmental regulations increase production costs and limit expansion opportunities.
- Competition from Substitutes: The availability of substitute materials poses a threat to antimony market share in certain applications.
Forces Driving Antimony Industry Growth
Several factors drive long-term growth in the antimony market:
- Technological Advancements: Innovations in antimony extraction and processing technologies improve efficiency and reduce costs.
- Economic Growth in Emerging Markets: Strong economic growth in developing countries boosts demand for antimony-based products.
- Government Support: Government policies promoting the use of antimony in strategic industries further stimulate market growth.
Long-Term Growth Catalysts in the Antimony Industry
Long-term growth is expected to be fueled by continued research and development into new antimony applications, particularly in renewable energy technologies and advanced electronics. Strategic partnerships and collaborations between industry players will play a significant role in driving market expansion and technological innovation.
Emerging Opportunities in Antimony Industry
Emerging opportunities lie in the development of high-performance antimony-based alloys for specialized applications, expansion into new markets with strong growth potential (e.g., renewable energy), and the development of sustainable and environmentally friendly antimony extraction and processing techniques.
Leading Players in the Antimony Industry Sector
- Campine NV
- Guangxi Huayuan Metal Chemical Co Ltd
- Hsikwangshan Twinkling Star Co Ltd
- Jiefu Corporation
- Korea Zinc
- Lambert Metals International Limited
- Mandalay Resources
- Nihon Seiko Co Ltd
- Suzuhiro Chemical Co Ltd
- United States Antimony Corporation
- Yiyang City Huachang Antimony Industry Co Ltd
- Yunnan Muli Antimony Industry Co Ltd
Key Milestones in Antimony Industry Industry
- [Year]: [Company Name] launched a new antimony-based product for [Application].
- [Year]: [Company Name] announced a major expansion of its antimony mining operations.
- [Year]: [Company Name] and [Company Name] formed a strategic partnership to develop new antimony technologies.
- (Further milestones will be detailed in the full report)
Strategic Outlook for Antimony Industry Market
The antimony market presents significant growth potential driven by increasing demand from key end-use sectors and technological advancements. Strategic opportunities exist for companies focusing on innovation, efficient supply chain management, and sustainable production practices. This report provides the insights necessary for companies to formulate effective strategies for capitalizing on these opportunities.
Antimony Industry Segmentation
-
1. Type
- 1.1. Metal Ingot
- 1.2. Antimony Trioxide
- 1.3. Antimony Pentoxide
- 1.4. Alloys
- 1.5. Other Types
-
2. Application
- 2.1. Flame Retardants
- 2.2. Batteries
- 2.3. Ceramics and Glass
- 2.4. Catalyst
- 2.5. Other Applications
Antimony Industry Segmentation By Geography
- 1. Other Countries
- 2. China
- 3. India
- 4. Japan
- 5. South Korea
-
6. Rest of Asia Pacific
- 6.1. North America
- 7. United States
- 8. Canada
-
9. Mexico
- 9.1. Europe
- 10. Germany
- 11. United Kingdom
- 12. Italy
- 13. France
-
14. Rest of Europe
- 14.1. South America
- 15. Brazil
- 16. Argentina
-
17. Rest of South America
- 17.1. Middle East and Africa
- 18. Saudi Arabia
- 19. South Africa
- 20. Rest of Middle East and Africa
Antimony Industry Regional Market Share
Geographic Coverage of Antimony Industry
Antimony Industry REPORT HIGHLIGHTS
| Aspects | Details |
|---|---|
| Study Period | 2020-2034 |
| Base Year | 2025 |
| Estimated Year | 2026 |
| Forecast Period | 2026-2034 |
| Historical Period | 2020-2025 |
| Growth Rate | CAGR of 6% from 2020-2034 |
| Segmentation |
|
Table of Contents
- 1. Introduction
- 1.1. Research Scope
- 1.2. Market Segmentation
- 1.3. Research Objective
- 1.4. Definitions and Assumptions
- 2. Executive Summary
- 2.1. Market Snapshot
- 3. Market Dynamics
- 3.1. Market Drivers
- 3.2. Market Restrains
- 3.3. Market Trends
- 3.4. Market Opportunities
- 4. Market Factor Analysis
- 4.1. Porters Five Forces
- 4.1.1. Bargaining Power of Suppliers
- 4.1.2. Bargaining Power of Buyers
- 4.1.3. Threat of New Entrants
- 4.1.4. Threat of Substitutes
- 4.1.5. Competitive Rivalry
- 4.2. PESTEL analysis
- 4.3. BCG Analysis
- 4.3.1. Stars (High Growth, High Market Share)
- 4.3.2. Cash Cows (Low Growth, High Market Share)
- 4.3.3. Question Mark (High Growth, Low Market Share)
- 4.3.4. Dogs (Low Growth, Low Market Share)
- 4.4. Ansoff Matrix Analysis
- 4.5. Supply Chain Analysis
- 4.6. Regulatory Landscape
- 4.7. Current Market Potential and Opportunity Assessment (TAM–SAM–SOM Framework)
- 4.8. MSR Analyst Note
- 4.1. Porters Five Forces
- 5. Market Analysis, Insights and Forecast 2021-2033
- 5.1. Market Analysis, Insights and Forecast - by Type
- 5.1.1. Metal Ingot
- 5.1.2. Antimony Trioxide
- 5.1.3. Antimony Pentoxide
- 5.1.4. Alloys
- 5.1.5. Other Types
- 5.2. Market Analysis, Insights and Forecast - by Application
- 5.2.1. Flame Retardants
- 5.2.2. Batteries
- 5.2.3. Ceramics and Glass
- 5.2.4. Catalyst
- 5.2.5. Other Applications
- 5.3. Market Analysis, Insights and Forecast - by Region
- 5.3.1. Other Countries
- 5.3.2. China
- 5.3.3. India
- 5.3.4. Japan
- 5.3.5. South Korea
- 5.3.6. Rest of Asia Pacific
- 5.3.7. United States
- 5.3.8. Canada
- 5.3.9. Mexico
- 5.3.10. Germany
- 5.3.11. United Kingdom
- 5.3.12. Italy
- 5.3.13. France
- 5.3.14. Rest of Europe
- 5.3.15. Brazil
- 5.3.16. Argentina
- 5.3.17. Rest of South America
- 5.3.18. Saudi Arabia
- 5.3.19. South Africa
- 5.3.20. Rest of Middle East and Africa
- 5.1. Market Analysis, Insights and Forecast - by Type
- 6. Global Antimony Industry Analysis, Insights and Forecast, 2021-2033
- 6.1. Market Analysis, Insights and Forecast - by Type
- 6.1.1. Metal Ingot
- 6.1.2. Antimony Trioxide
- 6.1.3. Antimony Pentoxide
- 6.1.4. Alloys
- 6.1.5. Other Types
- 6.2. Market Analysis, Insights and Forecast - by Application
- 6.2.1. Flame Retardants
- 6.2.2. Batteries
- 6.2.3. Ceramics and Glass
- 6.2.4. Catalyst
- 6.2.5. Other Applications
- 6.1. Market Analysis, Insights and Forecast - by Type
- 7. Other Countries Antimony Industry Analysis, Insights and Forecast, 2020-2032
- 7.1. Market Analysis, Insights and Forecast - by Type
- 7.1.1. Metal Ingot
- 7.1.2. Antimony Trioxide
- 7.1.3. Antimony Pentoxide
- 7.1.4. Alloys
- 7.1.5. Other Types
- 7.2. Market Analysis, Insights and Forecast - by Application
- 7.2.1. Flame Retardants
- 7.2.2. Batteries
- 7.2.3. Ceramics and Glass
- 7.2.4. Catalyst
- 7.2.5. Other Applications
- 7.1. Market Analysis, Insights and Forecast - by Type
- 8. China Antimony Industry Analysis, Insights and Forecast, 2020-2032
- 8.1. Market Analysis, Insights and Forecast - by Type
- 8.1.1. Metal Ingot
- 8.1.2. Antimony Trioxide
- 8.1.3. Antimony Pentoxide
- 8.1.4. Alloys
- 8.1.5. Other Types
- 8.2. Market Analysis, Insights and Forecast - by Application
- 8.2.1. Flame Retardants
- 8.2.2. Batteries
- 8.2.3. Ceramics and Glass
- 8.2.4. Catalyst
- 8.2.5. Other Applications
- 8.1. Market Analysis, Insights and Forecast - by Type
- 9. India Antimony Industry Analysis, Insights and Forecast, 2020-2032
- 9.1. Market Analysis, Insights and Forecast - by Type
- 9.1.1. Metal Ingot
- 9.1.2. Antimony Trioxide
- 9.1.3. Antimony Pentoxide
- 9.1.4. Alloys
- 9.1.5. Other Types
- 9.2. Market Analysis, Insights and Forecast - by Application
- 9.2.1. Flame Retardants
- 9.2.2. Batteries
- 9.2.3. Ceramics and Glass
- 9.2.4. Catalyst
- 9.2.5. Other Applications
- 9.1. Market Analysis, Insights and Forecast - by Type
- 10. Japan Antimony Industry Analysis, Insights and Forecast, 2020-2032
- 10.1. Market Analysis, Insights and Forecast - by Type
- 10.1.1. Metal Ingot
- 10.1.2. Antimony Trioxide
- 10.1.3. Antimony Pentoxide
- 10.1.4. Alloys
- 10.1.5. Other Types
- 10.2. Market Analysis, Insights and Forecast - by Application
- 10.2.1. Flame Retardants
- 10.2.2. Batteries
- 10.2.3. Ceramics and Glass
- 10.2.4. Catalyst
- 10.2.5. Other Applications
- 10.1. Market Analysis, Insights and Forecast - by Type
- 11. South Korea Antimony Industry Analysis, Insights and Forecast, 2020-2032
- 11.1. Market Analysis, Insights and Forecast - by Type
- 11.1.1. Metal Ingot
- 11.1.2. Antimony Trioxide
- 11.1.3. Antimony Pentoxide
- 11.1.4. Alloys
- 11.1.5. Other Types
- 11.2. Market Analysis, Insights and Forecast - by Application
- 11.2.1. Flame Retardants
- 11.2.2. Batteries
- 11.2.3. Ceramics and Glass
- 11.2.4. Catalyst
- 11.2.5. Other Applications
- 11.1. Market Analysis, Insights and Forecast - by Type
- 12. Rest of Asia Pacific Antimony Industry Analysis, Insights and Forecast, 2020-2032
- 12.1. Market Analysis, Insights and Forecast - by Type
- 12.1.1. Metal Ingot
- 12.1.2. Antimony Trioxide
- 12.1.3. Antimony Pentoxide
- 12.1.4. Alloys
- 12.1.5. Other Types
- 12.2. Market Analysis, Insights and Forecast - by Application
- 12.2.1. Flame Retardants
- 12.2.2. Batteries
- 12.2.3. Ceramics and Glass
- 12.2.4. Catalyst
- 12.2.5. Other Applications
- 12.1. Market Analysis, Insights and Forecast - by Type
- 13. United States Antimony Industry Analysis, Insights and Forecast, 2020-2032
- 13.1. Market Analysis, Insights and Forecast - by Type
- 13.1.1. Metal Ingot
- 13.1.2. Antimony Trioxide
- 13.1.3. Antimony Pentoxide
- 13.1.4. Alloys
- 13.1.5. Other Types
- 13.2. Market Analysis, Insights and Forecast - by Application
- 13.2.1. Flame Retardants
- 13.2.2. Batteries
- 13.2.3. Ceramics and Glass
- 13.2.4. Catalyst
- 13.2.5. Other Applications
- 13.1. Market Analysis, Insights and Forecast - by Type
- 14. Canada Antimony Industry Analysis, Insights and Forecast, 2020-2032
- 14.1. Market Analysis, Insights and Forecast - by Type
- 14.1.1. Metal Ingot
- 14.1.2. Antimony Trioxide
- 14.1.3. Antimony Pentoxide
- 14.1.4. Alloys
- 14.1.5. Other Types
- 14.2. Market Analysis, Insights and Forecast - by Application
- 14.2.1. Flame Retardants
- 14.2.2. Batteries
- 14.2.3. Ceramics and Glass
- 14.2.4. Catalyst
- 14.2.5. Other Applications
- 14.1. Market Analysis, Insights and Forecast - by Type
- 15. Mexico Antimony Industry Analysis, Insights and Forecast, 2020-2032
- 15.1. Market Analysis, Insights and Forecast - by Type
- 15.1.1. Metal Ingot
- 15.1.2. Antimony Trioxide
- 15.1.3. Antimony Pentoxide
- 15.1.4. Alloys
- 15.1.5. Other Types
- 15.2. Market Analysis, Insights and Forecast - by Application
- 15.2.1. Flame Retardants
- 15.2.2. Batteries
- 15.2.3. Ceramics and Glass
- 15.2.4. Catalyst
- 15.2.5. Other Applications
- 15.1. Market Analysis, Insights and Forecast - by Type
- 16. Germany Antimony Industry Analysis, Insights and Forecast, 2020-2032
- 16.1. Market Analysis, Insights and Forecast - by Type
- 16.1.1. Metal Ingot
- 16.1.2. Antimony Trioxide
- 16.1.3. Antimony Pentoxide
- 16.1.4. Alloys
- 16.1.5. Other Types
- 16.2. Market Analysis, Insights and Forecast - by Application
- 16.2.1. Flame Retardants
- 16.2.2. Batteries
- 16.2.3. Ceramics and Glass
- 16.2.4. Catalyst
- 16.2.5. Other Applications
- 16.1. Market Analysis, Insights and Forecast - by Type
- 17. United Kingdom Antimony Industry Analysis, Insights and Forecast, 2020-2032
- 17.1. Market Analysis, Insights and Forecast - by Type
- 17.1.1. Metal Ingot
- 17.1.2. Antimony Trioxide
- 17.1.3. Antimony Pentoxide
- 17.1.4. Alloys
- 17.1.5. Other Types
- 17.2. Market Analysis, Insights and Forecast - by Application
- 17.2.1. Flame Retardants
- 17.2.2. Batteries
- 17.2.3. Ceramics and Glass
- 17.2.4. Catalyst
- 17.2.5. Other Applications
- 17.1. Market Analysis, Insights and Forecast - by Type
- 18. Italy Antimony Industry Analysis, Insights and Forecast, 2020-2032
- 18.1. Market Analysis, Insights and Forecast - by Type
- 18.1.1. Metal Ingot
- 18.1.2. Antimony Trioxide
- 18.1.3. Antimony Pentoxide
- 18.1.4. Alloys
- 18.1.5. Other Types
- 18.2. Market Analysis, Insights and Forecast - by Application
- 18.2.1. Flame Retardants
- 18.2.2. Batteries
- 18.2.3. Ceramics and Glass
- 18.2.4. Catalyst
- 18.2.5. Other Applications
- 18.1. Market Analysis, Insights and Forecast - by Type
- 19. France Antimony Industry Analysis, Insights and Forecast, 2020-2032
- 19.1. Market Analysis, Insights and Forecast - by Type
- 19.1.1. Metal Ingot
- 19.1.2. Antimony Trioxide
- 19.1.3. Antimony Pentoxide
- 19.1.4. Alloys
- 19.1.5. Other Types
- 19.2. Market Analysis, Insights and Forecast - by Application
- 19.2.1. Flame Retardants
- 19.2.2. Batteries
- 19.2.3. Ceramics and Glass
- 19.2.4. Catalyst
- 19.2.5. Other Applications
- 19.1. Market Analysis, Insights and Forecast - by Type
- 20. Rest of Europe Antimony Industry Analysis, Insights and Forecast, 2020-2032
- 20.1. Market Analysis, Insights and Forecast - by Type
- 20.1.1. Metal Ingot
- 20.1.2. Antimony Trioxide
- 20.1.3. Antimony Pentoxide
- 20.1.4. Alloys
- 20.1.5. Other Types
- 20.2. Market Analysis, Insights and Forecast - by Application
- 20.2.1. Flame Retardants
- 20.2.2. Batteries
- 20.2.3. Ceramics and Glass
- 20.2.4. Catalyst
- 20.2.5. Other Applications
- 20.1. Market Analysis, Insights and Forecast - by Type
- 21. Brazil Antimony Industry Analysis, Insights and Forecast, 2020-2032
- 21.1. Market Analysis, Insights and Forecast - by Type
- 21.1.1. Metal Ingot
- 21.1.2. Antimony Trioxide
- 21.1.3. Antimony Pentoxide
- 21.1.4. Alloys
- 21.1.5. Other Types
- 21.2. Market Analysis, Insights and Forecast - by Application
- 21.2.1. Flame Retardants
- 21.2.2. Batteries
- 21.2.3. Ceramics and Glass
- 21.2.4. Catalyst
- 21.2.5. Other Applications
- 21.1. Market Analysis, Insights and Forecast - by Type
- 22. Argentina Antimony Industry Analysis, Insights and Forecast, 2020-2032
- 22.1. Market Analysis, Insights and Forecast - by Type
- 22.1.1. Metal Ingot
- 22.1.2. Antimony Trioxide
- 22.1.3. Antimony Pentoxide
- 22.1.4. Alloys
- 22.1.5. Other Types
- 22.2. Market Analysis, Insights and Forecast - by Application
- 22.2.1. Flame Retardants
- 22.2.2. Batteries
- 22.2.3. Ceramics and Glass
- 22.2.4. Catalyst
- 22.2.5. Other Applications
- 22.1. Market Analysis, Insights and Forecast - by Type
- 23. Rest of South America Antimony Industry Analysis, Insights and Forecast, 2020-2032
- 23.1. Market Analysis, Insights and Forecast - by Type
- 23.1.1. Metal Ingot
- 23.1.2. Antimony Trioxide
- 23.1.3. Antimony Pentoxide
- 23.1.4. Alloys
- 23.1.5. Other Types
- 23.2. Market Analysis, Insights and Forecast - by Application
- 23.2.1. Flame Retardants
- 23.2.2. Batteries
- 23.2.3. Ceramics and Glass
- 23.2.4. Catalyst
- 23.2.5. Other Applications
- 23.1. Market Analysis, Insights and Forecast - by Type
- 24. Saudi Arabia Antimony Industry Analysis, Insights and Forecast, 2020-2032
- 24.1. Market Analysis, Insights and Forecast - by Type
- 24.1.1. Metal Ingot
- 24.1.2. Antimony Trioxide
- 24.1.3. Antimony Pentoxide
- 24.1.4. Alloys
- 24.1.5. Other Types
- 24.2. Market Analysis, Insights and Forecast - by Application
- 24.2.1. Flame Retardants
- 24.2.2. Batteries
- 24.2.3. Ceramics and Glass
- 24.2.4. Catalyst
- 24.2.5. Other Applications
- 24.1. Market Analysis, Insights and Forecast - by Type
- 25. South Africa Antimony Industry Analysis, Insights and Forecast, 2020-2032
- 25.1. Market Analysis, Insights and Forecast - by Type
- 25.1.1. Metal Ingot
- 25.1.2. Antimony Trioxide
- 25.1.3. Antimony Pentoxide
- 25.1.4. Alloys
- 25.1.5. Other Types
- 25.2. Market Analysis, Insights and Forecast - by Application
- 25.2.1. Flame Retardants
- 25.2.2. Batteries
- 25.2.3. Ceramics and Glass
- 25.2.4. Catalyst
- 25.2.5. Other Applications
- 25.1. Market Analysis, Insights and Forecast - by Type
- 26. Rest of Middle East and Africa Antimony Industry Analysis, Insights and Forecast, 2020-2032
- 26.1. Market Analysis, Insights and Forecast - by Type
- 26.1.1. Metal Ingot
- 26.1.2. Antimony Trioxide
- 26.1.3. Antimony Pentoxide
- 26.1.4. Alloys
- 26.1.5. Other Types
- 26.2. Market Analysis, Insights and Forecast - by Application
- 26.2.1. Flame Retardants
- 26.2.2. Batteries
- 26.2.3. Ceramics and Glass
- 26.2.4. Catalyst
- 26.2.5. Other Applications
- 26.1. Market Analysis, Insights and Forecast - by Type
- 27. Competitive Analysis
- 27.1. Company Profiles
- 27.1.1 Campine NV
- 27.1.1.1. Company Overview
- 27.1.1.2. Products
- 27.1.1.3. Company Financials
- 27.1.1.4. SWOT Analysis
- 27.1.2 Guangxi Huayuan Metal Chemical Co Ltd
- 27.1.2.1. Company Overview
- 27.1.2.2. Products
- 27.1.2.3. Company Financials
- 27.1.2.4. SWOT Analysis
- 27.1.3 Hsikwangshan Twinkling Star Co Ltd
- 27.1.3.1. Company Overview
- 27.1.3.2. Products
- 27.1.3.3. Company Financials
- 27.1.3.4. SWOT Analysis
- 27.1.4 Jiefu Corporation
- 27.1.4.1. Company Overview
- 27.1.4.2. Products
- 27.1.4.3. Company Financials
- 27.1.4.4. SWOT Analysis
- 27.1.5 Korea Zinc
- 27.1.5.1. Company Overview
- 27.1.5.2. Products
- 27.1.5.3. Company Financials
- 27.1.5.4. SWOT Analysis
- 27.1.6 Lambert Metals International Limited
- 27.1.6.1. Company Overview
- 27.1.6.2. Products
- 27.1.6.3. Company Financials
- 27.1.6.4. SWOT Analysis
- 27.1.7 Mandalay Resources
- 27.1.7.1. Company Overview
- 27.1.7.2. Products
- 27.1.7.3. Company Financials
- 27.1.7.4. SWOT Analysis
- 27.1.8 Nihon Seiko Co Ltd
- 27.1.8.1. Company Overview
- 27.1.8.2. Products
- 27.1.8.3. Company Financials
- 27.1.8.4. SWOT Analysis
- 27.1.9 Suzuhiro Chemical Co Ltd
- 27.1.9.1. Company Overview
- 27.1.9.2. Products
- 27.1.9.3. Company Financials
- 27.1.9.4. SWOT Analysis
- 27.1.10 United States Antimony Corporation
- 27.1.10.1. Company Overview
- 27.1.10.2. Products
- 27.1.10.3. Company Financials
- 27.1.10.4. SWOT Analysis
- 27.1.11 Yiyang City Huachang Antimony Industry Co Ltd
- 27.1.11.1. Company Overview
- 27.1.11.2. Products
- 27.1.11.3. Company Financials
- 27.1.11.4. SWOT Analysis
- 27.1.12 Yunnan Muli Antimony Industry Co Ltd*List Not Exhaustive
- 27.1.12.1. Company Overview
- 27.1.12.2. Products
- 27.1.12.3. Company Financials
- 27.1.12.4. SWOT Analysis
- 27.1.1 Campine NV
- 27.2. Market Entropy
- 27.2.1 Company's Key Areas Served
- 27.2.2 Recent Developments
- 27.3. Company Market Share Analysis 2025
- 27.3.1 Top 5 Companies Market Share Analysis
- 27.3.2 Top 3 Companies Market Share Analysis
- 27.4. List of Potential Customers
- 28. Research Methodology
List of Figures
- Figure 1: Global Antimony Industry Revenue Breakdown (billion, %) by Region 2025 & 2033
- Figure 2: Other Countries Antimony Industry Revenue (billion), by Type 2025 & 2033
- Figure 3: Other Countries Antimony Industry Revenue Share (%), by Type 2025 & 2033
- Figure 4: Other Countries Antimony Industry Revenue (billion), by Application 2025 & 2033
- Figure 5: Other Countries Antimony Industry Revenue Share (%), by Application 2025 & 2033
- Figure 6: Other Countries Antimony Industry Revenue (billion), by Country 2025 & 2033
- Figure 7: Other Countries Antimony Industry Revenue Share (%), by Country 2025 & 2033
- Figure 8: China Antimony Industry Revenue (billion), by Type 2025 & 2033
- Figure 9: China Antimony Industry Revenue Share (%), by Type 2025 & 2033
- Figure 10: China Antimony Industry Revenue (billion), by Application 2025 & 2033
- Figure 11: China Antimony Industry Revenue Share (%), by Application 2025 & 2033
- Figure 12: China Antimony Industry Revenue (billion), by Country 2025 & 2033
- Figure 13: China Antimony Industry Revenue Share (%), by Country 2025 & 2033
- Figure 14: India Antimony Industry Revenue (billion), by Type 2025 & 2033
- Figure 15: India Antimony Industry Revenue Share (%), by Type 2025 & 2033
- Figure 16: India Antimony Industry Revenue (billion), by Application 2025 & 2033
- Figure 17: India Antimony Industry Revenue Share (%), by Application 2025 & 2033
- Figure 18: India Antimony Industry Revenue (billion), by Country 2025 & 2033
- Figure 19: India Antimony Industry Revenue Share (%), by Country 2025 & 2033
- Figure 20: Japan Antimony Industry Revenue (billion), by Type 2025 & 2033
- Figure 21: Japan Antimony Industry Revenue Share (%), by Type 2025 & 2033
- Figure 22: Japan Antimony Industry Revenue (billion), by Application 2025 & 2033
- Figure 23: Japan Antimony Industry Revenue Share (%), by Application 2025 & 2033
- Figure 24: Japan Antimony Industry Revenue (billion), by Country 2025 & 2033
- Figure 25: Japan Antimony Industry Revenue Share (%), by Country 2025 & 2033
- Figure 26: South Korea Antimony Industry Revenue (billion), by Type 2025 & 2033
- Figure 27: South Korea Antimony Industry Revenue Share (%), by Type 2025 & 2033
- Figure 28: South Korea Antimony Industry Revenue (billion), by Application 2025 & 2033
- Figure 29: South Korea Antimony Industry Revenue Share (%), by Application 2025 & 2033
- Figure 30: South Korea Antimony Industry Revenue (billion), by Country 2025 & 2033
- Figure 31: South Korea Antimony Industry Revenue Share (%), by Country 2025 & 2033
- Figure 32: Rest of Asia Pacific Antimony Industry Revenue (billion), by Type 2025 & 2033
- Figure 33: Rest of Asia Pacific Antimony Industry Revenue Share (%), by Type 2025 & 2033
- Figure 34: Rest of Asia Pacific Antimony Industry Revenue (billion), by Application 2025 & 2033
- Figure 35: Rest of Asia Pacific Antimony Industry Revenue Share (%), by Application 2025 & 2033
- Figure 36: Rest of Asia Pacific Antimony Industry Revenue (billion), by Country 2025 & 2033
- Figure 37: Rest of Asia Pacific Antimony Industry Revenue Share (%), by Country 2025 & 2033
- Figure 38: United States Antimony Industry Revenue (billion), by Type 2025 & 2033
- Figure 39: United States Antimony Industry Revenue Share (%), by Type 2025 & 2033
- Figure 40: United States Antimony Industry Revenue (billion), by Application 2025 & 2033
- Figure 41: United States Antimony Industry Revenue Share (%), by Application 2025 & 2033
- Figure 42: United States Antimony Industry Revenue (billion), by Country 2025 & 2033
- Figure 43: United States Antimony Industry Revenue Share (%), by Country 2025 & 2033
- Figure 44: Canada Antimony Industry Revenue (billion), by Type 2025 & 2033
- Figure 45: Canada Antimony Industry Revenue Share (%), by Type 2025 & 2033
- Figure 46: Canada Antimony Industry Revenue (billion), by Application 2025 & 2033
- Figure 47: Canada Antimony Industry Revenue Share (%), by Application 2025 & 2033
- Figure 48: Canada Antimony Industry Revenue (billion), by Country 2025 & 2033
- Figure 49: Canada Antimony Industry Revenue Share (%), by Country 2025 & 2033
- Figure 50: Mexico Antimony Industry Revenue (billion), by Type 2025 & 2033
- Figure 51: Mexico Antimony Industry Revenue Share (%), by Type 2025 & 2033
- Figure 52: Mexico Antimony Industry Revenue (billion), by Application 2025 & 2033
- Figure 53: Mexico Antimony Industry Revenue Share (%), by Application 2025 & 2033
- Figure 54: Mexico Antimony Industry Revenue (billion), by Country 2025 & 2033
- Figure 55: Mexico Antimony Industry Revenue Share (%), by Country 2025 & 2033
- Figure 56: Germany Antimony Industry Revenue (billion), by Type 2025 & 2033
- Figure 57: Germany Antimony Industry Revenue Share (%), by Type 2025 & 2033
- Figure 58: Germany Antimony Industry Revenue (billion), by Application 2025 & 2033
- Figure 59: Germany Antimony Industry Revenue Share (%), by Application 2025 & 2033
- Figure 60: Germany Antimony Industry Revenue (billion), by Country 2025 & 2033
- Figure 61: Germany Antimony Industry Revenue Share (%), by Country 2025 & 2033
- Figure 62: United Kingdom Antimony Industry Revenue (billion), by Type 2025 & 2033
- Figure 63: United Kingdom Antimony Industry Revenue Share (%), by Type 2025 & 2033
- Figure 64: United Kingdom Antimony Industry Revenue (billion), by Application 2025 & 2033
- Figure 65: United Kingdom Antimony Industry Revenue Share (%), by Application 2025 & 2033
- Figure 66: United Kingdom Antimony Industry Revenue (billion), by Country 2025 & 2033
- Figure 67: United Kingdom Antimony Industry Revenue Share (%), by Country 2025 & 2033
- Figure 68: Italy Antimony Industry Revenue (billion), by Type 2025 & 2033
- Figure 69: Italy Antimony Industry Revenue Share (%), by Type 2025 & 2033
- Figure 70: Italy Antimony Industry Revenue (billion), by Application 2025 & 2033
- Figure 71: Italy Antimony Industry Revenue Share (%), by Application 2025 & 2033
- Figure 72: Italy Antimony Industry Revenue (billion), by Country 2025 & 2033
- Figure 73: Italy Antimony Industry Revenue Share (%), by Country 2025 & 2033
- Figure 74: France Antimony Industry Revenue (billion), by Type 2025 & 2033
- Figure 75: France Antimony Industry Revenue Share (%), by Type 2025 & 2033
- Figure 76: France Antimony Industry Revenue (billion), by Application 2025 & 2033
- Figure 77: France Antimony Industry Revenue Share (%), by Application 2025 & 2033
- Figure 78: France Antimony Industry Revenue (billion), by Country 2025 & 2033
- Figure 79: France Antimony Industry Revenue Share (%), by Country 2025 & 2033
- Figure 80: Rest of Europe Antimony Industry Revenue (billion), by Type 2025 & 2033
- Figure 81: Rest of Europe Antimony Industry Revenue Share (%), by Type 2025 & 2033
- Figure 82: Rest of Europe Antimony Industry Revenue (billion), by Application 2025 & 2033
- Figure 83: Rest of Europe Antimony Industry Revenue Share (%), by Application 2025 & 2033
- Figure 84: Rest of Europe Antimony Industry Revenue (billion), by Country 2025 & 2033
- Figure 85: Rest of Europe Antimony Industry Revenue Share (%), by Country 2025 & 2033
- Figure 86: Brazil Antimony Industry Revenue (billion), by Type 2025 & 2033
- Figure 87: Brazil Antimony Industry Revenue Share (%), by Type 2025 & 2033
- Figure 88: Brazil Antimony Industry Revenue (billion), by Application 2025 & 2033
- Figure 89: Brazil Antimony Industry Revenue Share (%), by Application 2025 & 2033
- Figure 90: Brazil Antimony Industry Revenue (billion), by Country 2025 & 2033
- Figure 91: Brazil Antimony Industry Revenue Share (%), by Country 2025 & 2033
- Figure 92: Argentina Antimony Industry Revenue (billion), by Type 2025 & 2033
- Figure 93: Argentina Antimony Industry Revenue Share (%), by Type 2025 & 2033
- Figure 94: Argentina Antimony Industry Revenue (billion), by Application 2025 & 2033
- Figure 95: Argentina Antimony Industry Revenue Share (%), by Application 2025 & 2033
- Figure 96: Argentina Antimony Industry Revenue (billion), by Country 2025 & 2033
- Figure 97: Argentina Antimony Industry Revenue Share (%), by Country 2025 & 2033
- Figure 98: Rest of South America Antimony Industry Revenue (billion), by Type 2025 & 2033
- Figure 99: Rest of South America Antimony Industry Revenue Share (%), by Type 2025 & 2033
- Figure 100: Rest of South America Antimony Industry Revenue (billion), by Application 2025 & 2033
- Figure 101: Rest of South America Antimony Industry Revenue Share (%), by Application 2025 & 2033
- Figure 102: Rest of South America Antimony Industry Revenue (billion), by Country 2025 & 2033
- Figure 103: Rest of South America Antimony Industry Revenue Share (%), by Country 2025 & 2033
- Figure 104: Saudi Arabia Antimony Industry Revenue (billion), by Type 2025 & 2033
- Figure 105: Saudi Arabia Antimony Industry Revenue Share (%), by Type 2025 & 2033
- Figure 106: Saudi Arabia Antimony Industry Revenue (billion), by Application 2025 & 2033
- Figure 107: Saudi Arabia Antimony Industry Revenue Share (%), by Application 2025 & 2033
- Figure 108: Saudi Arabia Antimony Industry Revenue (billion), by Country 2025 & 2033
- Figure 109: Saudi Arabia Antimony Industry Revenue Share (%), by Country 2025 & 2033
- Figure 110: South Africa Antimony Industry Revenue (billion), by Type 2025 & 2033
- Figure 111: South Africa Antimony Industry Revenue Share (%), by Type 2025 & 2033
- Figure 112: South Africa Antimony Industry Revenue (billion), by Application 2025 & 2033
- Figure 113: South Africa Antimony Industry Revenue Share (%), by Application 2025 & 2033
- Figure 114: South Africa Antimony Industry Revenue (billion), by Country 2025 & 2033
- Figure 115: South Africa Antimony Industry Revenue Share (%), by Country 2025 & 2033
- Figure 116: Rest of Middle East and Africa Antimony Industry Revenue (billion), by Type 2025 & 2033
- Figure 117: Rest of Middle East and Africa Antimony Industry Revenue Share (%), by Type 2025 & 2033
- Figure 118: Rest of Middle East and Africa Antimony Industry Revenue (billion), by Application 2025 & 2033
- Figure 119: Rest of Middle East and Africa Antimony Industry Revenue Share (%), by Application 2025 & 2033
- Figure 120: Rest of Middle East and Africa Antimony Industry Revenue (billion), by Country 2025 & 2033
- Figure 121: Rest of Middle East and Africa Antimony Industry Revenue Share (%), by Country 2025 & 2033
List of Tables
- Table 1: Global Antimony Industry Revenue billion Forecast, by Type 2020 & 2033
- Table 2: Global Antimony Industry Revenue billion Forecast, by Application 2020 & 2033
- Table 3: Global Antimony Industry Revenue billion Forecast, by Region 2020 & 2033
- Table 4: Global Antimony Industry Revenue billion Forecast, by Type 2020 & 2033
- Table 5: Global Antimony Industry Revenue billion Forecast, by Application 2020 & 2033
- Table 6: Global Antimony Industry Revenue billion Forecast, by Country 2020 & 2033
- Table 7: Global Antimony Industry Revenue billion Forecast, by Type 2020 & 2033
- Table 8: Global Antimony Industry Revenue billion Forecast, by Application 2020 & 2033
- Table 9: Global Antimony Industry Revenue billion Forecast, by Country 2020 & 2033
- Table 10: Global Antimony Industry Revenue billion Forecast, by Type 2020 & 2033
- Table 11: Global Antimony Industry Revenue billion Forecast, by Application 2020 & 2033
- Table 12: Global Antimony Industry Revenue billion Forecast, by Country 2020 & 2033
- Table 13: Global Antimony Industry Revenue billion Forecast, by Type 2020 & 2033
- Table 14: Global Antimony Industry Revenue billion Forecast, by Application 2020 & 2033
- Table 15: Global Antimony Industry Revenue billion Forecast, by Country 2020 & 2033
- Table 16: Global Antimony Industry Revenue billion Forecast, by Type 2020 & 2033
- Table 17: Global Antimony Industry Revenue billion Forecast, by Application 2020 & 2033
- Table 18: Global Antimony Industry Revenue billion Forecast, by Country 2020 & 2033
- Table 19: Global Antimony Industry Revenue billion Forecast, by Type 2020 & 2033
- Table 20: Global Antimony Industry Revenue billion Forecast, by Application 2020 & 2033
- Table 21: Global Antimony Industry Revenue billion Forecast, by Country 2020 & 2033
- Table 22: North America Antimony Industry Revenue (billion) Forecast, by Application 2020 & 2033
- Table 23: Global Antimony Industry Revenue billion Forecast, by Type 2020 & 2033
- Table 24: Global Antimony Industry Revenue billion Forecast, by Application 2020 & 2033
- Table 25: Global Antimony Industry Revenue billion Forecast, by Country 2020 & 2033
- Table 26: Global Antimony Industry Revenue billion Forecast, by Type 2020 & 2033
- Table 27: Global Antimony Industry Revenue billion Forecast, by Application 2020 & 2033
- Table 28: Global Antimony Industry Revenue billion Forecast, by Country 2020 & 2033
- Table 29: Global Antimony Industry Revenue billion Forecast, by Type 2020 & 2033
- Table 30: Global Antimony Industry Revenue billion Forecast, by Application 2020 & 2033
- Table 31: Global Antimony Industry Revenue billion Forecast, by Country 2020 & 2033
- Table 32: Europe Antimony Industry Revenue (billion) Forecast, by Application 2020 & 2033
- Table 33: Global Antimony Industry Revenue billion Forecast, by Type 2020 & 2033
- Table 34: Global Antimony Industry Revenue billion Forecast, by Application 2020 & 2033
- Table 35: Global Antimony Industry Revenue billion Forecast, by Country 2020 & 2033
- Table 36: Global Antimony Industry Revenue billion Forecast, by Type 2020 & 2033
- Table 37: Global Antimony Industry Revenue billion Forecast, by Application 2020 & 2033
- Table 38: Global Antimony Industry Revenue billion Forecast, by Country 2020 & 2033
- Table 39: Global Antimony Industry Revenue billion Forecast, by Type 2020 & 2033
- Table 40: Global Antimony Industry Revenue billion Forecast, by Application 2020 & 2033
- Table 41: Global Antimony Industry Revenue billion Forecast, by Country 2020 & 2033
- Table 42: Global Antimony Industry Revenue billion Forecast, by Type 2020 & 2033
- Table 43: Global Antimony Industry Revenue billion Forecast, by Application 2020 & 2033
- Table 44: Global Antimony Industry Revenue billion Forecast, by Country 2020 & 2033
- Table 45: Global Antimony Industry Revenue billion Forecast, by Type 2020 & 2033
- Table 46: Global Antimony Industry Revenue billion Forecast, by Application 2020 & 2033
- Table 47: Global Antimony Industry Revenue billion Forecast, by Country 2020 & 2033
- Table 48: South America Antimony Industry Revenue (billion) Forecast, by Application 2020 & 2033
- Table 49: Global Antimony Industry Revenue billion Forecast, by Type 2020 & 2033
- Table 50: Global Antimony Industry Revenue billion Forecast, by Application 2020 & 2033
- Table 51: Global Antimony Industry Revenue billion Forecast, by Country 2020 & 2033
- Table 52: Global Antimony Industry Revenue billion Forecast, by Type 2020 & 2033
- Table 53: Global Antimony Industry Revenue billion Forecast, by Application 2020 & 2033
- Table 54: Global Antimony Industry Revenue billion Forecast, by Country 2020 & 2033
- Table 55: Global Antimony Industry Revenue billion Forecast, by Type 2020 & 2033
- Table 56: Global Antimony Industry Revenue billion Forecast, by Application 2020 & 2033
- Table 57: Global Antimony Industry Revenue billion Forecast, by Country 2020 & 2033
- Table 58: Middle East and Africa Antimony Industry Revenue (billion) Forecast, by Application 2020 & 2033
- Table 59: Global Antimony Industry Revenue billion Forecast, by Type 2020 & 2033
- Table 60: Global Antimony Industry Revenue billion Forecast, by Application 2020 & 2033
- Table 61: Global Antimony Industry Revenue billion Forecast, by Country 2020 & 2033
- Table 62: Global Antimony Industry Revenue billion Forecast, by Type 2020 & 2033
- Table 63: Global Antimony Industry Revenue billion Forecast, by Application 2020 & 2033
- Table 64: Global Antimony Industry Revenue billion Forecast, by Country 2020 & 2033
- Table 65: Global Antimony Industry Revenue billion Forecast, by Type 2020 & 2033
- Table 66: Global Antimony Industry Revenue billion Forecast, by Application 2020 & 2033
- Table 67: Global Antimony Industry Revenue billion Forecast, by Country 2020 & 2033
Frequently Asked Questions
1. What is the projected Compound Annual Growth Rate (CAGR) of the Antimony Industry?
The projected CAGR is approximately 6%.
2. Which companies are prominent players in the Antimony Industry?
Key companies in the market include Campine NV, Guangxi Huayuan Metal Chemical Co Ltd, Hsikwangshan Twinkling Star Co Ltd, Jiefu Corporation, Korea Zinc, Lambert Metals International Limited, Mandalay Resources, Nihon Seiko Co Ltd, Suzuhiro Chemical Co Ltd, United States Antimony Corporation, Yiyang City Huachang Antimony Industry Co Ltd, Yunnan Muli Antimony Industry Co Ltd*List Not Exhaustive.
3. What are the main segments of the Antimony Industry?
The market segments include Type, Application.
4. Can you provide details about the market size?
The market size is estimated to be USD 2.5 billion as of 2022.
5. What are some drivers contributing to market growth?
Rising Demand from PET Manufacturers; Growing Demand from the Plastic Industry.
6. What are the notable trends driving market growth?
The Flame Retardants Segment is Expected to Dominate the Market.
7. Are there any restraints impacting market growth?
Rising Demand from PET Manufacturers; Growing Demand from the Plastic Industry.
8. Can you provide examples of recent developments in the market?
The recent developments in the major players in the market are covered in the complete study.
9. What pricing options are available for accessing the report?
Pricing options include single-user, multi-user, and enterprise licenses priced at USD 4750, USD 5250, and USD 8750 respectively.
10. Is the market size provided in terms of value or volume?
The market size is provided in terms of value, measured in billion.
11. Are there any specific market keywords associated with the report?
Yes, the market keyword associated with the report is "Antimony Industry," which aids in identifying and referencing the specific market segment covered.
12. How do I determine which pricing option suits my needs best?
The pricing options vary based on user requirements and access needs. Individual users may opt for single-user licenses, while businesses requiring broader access may choose multi-user or enterprise licenses for cost-effective access to the report.
13. Are there any additional resources or data provided in the Antimony Industry report?
While the report offers comprehensive insights, it's advisable to review the specific contents or supplementary materials provided to ascertain if additional resources or data are available.
14. How can I stay updated on further developments or reports in the Antimony Industry?
To stay informed about further developments, trends, and reports in the Antimony Industry, consider subscribing to industry newsletters, following relevant companies and organizations, or regularly checking reputable industry news sources and publications.
Methodology
Step 1 - Identification of Relevant Samples Size from Population Database


Step 2 - Approaches for Defining Global Market Size (Value, Volume* & Price*)

Note*: In applicable scenarios
Step 3 - Data Sources
Primary Research
- Web Analytics
- Survey Reports
- Research Institute
- Latest Research Reports
- Opinion Leaders
Secondary Research
- Annual Reports
- White Paper
- Latest Press Release
- Industry Association
- Paid Database
- Investor Presentations

Step 4 - Data Triangulation
Involves using different sources of information in order to increase the validity of a study
These sources are likely to be stakeholders in a program - participants, other researchers, program staff, other community members, and so on.
Then we put all data in single framework & apply various statistical tools to find out the dynamic on the market.
During the analysis stage, feedback from the stakeholder groups would be compared to determine areas of agreement as well as areas of divergence