

Key Insights
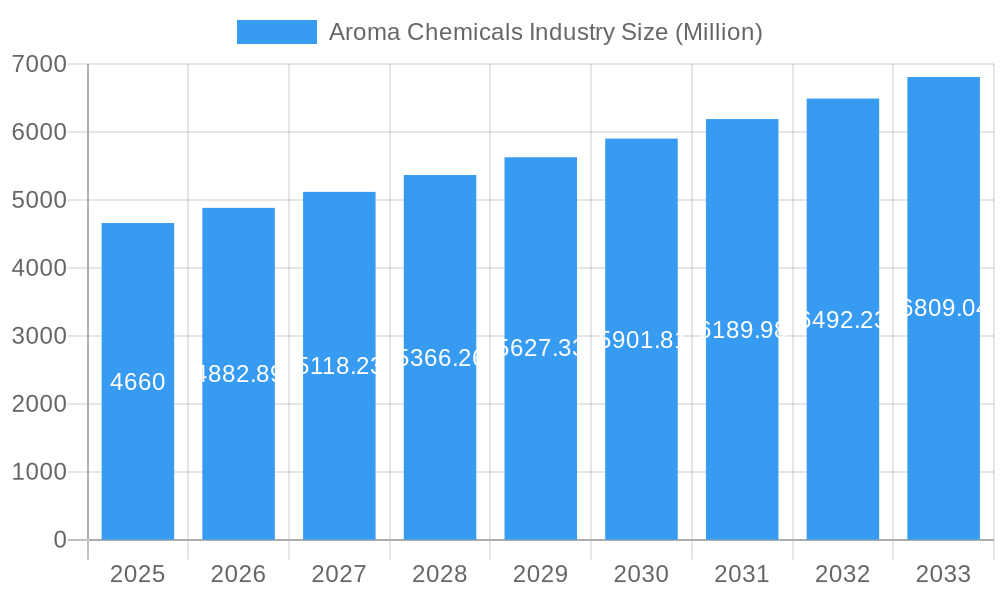
The aroma chemicals market, valued at $4.66 billion in 2025, is projected to experience robust growth, driven by increasing demand across diverse sectors. The compound annual growth rate (CAGR) of 4.65% from 2025 to 2033 indicates a significant expansion potential. Key drivers include the rising popularity of natural and organic products in cosmetics and personal care, coupled with the growing demand for sophisticated fragrances in fine fragrances and household products. The food and beverage industry also contributes significantly, with aroma chemicals enhancing the flavor profiles of various products. Market segmentation reveals strong performance in terpenes and benzenoids, reflecting consumer preference for naturally derived ingredients. The Asia-Pacific region, particularly China and India, is expected to be a major growth engine, fueled by expanding consumer bases and increasing disposable incomes. However, stringent regulations regarding the use of certain chemicals and fluctuating raw material prices present challenges to sustained growth. Competitive dynamics are shaped by the presence of both large multinational corporations like Givaudan and Symrise, and smaller, specialized players, leading to innovation and a diversified product landscape. Continued investments in research and development, focusing on sustainable and eco-friendly alternatives, will further shape the market trajectory.
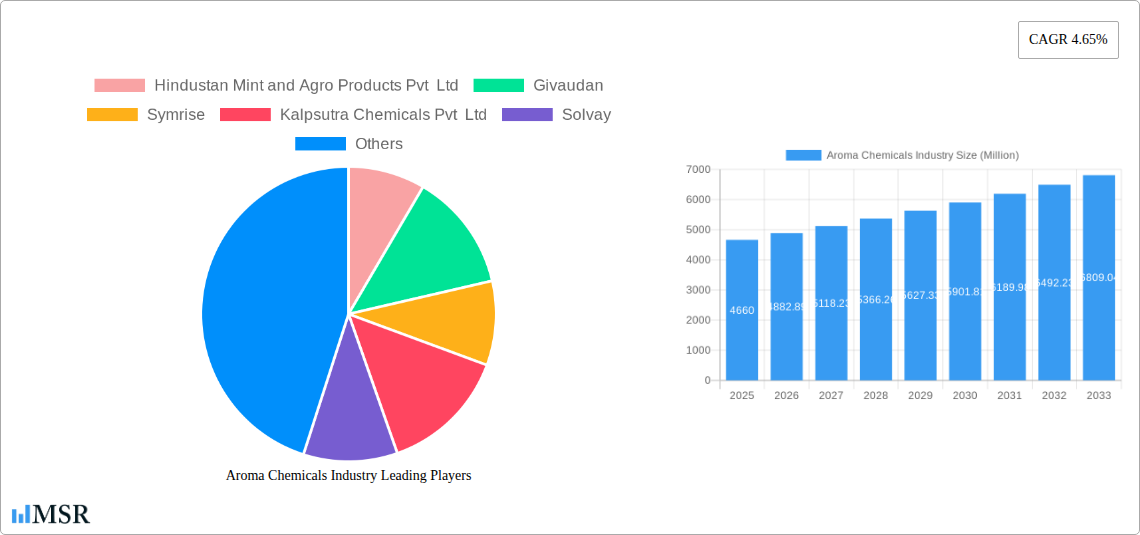
Aroma Chemicals Industry Market Size (In Billion)
The forecast period (2025-2033) anticipates consistent growth, with market expansion fueled by innovation in fragrance technology and the increasing integration of aroma chemicals into everyday products. The growth across different application segments (Soap & Detergents, Cosmetics & Toiletries, Fine Fragrances, Household Products, Food & Beverage) will vary based on individual sector growth rates and consumer trends. For example, the continued growth of the natural and organic cosmetics sector will likely boost demand for specific types of aroma chemicals. Geographical expansion will also play a vital role, with emerging markets in Asia Pacific and other developing regions offering significant growth potential. Companies are likely to focus on strategic partnerships and acquisitions to expand their market share and enhance their product portfolios. Furthermore, the industry's focus on sustainability, including sourcing and production, is likely to gain greater importance over the coming years.
Aroma Chemicals Industry Company Market Share
Aroma Chemicals Industry: A Comprehensive Market Report (2019-2033)
This comprehensive report provides a detailed analysis of the Aroma Chemicals industry, encompassing market size, growth drivers, key players, and future trends. With a study period spanning 2019-2033, a base year of 2025, and a forecast period of 2025-2033, this report offers invaluable insights for industry stakeholders, investors, and strategic decision-makers. The global aroma chemicals market is projected to reach xx Million by 2033, exhibiting a CAGR of xx% during the forecast period.
Aroma Chemicals Industry Market Concentration & Dynamics
The Aroma Chemicals market is moderately concentrated, with several multinational corporations holding significant market share. Key players such as Givaudan, Symrise, and Firmenich exert considerable influence due to their extensive product portfolios, global reach, and robust R&D capabilities. However, smaller, specialized companies like Hindustan Mint and Agro Products Pvt Ltd and Kalpsutra Chemicals Pvt Ltd also contribute significantly to niche segments. The industry is characterized by a dynamic innovation ecosystem, with continuous efforts to develop sustainable and natural aroma chemicals. Stringent regulatory frameworks, particularly concerning safety and environmental impact, are shaping industry practices. Substitute products, such as natural essential oils, exert competitive pressure, particularly in the food and beverage sector.
- Market Share: Top 5 players hold approximately xx% of the global market share (2024).
- M&A Activity: An average of xx M&A deals per year were observed during the historical period (2019-2024), indicating a consolidating market. These deals often involve strategic acquisitions aimed at expanding product lines and geographical reach.
- End-User Trends: Growing demand for natural and sustainable products is driving innovation in the sector. Consumers are increasingly seeking cleaner labels and environmentally friendly options, affecting demand across all application segments.
Aroma Chemicals Industry Insights & Trends
The Aroma Chemicals market is experiencing robust growth, driven by several key factors. The increasing demand for fragrances and flavors in personal care, food & beverage, and household products is a significant contributor. Technological advancements in extraction and synthesis techniques are also expanding the availability of a wider range of aroma chemicals at competitive prices. Evolving consumer preferences towards natural and sustainable ingredients are further shaping market dynamics. The shift towards healthier lifestyles and the growing popularity of natural products are influencing consumer purchasing decisions. The market size is estimated at xx Million in 2025 and is projected to reach xx Million by 2033.
- Market Size (2025): xx Million
- CAGR (2025-2033): xx%
Key Markets & Segments Leading Aroma Chemicals Industry
The Asia-Pacific region dominates the Aroma Chemicals market, driven by strong economic growth and expanding consumer base, particularly in India and China. Within the application segments, the Cosmetics and Toiletries sector accounts for the largest share, followed by the Food and Beverage sector. In terms of types, Terpenes and Benzenoids hold the largest market share, driven by their versatility and extensive applications.
Key Market Drivers:
- Asia-Pacific Region: Rapid economic growth, rising disposable incomes, and growing population.
- Cosmetics and Toiletries: Increasing demand for personal care products and premium fragrances.
- Food and Beverage: Growing consumer preference for natural flavors and enhanced sensory experiences.
Dominance Analysis: The dominance of Asia-Pacific stems from its large and rapidly growing consumer market, coupled with significant investments in the manufacturing sector. The Cosmetics and Toiletries segment's dominance is linked to the strong demand for premium fragrances and personal care products, influenced by trends in beauty and wellness.
Aroma Chemicals Industry Product Developments
Recent years have witnessed significant advancements in aroma chemical technology, leading to the development of more sustainable and high-performance products. Companies are focusing on natural and bio-based aroma chemicals, responding to growing consumer demand for environmentally friendly options. Innovations in extraction techniques, such as supercritical fluid extraction (SFE), allow for the production of high-quality natural aroma chemicals with minimal environmental impact. These advancements cater to increased demand from various end-use industries.
Challenges in the Aroma Chemicals Industry Market
The Aroma Chemicals industry faces several challenges, including stringent regulatory requirements concerning the safety and environmental impact of aroma chemicals. Supply chain disruptions and price volatility of raw materials pose a considerable threat. Intense competition among established players and the emergence of new entrants add further pressure on profit margins. Regulatory changes may lead to increased compliance costs, impacting the profitability of smaller companies. Supply chain issues may lead to xx% increase in production costs in 2026.
Forces Driving Aroma Chemicals Industry Growth
Several factors are driving growth in the Aroma Chemicals industry, including technological advancements, the growing demand for natural and sustainable products, and expanding applications in various end-use sectors. Economic growth, particularly in developing economies, is driving demand. Government regulations promoting sustainable practices incentivize the development of eco-friendly aroma chemicals.
Challenges in the Aroma Chemicals Industry Market
Long-term growth will hinge on innovation in sustainable sourcing and production, strategic partnerships to secure supply chains, and expansion into new and emerging markets. Collaboration between research institutions and industry players is crucial for developing cutting-edge technologies and addressing sustainability concerns.
Emerging Opportunities in Aroma Chemicals Industry
Emerging opportunities include the growing demand for personalized fragrances and flavors, the rise of niche and artisanal aroma chemical brands, and the expansion into new application areas such as pharmaceuticals and bio-pesticides. The increasing adoption of sustainable and eco-friendly practices creates opportunities for companies offering such products. Exploration of novel extraction and synthesis methods will unlock new possibilities.
Leading Players in the Aroma Chemicals Industry Sector
- Hindustan Mint and Agro Products Pvt Ltd
- Givaudan
- Symrise
- Kalpsutra Chemicals Pvt Ltd
- Solvay
- Takasago International Corporation
- BASF SE
- S H Kelkar And Company Limited
- Robertet Group
- DSM
- Bell Flavors & Fragrances
- Treatt Plc
- Kao Corporation
- Silverline Chemicals
Key Milestones in Aroma Chemicals Industry Industry
- September 2022: Solvay expanded its Rhovanil Natural CW product line with three new natural flavors (Delica, Alta, and Sublima), boosting its presence in the F&B sector's transition to natural ingredients.
- August 2022: Kao Corporation announced plans to strengthen its European market share for methyl dihydro jasmonate (MDJ), a synthetic fragrance used widely in consumer products.
Strategic Outlook for Aroma Chemicals Industry Market
The Aroma Chemicals market is poised for continued growth, driven by sustained demand from diverse end-use sectors, technological advancements, and increasing consumer focus on natural and sustainable products. Strategic partnerships, investments in R&D, and expansion into emerging markets will be crucial for maximizing market potential. Companies that prioritize sustainability and innovation will be best positioned for long-term success.
Aroma Chemicals Industry Segmentation
-
1. Type
- 1.1. Terpenes
- 1.2. Benzenoids
- 1.3. Musk Chemicals
- 1.4. Other Types
-
2. Application
- 2.1. Soap and Detergents
- 2.2. Cosmetics and Toiletries
- 2.3. Fine Fragrances
- 2.4. Household Products
- 2.5. Food and Beverage
- 2.6. Other Applications
Aroma Chemicals Industry Segmentation By Geography
-
1. Asia Pacific
- 1.1. China
- 1.2. India
- 1.3. Japan
- 1.4. South Korea
- 1.5. Rest of Asia Pacific
-
2. North America
- 2.1. United States
- 2.2. Canada
- 2.3. Mexico
-
3. Europe
- 3.1. Germany
- 3.2. United Kingdom
- 3.3. Italy
- 3.4. France
- 3.5. Rest of Europe
-
4. South America
- 4.1. Brazil
- 4.2. Argentina
- 4.3. Rest of South America
-
5. Middle East and Africa
- 5.1. Saudi Arabia
- 5.2. South Africa
- 5.3. Rest of Middle East and Africa
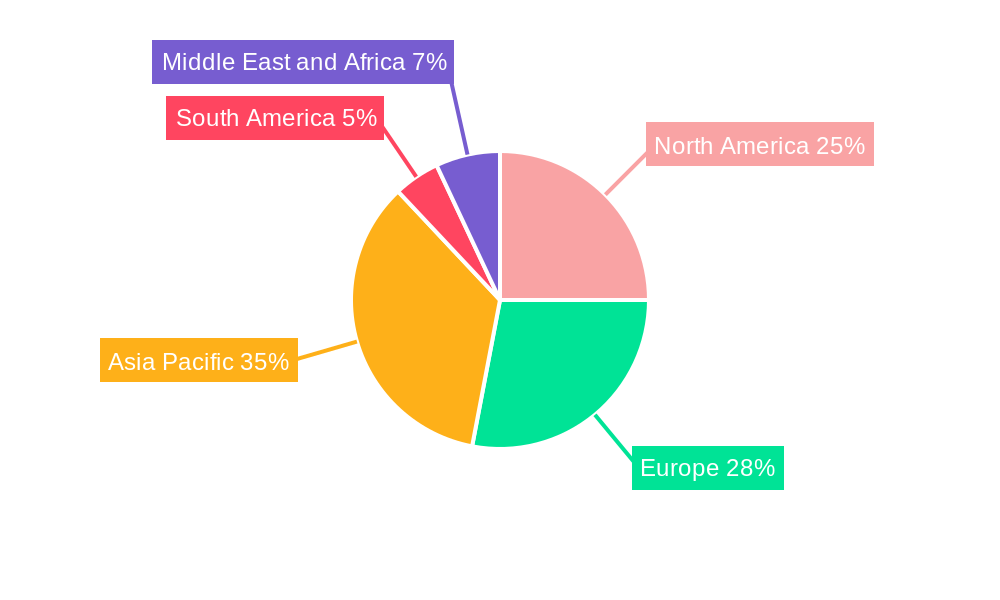
Aroma Chemicals Industry Regional Market Share
Geographic Coverage of Aroma Chemicals Industry
Aroma Chemicals Industry REPORT HIGHLIGHTS
| Aspects | Details |
|---|---|
| Study Period | 2020-2034 |
| Base Year | 2025 |
| Estimated Year | 2026 |
| Forecast Period | 2026-2034 |
| Historical Period | 2020-2025 |
| Growth Rate | CAGR of 4.65% from 2020-2034 |
| Segmentation |
|
Table of Contents
- 1. Introduction
- 1.1. Research Scope
- 1.2. Market Segmentation
- 1.3. Research Objective
- 1.4. Definitions and Assumptions
- 2. Executive Summary
- 2.1. Market Snapshot
- 3. Market Dynamics
- 3.1. Market Drivers
- 3.2. Market Restrains
- 3.3. Market Trends
- 3.4. Market Opportunities
- 4. Market Factor Analysis
- 4.1. Porters Five Forces
- 4.1.1. Bargaining Power of Suppliers
- 4.1.2. Bargaining Power of Buyers
- 4.1.3. Threat of New Entrants
- 4.1.4. Threat of Substitutes
- 4.1.5. Competitive Rivalry
- 4.2. PESTEL analysis
- 4.3. BCG Analysis
- 4.3.1. Stars (High Growth, High Market Share)
- 4.3.2. Cash Cows (Low Growth, High Market Share)
- 4.3.3. Question Mark (High Growth, Low Market Share)
- 4.3.4. Dogs (Low Growth, Low Market Share)
- 4.4. Ansoff Matrix Analysis
- 4.5. Supply Chain Analysis
- 4.6. Regulatory Landscape
- 4.7. Current Market Potential and Opportunity Assessment (TAM–SAM–SOM Framework)
- 4.8. MSR Analyst Note
- 4.1. Porters Five Forces
- 5. Market Analysis, Insights and Forecast 2021-2033
- 5.1. Market Analysis, Insights and Forecast - by Type
- 5.1.1. Terpenes
- 5.1.2. Benzenoids
- 5.1.3. Musk Chemicals
- 5.1.4. Other Types
- 5.2. Market Analysis, Insights and Forecast - by Application
- 5.2.1. Soap and Detergents
- 5.2.2. Cosmetics and Toiletries
- 5.2.3. Fine Fragrances
- 5.2.4. Household Products
- 5.2.5. Food and Beverage
- 5.2.6. Other Applications
- 5.3. Market Analysis, Insights and Forecast - by Region
- 5.3.1. Asia Pacific
- 5.3.2. North America
- 5.3.3. Europe
- 5.3.4. South America
- 5.3.5. Middle East and Africa
- 5.1. Market Analysis, Insights and Forecast - by Type
- 6. Global Aroma Chemicals Industry Analysis, Insights and Forecast, 2021-2033
- 6.1. Market Analysis, Insights and Forecast - by Type
- 6.1.1. Terpenes
- 6.1.2. Benzenoids
- 6.1.3. Musk Chemicals
- 6.1.4. Other Types
- 6.2. Market Analysis, Insights and Forecast - by Application
- 6.2.1. Soap and Detergents
- 6.2.2. Cosmetics and Toiletries
- 6.2.3. Fine Fragrances
- 6.2.4. Household Products
- 6.2.5. Food and Beverage
- 6.2.6. Other Applications
- 6.1. Market Analysis, Insights and Forecast - by Type
- 7. Asia Pacific Aroma Chemicals Industry Analysis, Insights and Forecast, 2020-2032
- 7.1. Market Analysis, Insights and Forecast - by Type
- 7.1.1. Terpenes
- 7.1.2. Benzenoids
- 7.1.3. Musk Chemicals
- 7.1.4. Other Types
- 7.2. Market Analysis, Insights and Forecast - by Application
- 7.2.1. Soap and Detergents
- 7.2.2. Cosmetics and Toiletries
- 7.2.3. Fine Fragrances
- 7.2.4. Household Products
- 7.2.5. Food and Beverage
- 7.2.6. Other Applications
- 7.1. Market Analysis, Insights and Forecast - by Type
- 8. North America Aroma Chemicals Industry Analysis, Insights and Forecast, 2020-2032
- 8.1. Market Analysis, Insights and Forecast - by Type
- 8.1.1. Terpenes
- 8.1.2. Benzenoids
- 8.1.3. Musk Chemicals
- 8.1.4. Other Types
- 8.2. Market Analysis, Insights and Forecast - by Application
- 8.2.1. Soap and Detergents
- 8.2.2. Cosmetics and Toiletries
- 8.2.3. Fine Fragrances
- 8.2.4. Household Products
- 8.2.5. Food and Beverage
- 8.2.6. Other Applications
- 8.1. Market Analysis, Insights and Forecast - by Type
- 9. Europe Aroma Chemicals Industry Analysis, Insights and Forecast, 2020-2032
- 9.1. Market Analysis, Insights and Forecast - by Type
- 9.1.1. Terpenes
- 9.1.2. Benzenoids
- 9.1.3. Musk Chemicals
- 9.1.4. Other Types
- 9.2. Market Analysis, Insights and Forecast - by Application
- 9.2.1. Soap and Detergents
- 9.2.2. Cosmetics and Toiletries
- 9.2.3. Fine Fragrances
- 9.2.4. Household Products
- 9.2.5. Food and Beverage
- 9.2.6. Other Applications
- 9.1. Market Analysis, Insights and Forecast - by Type
- 10. South America Aroma Chemicals Industry Analysis, Insights and Forecast, 2020-2032
- 10.1. Market Analysis, Insights and Forecast - by Type
- 10.1.1. Terpenes
- 10.1.2. Benzenoids
- 10.1.3. Musk Chemicals
- 10.1.4. Other Types
- 10.2. Market Analysis, Insights and Forecast - by Application
- 10.2.1. Soap and Detergents
- 10.2.2. Cosmetics and Toiletries
- 10.2.3. Fine Fragrances
- 10.2.4. Household Products
- 10.2.5. Food and Beverage
- 10.2.6. Other Applications
- 10.1. Market Analysis, Insights and Forecast - by Type
- 11. Middle East and Africa Aroma Chemicals Industry Analysis, Insights and Forecast, 2020-2032
- 11.1. Market Analysis, Insights and Forecast - by Type
- 11.1.1. Terpenes
- 11.1.2. Benzenoids
- 11.1.3. Musk Chemicals
- 11.1.4. Other Types
- 11.2. Market Analysis, Insights and Forecast - by Application
- 11.2.1. Soap and Detergents
- 11.2.2. Cosmetics and Toiletries
- 11.2.3. Fine Fragrances
- 11.2.4. Household Products
- 11.2.5. Food and Beverage
- 11.2.6. Other Applications
- 11.1. Market Analysis, Insights and Forecast - by Type
- 12. Competitive Analysis
- 12.1. Company Profiles
- 12.1.1 Hindustan Mint and Agro Products Pvt Ltd
- 12.1.1.1. Company Overview
- 12.1.1.2. Products
- 12.1.1.3. Company Financials
- 12.1.1.4. SWOT Analysis
- 12.1.2 Givaudan
- 12.1.2.1. Company Overview
- 12.1.2.2. Products
- 12.1.2.3. Company Financials
- 12.1.2.4. SWOT Analysis
- 12.1.3 Symrise
- 12.1.3.1. Company Overview
- 12.1.3.2. Products
- 12.1.3.3. Company Financials
- 12.1.3.4. SWOT Analysis
- 12.1.4 Kalpsutra Chemicals Pvt Ltd
- 12.1.4.1. Company Overview
- 12.1.4.2. Products
- 12.1.4.3. Company Financials
- 12.1.4.4. SWOT Analysis
- 12.1.5 Solvay
- 12.1.5.1. Company Overview
- 12.1.5.2. Products
- 12.1.5.3. Company Financials
- 12.1.5.4. SWOT Analysis
- 12.1.6 Takasago International Corporation
- 12.1.6.1. Company Overview
- 12.1.6.2. Products
- 12.1.6.3. Company Financials
- 12.1.6.4. SWOT Analysis
- 12.1.7 BASF SE
- 12.1.7.1. Company Overview
- 12.1.7.2. Products
- 12.1.7.3. Company Financials
- 12.1.7.4. SWOT Analysis
- 12.1.8 S H Kelkar And Company Limited
- 12.1.8.1. Company Overview
- 12.1.8.2. Products
- 12.1.8.3. Company Financials
- 12.1.8.4. SWOT Analysis
- 12.1.9 Robertet Group
- 12.1.9.1. Company Overview
- 12.1.9.2. Products
- 12.1.9.3. Company Financials
- 12.1.9.4. SWOT Analysis
- 12.1.10 DSM
- 12.1.10.1. Company Overview
- 12.1.10.2. Products
- 12.1.10.3. Company Financials
- 12.1.10.4. SWOT Analysis
- 12.1.11 Bell Flavors & Fragrances
- 12.1.11.1. Company Overview
- 12.1.11.2. Products
- 12.1.11.3. Company Financials
- 12.1.11.4. SWOT Analysis
- 12.1.12 Treatt Plc*List Not Exhaustive
- 12.1.12.1. Company Overview
- 12.1.12.2. Products
- 12.1.12.3. Company Financials
- 12.1.12.4. SWOT Analysis
- 12.1.13 Kao Corporation
- 12.1.13.1. Company Overview
- 12.1.13.2. Products
- 12.1.13.3. Company Financials
- 12.1.13.4. SWOT Analysis
- 12.1.14 Silverline Chemicals
- 12.1.14.1. Company Overview
- 12.1.14.2. Products
- 12.1.14.3. Company Financials
- 12.1.14.4. SWOT Analysis
- 12.1.1 Hindustan Mint and Agro Products Pvt Ltd
- 12.2. Market Entropy
- 12.2.1 Company's Key Areas Served
- 12.2.2 Recent Developments
- 12.3. Company Market Share Analysis 2025
- 12.3.1 Top 5 Companies Market Share Analysis
- 12.3.2 Top 3 Companies Market Share Analysis
- 12.4. List of Potential Customers
- 13. Research Methodology
List of Figures
- Figure 1: Global Aroma Chemicals Industry Revenue Breakdown (Million, %) by Region 2025 & 2033
- Figure 2: Asia Pacific Aroma Chemicals Industry Revenue (Million), by Type 2025 & 2033
- Figure 3: Asia Pacific Aroma Chemicals Industry Revenue Share (%), by Type 2025 & 2033
- Figure 4: Asia Pacific Aroma Chemicals Industry Revenue (Million), by Application 2025 & 2033
- Figure 5: Asia Pacific Aroma Chemicals Industry Revenue Share (%), by Application 2025 & 2033
- Figure 6: Asia Pacific Aroma Chemicals Industry Revenue (Million), by Country 2025 & 2033
- Figure 7: Asia Pacific Aroma Chemicals Industry Revenue Share (%), by Country 2025 & 2033
- Figure 8: North America Aroma Chemicals Industry Revenue (Million), by Type 2025 & 2033
- Figure 9: North America Aroma Chemicals Industry Revenue Share (%), by Type 2025 & 2033
- Figure 10: North America Aroma Chemicals Industry Revenue (Million), by Application 2025 & 2033
- Figure 11: North America Aroma Chemicals Industry Revenue Share (%), by Application 2025 & 2033
- Figure 12: North America Aroma Chemicals Industry Revenue (Million), by Country 2025 & 2033
- Figure 13: North America Aroma Chemicals Industry Revenue Share (%), by Country 2025 & 2033
- Figure 14: Europe Aroma Chemicals Industry Revenue (Million), by Type 2025 & 2033
- Figure 15: Europe Aroma Chemicals Industry Revenue Share (%), by Type 2025 & 2033
- Figure 16: Europe Aroma Chemicals Industry Revenue (Million), by Application 2025 & 2033
- Figure 17: Europe Aroma Chemicals Industry Revenue Share (%), by Application 2025 & 2033
- Figure 18: Europe Aroma Chemicals Industry Revenue (Million), by Country 2025 & 2033
- Figure 19: Europe Aroma Chemicals Industry Revenue Share (%), by Country 2025 & 2033
- Figure 20: South America Aroma Chemicals Industry Revenue (Million), by Type 2025 & 2033
- Figure 21: South America Aroma Chemicals Industry Revenue Share (%), by Type 2025 & 2033
- Figure 22: South America Aroma Chemicals Industry Revenue (Million), by Application 2025 & 2033
- Figure 23: South America Aroma Chemicals Industry Revenue Share (%), by Application 2025 & 2033
- Figure 24: South America Aroma Chemicals Industry Revenue (Million), by Country 2025 & 2033
- Figure 25: South America Aroma Chemicals Industry Revenue Share (%), by Country 2025 & 2033
- Figure 26: Middle East and Africa Aroma Chemicals Industry Revenue (Million), by Type 2025 & 2033
- Figure 27: Middle East and Africa Aroma Chemicals Industry Revenue Share (%), by Type 2025 & 2033
- Figure 28: Middle East and Africa Aroma Chemicals Industry Revenue (Million), by Application 2025 & 2033
- Figure 29: Middle East and Africa Aroma Chemicals Industry Revenue Share (%), by Application 2025 & 2033
- Figure 30: Middle East and Africa Aroma Chemicals Industry Revenue (Million), by Country 2025 & 2033
- Figure 31: Middle East and Africa Aroma Chemicals Industry Revenue Share (%), by Country 2025 & 2033
List of Tables
- Table 1: Global Aroma Chemicals Industry Revenue Million Forecast, by Type 2020 & 2033
- Table 2: Global Aroma Chemicals Industry Revenue Million Forecast, by Application 2020 & 2033
- Table 3: Global Aroma Chemicals Industry Revenue Million Forecast, by Region 2020 & 2033
- Table 4: Global Aroma Chemicals Industry Revenue Million Forecast, by Type 2020 & 2033
- Table 5: Global Aroma Chemicals Industry Revenue Million Forecast, by Application 2020 & 2033
- Table 6: Global Aroma Chemicals Industry Revenue Million Forecast, by Country 2020 & 2033
- Table 7: China Aroma Chemicals Industry Revenue (Million) Forecast, by Application 2020 & 2033
- Table 8: India Aroma Chemicals Industry Revenue (Million) Forecast, by Application 2020 & 2033
- Table 9: Japan Aroma Chemicals Industry Revenue (Million) Forecast, by Application 2020 & 2033
- Table 10: South Korea Aroma Chemicals Industry Revenue (Million) Forecast, by Application 2020 & 2033
- Table 11: Rest of Asia Pacific Aroma Chemicals Industry Revenue (Million) Forecast, by Application 2020 & 2033
- Table 12: Global Aroma Chemicals Industry Revenue Million Forecast, by Type 2020 & 2033
- Table 13: Global Aroma Chemicals Industry Revenue Million Forecast, by Application 2020 & 2033
- Table 14: Global Aroma Chemicals Industry Revenue Million Forecast, by Country 2020 & 2033
- Table 15: United States Aroma Chemicals Industry Revenue (Million) Forecast, by Application 2020 & 2033
- Table 16: Canada Aroma Chemicals Industry Revenue (Million) Forecast, by Application 2020 & 2033
- Table 17: Mexico Aroma Chemicals Industry Revenue (Million) Forecast, by Application 2020 & 2033
- Table 18: Global Aroma Chemicals Industry Revenue Million Forecast, by Type 2020 & 2033
- Table 19: Global Aroma Chemicals Industry Revenue Million Forecast, by Application 2020 & 2033
- Table 20: Global Aroma Chemicals Industry Revenue Million Forecast, by Country 2020 & 2033
- Table 21: Germany Aroma Chemicals Industry Revenue (Million) Forecast, by Application 2020 & 2033
- Table 22: United Kingdom Aroma Chemicals Industry Revenue (Million) Forecast, by Application 2020 & 2033
- Table 23: Italy Aroma Chemicals Industry Revenue (Million) Forecast, by Application 2020 & 2033
- Table 24: France Aroma Chemicals Industry Revenue (Million) Forecast, by Application 2020 & 2033
- Table 25: Rest of Europe Aroma Chemicals Industry Revenue (Million) Forecast, by Application 2020 & 2033
- Table 26: Global Aroma Chemicals Industry Revenue Million Forecast, by Type 2020 & 2033
- Table 27: Global Aroma Chemicals Industry Revenue Million Forecast, by Application 2020 & 2033
- Table 28: Global Aroma Chemicals Industry Revenue Million Forecast, by Country 2020 & 2033
- Table 29: Brazil Aroma Chemicals Industry Revenue (Million) Forecast, by Application 2020 & 2033
- Table 30: Argentina Aroma Chemicals Industry Revenue (Million) Forecast, by Application 2020 & 2033
- Table 31: Rest of South America Aroma Chemicals Industry Revenue (Million) Forecast, by Application 2020 & 2033
- Table 32: Global Aroma Chemicals Industry Revenue Million Forecast, by Type 2020 & 2033
- Table 33: Global Aroma Chemicals Industry Revenue Million Forecast, by Application 2020 & 2033
- Table 34: Global Aroma Chemicals Industry Revenue Million Forecast, by Country 2020 & 2033
- Table 35: Saudi Arabia Aroma Chemicals Industry Revenue (Million) Forecast, by Application 2020 & 2033
- Table 36: South Africa Aroma Chemicals Industry Revenue (Million) Forecast, by Application 2020 & 2033
- Table 37: Rest of Middle East and Africa Aroma Chemicals Industry Revenue (Million) Forecast, by Application 2020 & 2033
Frequently Asked Questions
1. What is the projected Compound Annual Growth Rate (CAGR) of the Aroma Chemicals Industry?
The projected CAGR is approximately 4.65%.
2. Which companies are prominent players in the Aroma Chemicals Industry?
Key companies in the market include Hindustan Mint and Agro Products Pvt Ltd, Givaudan, Symrise, Kalpsutra Chemicals Pvt Ltd, Solvay, Takasago International Corporation, BASF SE, S H Kelkar And Company Limited, Robertet Group, DSM, Bell Flavors & Fragrances, Treatt Plc*List Not Exhaustive, Kao Corporation, Silverline Chemicals.
3. What are the main segments of the Aroma Chemicals Industry?
The market segments include Type, Application.
4. Can you provide details about the market size?
The market size is estimated to be USD 4.66 Million as of 2022.
5. What are some drivers contributing to market growth?
Blooming Use in Fragrance Industry; Increasing advancements in the personal care products industries; Other Drivers.
6. What are the notable trends driving market growth?
Growing Demand from Fine Fragrances Application.
7. Are there any restraints impacting market growth?
High R&D Cost Coupled with Stringent Government Regulation; Other Restraints.
8. Can you provide examples of recent developments in the market?
Sept 2022: Solvay expanded the range of one of its flagship products, Rhovanil Natural CW, with three new natural flavors: Rhovanil Natural Delica, Alta, and Sublima. With these new products, the group will enable the F&B industry to make a cost-effective transition to natural products and respond to growing consumer expectations for healthier, safer, tastier, and more natural products.
9. What pricing options are available for accessing the report?
Pricing options include single-user, multi-user, and enterprise licenses priced at USD 4750, USD 5250, and USD 8750 respectively.
10. Is the market size provided in terms of value or volume?
The market size is provided in terms of value, measured in Million.
11. Are there any specific market keywords associated with the report?
Yes, the market keyword associated with the report is "Aroma Chemicals Industry," which aids in identifying and referencing the specific market segment covered.
12. How do I determine which pricing option suits my needs best?
The pricing options vary based on user requirements and access needs. Individual users may opt for single-user licenses, while businesses requiring broader access may choose multi-user or enterprise licenses for cost-effective access to the report.
13. Are there any additional resources or data provided in the Aroma Chemicals Industry report?
While the report offers comprehensive insights, it's advisable to review the specific contents or supplementary materials provided to ascertain if additional resources or data are available.
14. How can I stay updated on further developments or reports in the Aroma Chemicals Industry?
To stay informed about further developments, trends, and reports in the Aroma Chemicals Industry, consider subscribing to industry newsletters, following relevant companies and organizations, or regularly checking reputable industry news sources and publications.
Methodology
Step 1 - Identification of Relevant Samples Size from Population Database


Step 2 - Approaches for Defining Global Market Size (Value, Volume* & Price*)

Note*: In applicable scenarios
Step 3 - Data Sources
Primary Research
- Web Analytics
- Survey Reports
- Research Institute
- Latest Research Reports
- Opinion Leaders
Secondary Research
- Annual Reports
- White Paper
- Latest Press Release
- Industry Association
- Paid Database
- Investor Presentations

Step 4 - Data Triangulation
Involves using different sources of information in order to increase the validity of a study
These sources are likely to be stakeholders in a program - participants, other researchers, program staff, other community members, and so on.
Then we put all data in single framework & apply various statistical tools to find out the dynamic on the market.
During the analysis stage, feedback from the stakeholder groups would be compared to determine areas of agreement as well as areas of divergence