

Key Insights
The global Automotive Selective Catalytic Reduction (SCR) market is poised for substantial expansion, projected at $13.22 billion by 2025 and expected to grow at a Compound Annual Growth Rate (CAGR) of 11.8% through 2033. This growth is primarily propelled by increasingly stringent global emission regulations targeting nitrogen oxide (NOx) reduction from diesel vehicles. Key growth drivers include the rising adoption of diesel vehicles in emerging economies and the consistent enforcement of rigorous emission standards in developed markets. Technological innovations in SCR catalysts, such as advanced honeycomb, plate, and corrugated designs, are enhancing system efficiency and durability, further stimulating market demand. The automotive sector's unwavering commitment to environmental sustainability and the broadening application of SCR technology across diverse vehicle types, from heavy-duty trucks to passenger cars, are significant contributors to this upward trajectory.
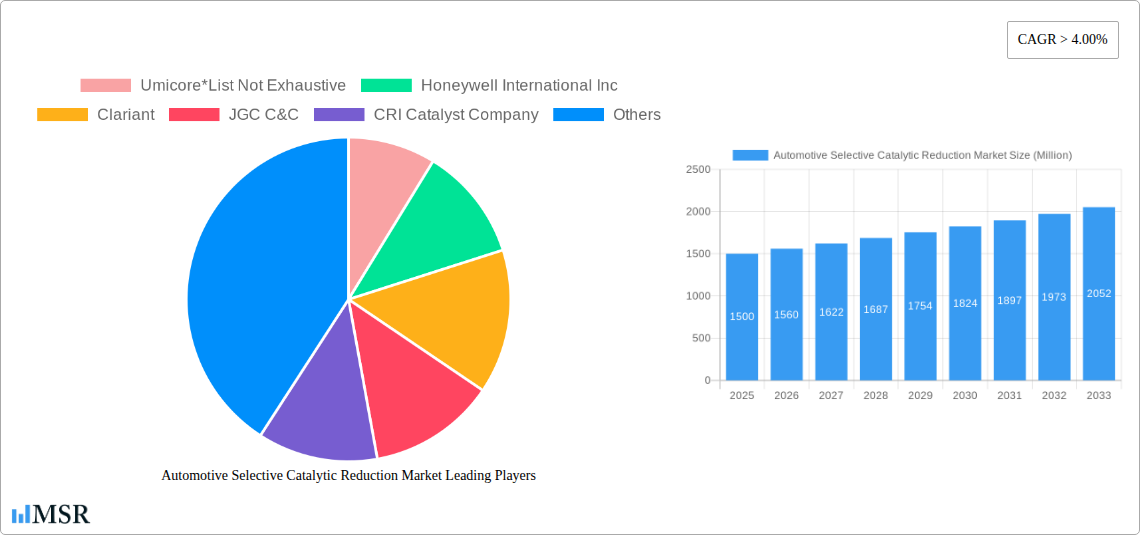
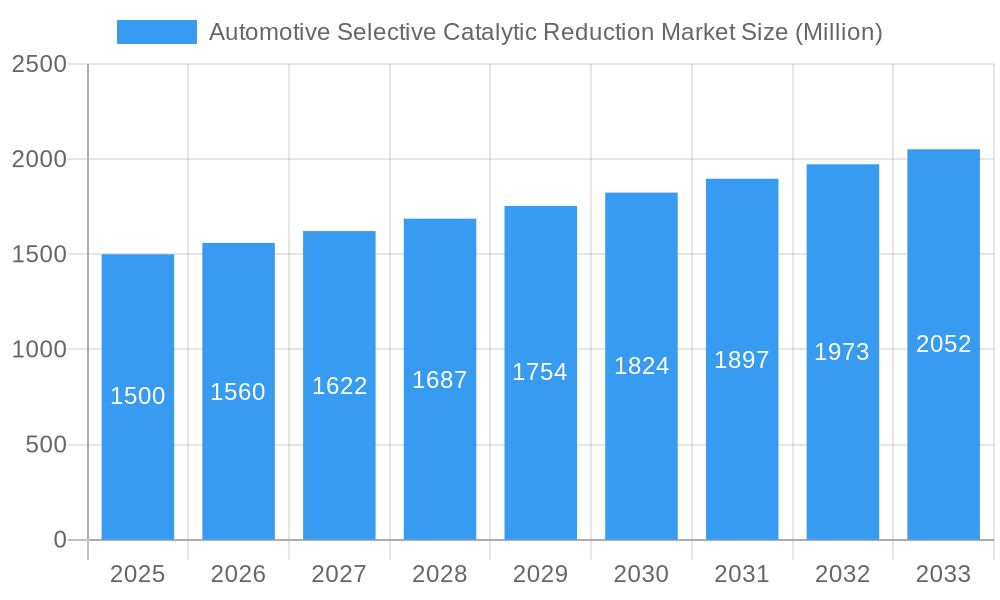
Automotive Selective Catalytic Reduction Market Market Size (In Billion)
Despite positive growth prospects, the market encounters obstacles. The initial investment cost of SCR systems can present a hurdle, particularly in price-sensitive regions. Optimal SCR performance is contingent upon fuel quality and diligent maintenance. Furthermore, price volatility of critical precious metals like platinum and palladium, essential for catalyst production, introduces financial risks. Nevertheless, the persistent drive for cleaner transportation and heightened global awareness of NOx-related environmental and health impacts ensure a robust long-term market outlook. The competitive arena features leading companies such as Umicore, Honeywell, Clariant, and Johnson Matthey, actively pursuing innovation and market leadership through strategic alliances and technological advancements. Market share distribution will likely mirror regional disparities in regulatory stringency and diesel vehicle penetration, with the Asia Pacific region anticipated to be a primary growth engine.
Automotive Selective Catalytic Reduction Market Company Market Share
Automotive Selective Catalytic Reduction Market Report: 2019-2033
This comprehensive report provides an in-depth analysis of the Automotive Selective Catalytic Reduction (SCR) market, offering invaluable insights for industry stakeholders, investors, and strategic decision-makers. Covering the period 2019-2033, with a base year of 2025 and a forecast period of 2025-2033, this report meticulously examines market dynamics, trends, key players, and future growth prospects. The global Automotive SCR market size is estimated at xx Million in 2025 and is projected to reach xx Million by 2033, exhibiting a CAGR of xx%.
Automotive Selective Catalytic Reduction Market Concentration & Dynamics
The Automotive Selective Catalytic Reduction market exhibits a moderately consolidated structure, with key players like Umicore, Honeywell International Inc, Clariant, and Johnson Matthey holding significant market share. However, the presence of several smaller, specialized companies fosters a dynamic competitive landscape. Innovation is driven by stringent emission regulations, pushing manufacturers to develop more efficient and cost-effective SCR systems. The regulatory environment plays a crucial role, with stricter emission standards in regions like Europe and North America significantly impacting market growth. Substitute technologies, such as Diesel Particulate Filters (DPFs) and other exhaust after-treatment solutions, present competitive pressures. End-user trends towards fuel efficiency and reduced emissions are key growth drivers. M&A activity has been moderate in recent years, with approximately xx deals recorded between 2019 and 2024, primarily focused on expanding technological capabilities and market reach.
- Market Share: Top 5 players hold approximately xx% of the market share (2025).
- M&A Activity: xx deals recorded between 2019 and 2024.
- Innovation Ecosystem: Significant R&D investments focused on improving SCR efficiency and reducing costs.
- Regulatory Framework: Stringent emission norms driving market growth, particularly in developed regions.
Automotive Selective Catalytic Reduction Market Industry Insights & Trends
The Automotive SCR market is experiencing robust growth, fueled by increasingly stringent global emission regulations, particularly concerning NOx emissions. The rising adoption of SCR technology across various vehicle segments, including heavy-duty vehicles and passenger cars, is a major contributor to this growth. Technological advancements, such as the development of more efficient catalysts and improved control systems, are further enhancing the market's appeal. Consumer demand for environmentally friendly vehicles is also driving the market's expansion. The market witnessed significant growth in the historical period (2019-2024), with a CAGR of xx%. This positive trend is expected to continue throughout the forecast period (2025-2033), driven by the factors mentioned above and increased awareness of environmental concerns. The market size is expected to grow from xx Million in 2025 to xx Million by 2033.
Key Markets & Segments Leading Automotive Selective Catalytic Reduction Market
The dominant segment within the Automotive SCR market is the Selective Catalytic Reduction (SCR) process type, accounting for over xx% of the market share in 2025. This is followed by Diesel Particulate Filters (DPFs) and Catalytic Oxidation. Geographically, North America and Europe are currently the leading regions, driven by stringent emission regulations and a large automotive industry. However, Asia-Pacific is expected to exhibit the highest growth rate during the forecast period due to rapid industrialization and urbanization. Within applications, the Power Generation (excluding coal-based) segment holds the largest market share, with the Industrial sector showing strong growth potential. Honeycomb catalysts are the dominant catalyst type.
Key Drivers:
- North America: Stringent emission regulations, robust automotive industry.
- Europe: High environmental awareness, strong government support for clean technologies.
- Asia-Pacific: Rapid industrialization and urbanization driving demand for efficient emission control.
- Industrial applications: Growing demand from various industries seeking emission control solutions.
Dominance Analysis: The dominance of SCR process type and the North American and European markets is largely attributed to their early adoption of stringent emission regulations and robust automotive industries.
Automotive Selective Catalytic Reduction Market Product Developments
Recent advancements in SCR technology include the development of more durable and efficient catalysts, improved control systems for optimized performance, and the integration of SCR with other after-treatment devices for enhanced emission reduction. These innovations are leading to improved fuel efficiency and reduced operational costs, making SCR technology increasingly attractive to manufacturers and consumers. New applications are also emerging, expanding the market into diverse sectors beyond traditional automotive applications.
Challenges in the Automotive Selective Catalytic Reduction Market Market
The Automotive SCR market faces challenges such as the high initial cost of SCR systems, the potential for ammonia slip (unconverted ammonia emissions), and the complex regulatory landscape that varies across different regions. Supply chain disruptions can impact the availability of raw materials and components, affecting production and pricing. Intense competition among existing players and the emergence of alternative emission control technologies also pose significant challenges. These factors, combined, potentially impact market growth by xx% in the forecast period.
Forces Driving Automotive Selective Catalytic Reduction Market Growth
Stringent government regulations mandating reduced NOx emissions, coupled with increasing consumer demand for fuel-efficient and eco-friendly vehicles are major drivers of market growth. Technological advancements leading to more efficient and cost-effective SCR systems also stimulate market expansion. The growing industrial sector further fuels demand for SCR solutions in various applications beyond the automotive industry.
Challenges in the Automotive Selective Catalytic Reduction Market Market (Long-Term Growth Catalysts)
Long-term growth is fueled by continuous technological innovation, focusing on enhancing SCR efficiency and reducing costs. Strategic partnerships and collaborations among industry players to develop advanced solutions are accelerating market growth. Expanding market penetration into emerging economies with stricter emission regulations represents a significant opportunity.
Emerging Opportunities in Automotive Selective Catalytic Reduction Market
Emerging markets, particularly in Asia and developing countries, present significant growth opportunities driven by increasing automotive production and stricter emission regulations. The development of innovative SCR systems for hybrid and electric vehicles opens up new market segments. Advanced catalyst materials and improved control strategies promise to enhance efficiency and reduce the environmental impact of SCR technology.
Leading Players in the Automotive Selective Catalytic Reduction Market Sector
- Umicore
- Honeywell International Inc
- Clariant
- JGC C&C
- CRI Catalyst Company
- DCL International Inc
- CDTi Advanced Materials Inc
- Hitachi Zosen Corporation
- CORMETECH
- BASF SE
- Cataler Corporation
- Johnson Matthey
- IBIDEN Porzellanfabrik Frauenthal
- Corning Incorporated
Key Milestones in Automotive Selective Catalytic Reduction Market Industry
- 2020: Introduction of new generation SCR catalysts with improved efficiency by Umicore.
- 2021: Honeywell International Inc. launches a new SCR system for heavy-duty vehicles.
- 2022: Johnson Matthey and Clariant form a strategic partnership to develop advanced catalyst technologies.
- 2023: New emission standards implemented in several major markets.
Strategic Outlook for Automotive Selective Catalytic Reduction Market Market
The Automotive SCR market holds significant future potential, driven by sustained demand for cleaner vehicles and industrial emissions control. Strategic opportunities lie in developing innovative SCR technologies, expanding into new markets, and forging strategic partnerships to enhance market penetration. Focusing on cost reduction and improved system performance will be crucial for future success.
Automotive Selective Catalytic Reduction Market Segmentation
-
1. Catalyst Type
- 1.1. Honeycomb Catalyst
- 1.2. Plate Catalyst
- 1.3. Corrugated Catalyst
-
2. Process Type
- 2.1. Selective Catalytic Reduction
- 2.2. Non-selective Catalytic Reduction
- 2.3. Diesel Particulate Filters
- 2.4. Catalytic Oxidation
-
3. Application
- 3.1. Power Generation (Excluding Coal based)
- 3.2. Coal-based Thermal Power Generation
- 3.3. Industrial
Automotive Selective Catalytic Reduction Market Segmentation By Geography
-
1. Asia Pacific
- 1.1. China
- 1.2. India
- 1.3. Japan
- 1.4. South Korea
- 1.5. ASEAN Countries
- 1.6. Rest of Asia Pacific
-
2. North America
- 2.1. United States
- 2.2. Canada
- 2.3. Mexico
-
3. Europe
- 3.1. Germany
- 3.2. United Kingdom
- 3.3. Italy
- 3.4. Russia
- 3.5. Rest of the Europe
-
4. South America
- 4.1. Brazil
- 4.2. Argentina
- 4.3. Rest of South America
-
5. Middle East and Africa
- 5.1. Saudi Arabia
- 5.2. South Africa
- 5.3. Rest of Middle East and Africa
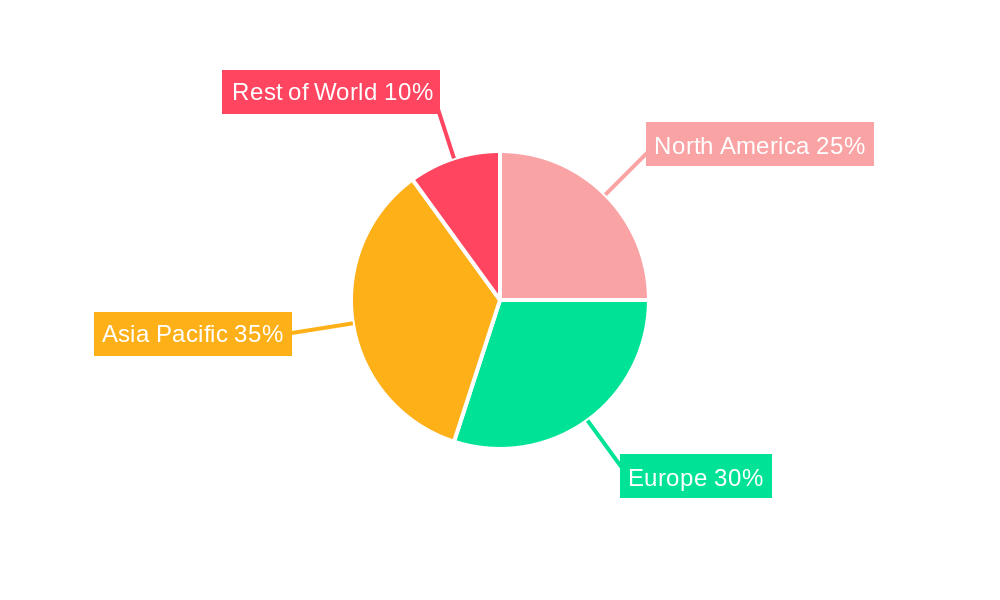
Automotive Selective Catalytic Reduction Market Regional Market Share
Geographic Coverage of Automotive Selective Catalytic Reduction Market
Automotive Selective Catalytic Reduction Market REPORT HIGHLIGHTS
| Aspects | Details |
|---|---|
| Study Period | 2020-2034 |
| Base Year | 2025 |
| Estimated Year | 2026 |
| Forecast Period | 2026-2034 |
| Historical Period | 2020-2025 |
| Growth Rate | CAGR of 11.8% from 2020-2034 |
| Segmentation |
|
Table of Contents
- 1. Introduction
- 1.1. Research Scope
- 1.2. Market Segmentation
- 1.3. Research Objective
- 1.4. Definitions and Assumptions
- 2. Executive Summary
- 2.1. Market Snapshot
- 3. Market Dynamics
- 3.1. Market Drivers
- 3.2. Market Restrains
- 3.3. Market Trends
- 3.4. Market Opportunities
- 4. Market Factor Analysis
- 4.1. Porters Five Forces
- 4.1.1. Bargaining Power of Suppliers
- 4.1.2. Bargaining Power of Buyers
- 4.1.3. Threat of New Entrants
- 4.1.4. Threat of Substitutes
- 4.1.5. Competitive Rivalry
- 4.2. PESTEL analysis
- 4.3. BCG Analysis
- 4.3.1. Stars (High Growth, High Market Share)
- 4.3.2. Cash Cows (Low Growth, High Market Share)
- 4.3.3. Question Mark (High Growth, Low Market Share)
- 4.3.4. Dogs (Low Growth, Low Market Share)
- 4.4. Ansoff Matrix Analysis
- 4.5. Supply Chain Analysis
- 4.6. Regulatory Landscape
- 4.7. Current Market Potential and Opportunity Assessment (TAM–SAM–SOM Framework)
- 4.8. MSR Analyst Note
- 4.1. Porters Five Forces
- 5. Market Analysis, Insights and Forecast 2021-2033
- 5.1. Market Analysis, Insights and Forecast - by Catalyst Type
- 5.1.1. Honeycomb Catalyst
- 5.1.2. Plate Catalyst
- 5.1.3. Corrugated Catalyst
- 5.2. Market Analysis, Insights and Forecast - by Process Type
- 5.2.1. Selective Catalytic Reduction
- 5.2.2. Non-selective Catalytic Reduction
- 5.2.3. Diesel Particulate Filters
- 5.2.4. Catalytic Oxidation
- 5.3. Market Analysis, Insights and Forecast - by Application
- 5.3.1. Power Generation (Excluding Coal based)
- 5.3.2. Coal-based Thermal Power Generation
- 5.3.3. Industrial
- 5.4. Market Analysis, Insights and Forecast - by Region
- 5.4.1. Asia Pacific
- 5.4.2. North America
- 5.4.3. Europe
- 5.4.4. South America
- 5.4.5. Middle East and Africa
- 5.1. Market Analysis, Insights and Forecast - by Catalyst Type
- 6. Global Automotive Selective Catalytic Reduction Market Analysis, Insights and Forecast, 2021-2033
- 6.1. Market Analysis, Insights and Forecast - by Catalyst Type
- 6.1.1. Honeycomb Catalyst
- 6.1.2. Plate Catalyst
- 6.1.3. Corrugated Catalyst
- 6.2. Market Analysis, Insights and Forecast - by Process Type
- 6.2.1. Selective Catalytic Reduction
- 6.2.2. Non-selective Catalytic Reduction
- 6.2.3. Diesel Particulate Filters
- 6.2.4. Catalytic Oxidation
- 6.3. Market Analysis, Insights and Forecast - by Application
- 6.3.1. Power Generation (Excluding Coal based)
- 6.3.2. Coal-based Thermal Power Generation
- 6.3.3. Industrial
- 6.1. Market Analysis, Insights and Forecast - by Catalyst Type
- 7. Asia Pacific Automotive Selective Catalytic Reduction Market Analysis, Insights and Forecast, 2020-2032
- 7.1. Market Analysis, Insights and Forecast - by Catalyst Type
- 7.1.1. Honeycomb Catalyst
- 7.1.2. Plate Catalyst
- 7.1.3. Corrugated Catalyst
- 7.2. Market Analysis, Insights and Forecast - by Process Type
- 7.2.1. Selective Catalytic Reduction
- 7.2.2. Non-selective Catalytic Reduction
- 7.2.3. Diesel Particulate Filters
- 7.2.4. Catalytic Oxidation
- 7.3. Market Analysis, Insights and Forecast - by Application
- 7.3.1. Power Generation (Excluding Coal based)
- 7.3.2. Coal-based Thermal Power Generation
- 7.3.3. Industrial
- 7.1. Market Analysis, Insights and Forecast - by Catalyst Type
- 8. North America Automotive Selective Catalytic Reduction Market Analysis, Insights and Forecast, 2020-2032
- 8.1. Market Analysis, Insights and Forecast - by Catalyst Type
- 8.1.1. Honeycomb Catalyst
- 8.1.2. Plate Catalyst
- 8.1.3. Corrugated Catalyst
- 8.2. Market Analysis, Insights and Forecast - by Process Type
- 8.2.1. Selective Catalytic Reduction
- 8.2.2. Non-selective Catalytic Reduction
- 8.2.3. Diesel Particulate Filters
- 8.2.4. Catalytic Oxidation
- 8.3. Market Analysis, Insights and Forecast - by Application
- 8.3.1. Power Generation (Excluding Coal based)
- 8.3.2. Coal-based Thermal Power Generation
- 8.3.3. Industrial
- 8.1. Market Analysis, Insights and Forecast - by Catalyst Type
- 9. Europe Automotive Selective Catalytic Reduction Market Analysis, Insights and Forecast, 2020-2032
- 9.1. Market Analysis, Insights and Forecast - by Catalyst Type
- 9.1.1. Honeycomb Catalyst
- 9.1.2. Plate Catalyst
- 9.1.3. Corrugated Catalyst
- 9.2. Market Analysis, Insights and Forecast - by Process Type
- 9.2.1. Selective Catalytic Reduction
- 9.2.2. Non-selective Catalytic Reduction
- 9.2.3. Diesel Particulate Filters
- 9.2.4. Catalytic Oxidation
- 9.3. Market Analysis, Insights and Forecast - by Application
- 9.3.1. Power Generation (Excluding Coal based)
- 9.3.2. Coal-based Thermal Power Generation
- 9.3.3. Industrial
- 9.1. Market Analysis, Insights and Forecast - by Catalyst Type
- 10. South America Automotive Selective Catalytic Reduction Market Analysis, Insights and Forecast, 2020-2032
- 10.1. Market Analysis, Insights and Forecast - by Catalyst Type
- 10.1.1. Honeycomb Catalyst
- 10.1.2. Plate Catalyst
- 10.1.3. Corrugated Catalyst
- 10.2. Market Analysis, Insights and Forecast - by Process Type
- 10.2.1. Selective Catalytic Reduction
- 10.2.2. Non-selective Catalytic Reduction
- 10.2.3. Diesel Particulate Filters
- 10.2.4. Catalytic Oxidation
- 10.3. Market Analysis, Insights and Forecast - by Application
- 10.3.1. Power Generation (Excluding Coal based)
- 10.3.2. Coal-based Thermal Power Generation
- 10.3.3. Industrial
- 10.1. Market Analysis, Insights and Forecast - by Catalyst Type
- 11. Middle East and Africa Automotive Selective Catalytic Reduction Market Analysis, Insights and Forecast, 2020-2032
- 11.1. Market Analysis, Insights and Forecast - by Catalyst Type
- 11.1.1. Honeycomb Catalyst
- 11.1.2. Plate Catalyst
- 11.1.3. Corrugated Catalyst
- 11.2. Market Analysis, Insights and Forecast - by Process Type
- 11.2.1. Selective Catalytic Reduction
- 11.2.2. Non-selective Catalytic Reduction
- 11.2.3. Diesel Particulate Filters
- 11.2.4. Catalytic Oxidation
- 11.3. Market Analysis, Insights and Forecast - by Application
- 11.3.1. Power Generation (Excluding Coal based)
- 11.3.2. Coal-based Thermal Power Generation
- 11.3.3. Industrial
- 11.1. Market Analysis, Insights and Forecast - by Catalyst Type
- 12. Competitive Analysis
- 12.1. Company Profiles
- 12.1.1 Umicore*List Not Exhaustive
- 12.1.1.1. Company Overview
- 12.1.1.2. Products
- 12.1.1.3. Company Financials
- 12.1.1.4. SWOT Analysis
- 12.1.2 Honeywell International Inc
- 12.1.2.1. Company Overview
- 12.1.2.2. Products
- 12.1.2.3. Company Financials
- 12.1.2.4. SWOT Analysis
- 12.1.3 Clariant
- 12.1.3.1. Company Overview
- 12.1.3.2. Products
- 12.1.3.3. Company Financials
- 12.1.3.4. SWOT Analysis
- 12.1.4 JGC C&C
- 12.1.4.1. Company Overview
- 12.1.4.2. Products
- 12.1.4.3. Company Financials
- 12.1.4.4. SWOT Analysis
- 12.1.5 CRI Catalyst Company
- 12.1.5.1. Company Overview
- 12.1.5.2. Products
- 12.1.5.3. Company Financials
- 12.1.5.4. SWOT Analysis
- 12.1.6 DCL International Inc
- 12.1.6.1. Company Overview
- 12.1.6.2. Products
- 12.1.6.3. Company Financials
- 12.1.6.4. SWOT Analysis
- 12.1.7 CDTi Advanced Materials Inc
- 12.1.7.1. Company Overview
- 12.1.7.2. Products
- 12.1.7.3. Company Financials
- 12.1.7.4. SWOT Analysis
- 12.1.8 Hitachi Zosen Corporation
- 12.1.8.1. Company Overview
- 12.1.8.2. Products
- 12.1.8.3. Company Financials
- 12.1.8.4. SWOT Analysis
- 12.1.9 CORMETECH
- 12.1.9.1. Company Overview
- 12.1.9.2. Products
- 12.1.9.3. Company Financials
- 12.1.9.4. SWOT Analysis
- 12.1.10 BASF SE
- 12.1.10.1. Company Overview
- 12.1.10.2. Products
- 12.1.10.3. Company Financials
- 12.1.10.4. SWOT Analysis
- 12.1.11 Cataler Corporation
- 12.1.11.1. Company Overview
- 12.1.11.2. Products
- 12.1.11.3. Company Financials
- 12.1.11.4. SWOT Analysis
- 12.1.12 Johnson Matthey
- 12.1.12.1. Company Overview
- 12.1.12.2. Products
- 12.1.12.3. Company Financials
- 12.1.12.4. SWOT Analysis
- 12.1.13 IBIDEN Porzellanfabrik Frauenthal
- 12.1.13.1. Company Overview
- 12.1.13.2. Products
- 12.1.13.3. Company Financials
- 12.1.13.4. SWOT Analysis
- 12.1.14 Corning Incorporated
- 12.1.14.1. Company Overview
- 12.1.14.2. Products
- 12.1.14.3. Company Financials
- 12.1.14.4. SWOT Analysis
- 12.1.1 Umicore*List Not Exhaustive
- 12.2. Market Entropy
- 12.2.1 Company's Key Areas Served
- 12.2.2 Recent Developments
- 12.3. Company Market Share Analysis 2025
- 12.3.1 Top 5 Companies Market Share Analysis
- 12.3.2 Top 3 Companies Market Share Analysis
- 12.4. List of Potential Customers
- 13. Research Methodology
List of Figures
- Figure 1: Global Automotive Selective Catalytic Reduction Market Revenue Breakdown (billion, %) by Region 2025 & 2033
- Figure 2: Asia Pacific Automotive Selective Catalytic Reduction Market Revenue (billion), by Catalyst Type 2025 & 2033
- Figure 3: Asia Pacific Automotive Selective Catalytic Reduction Market Revenue Share (%), by Catalyst Type 2025 & 2033
- Figure 4: Asia Pacific Automotive Selective Catalytic Reduction Market Revenue (billion), by Process Type 2025 & 2033
- Figure 5: Asia Pacific Automotive Selective Catalytic Reduction Market Revenue Share (%), by Process Type 2025 & 2033
- Figure 6: Asia Pacific Automotive Selective Catalytic Reduction Market Revenue (billion), by Application 2025 & 2033
- Figure 7: Asia Pacific Automotive Selective Catalytic Reduction Market Revenue Share (%), by Application 2025 & 2033
- Figure 8: Asia Pacific Automotive Selective Catalytic Reduction Market Revenue (billion), by Country 2025 & 2033
- Figure 9: Asia Pacific Automotive Selective Catalytic Reduction Market Revenue Share (%), by Country 2025 & 2033
- Figure 10: North America Automotive Selective Catalytic Reduction Market Revenue (billion), by Catalyst Type 2025 & 2033
- Figure 11: North America Automotive Selective Catalytic Reduction Market Revenue Share (%), by Catalyst Type 2025 & 2033
- Figure 12: North America Automotive Selective Catalytic Reduction Market Revenue (billion), by Process Type 2025 & 2033
- Figure 13: North America Automotive Selective Catalytic Reduction Market Revenue Share (%), by Process Type 2025 & 2033
- Figure 14: North America Automotive Selective Catalytic Reduction Market Revenue (billion), by Application 2025 & 2033
- Figure 15: North America Automotive Selective Catalytic Reduction Market Revenue Share (%), by Application 2025 & 2033
- Figure 16: North America Automotive Selective Catalytic Reduction Market Revenue (billion), by Country 2025 & 2033
- Figure 17: North America Automotive Selective Catalytic Reduction Market Revenue Share (%), by Country 2025 & 2033
- Figure 18: Europe Automotive Selective Catalytic Reduction Market Revenue (billion), by Catalyst Type 2025 & 2033
- Figure 19: Europe Automotive Selective Catalytic Reduction Market Revenue Share (%), by Catalyst Type 2025 & 2033
- Figure 20: Europe Automotive Selective Catalytic Reduction Market Revenue (billion), by Process Type 2025 & 2033
- Figure 21: Europe Automotive Selective Catalytic Reduction Market Revenue Share (%), by Process Type 2025 & 2033
- Figure 22: Europe Automotive Selective Catalytic Reduction Market Revenue (billion), by Application 2025 & 2033
- Figure 23: Europe Automotive Selective Catalytic Reduction Market Revenue Share (%), by Application 2025 & 2033
- Figure 24: Europe Automotive Selective Catalytic Reduction Market Revenue (billion), by Country 2025 & 2033
- Figure 25: Europe Automotive Selective Catalytic Reduction Market Revenue Share (%), by Country 2025 & 2033
- Figure 26: South America Automotive Selective Catalytic Reduction Market Revenue (billion), by Catalyst Type 2025 & 2033
- Figure 27: South America Automotive Selective Catalytic Reduction Market Revenue Share (%), by Catalyst Type 2025 & 2033
- Figure 28: South America Automotive Selective Catalytic Reduction Market Revenue (billion), by Process Type 2025 & 2033
- Figure 29: South America Automotive Selective Catalytic Reduction Market Revenue Share (%), by Process Type 2025 & 2033
- Figure 30: South America Automotive Selective Catalytic Reduction Market Revenue (billion), by Application 2025 & 2033
- Figure 31: South America Automotive Selective Catalytic Reduction Market Revenue Share (%), by Application 2025 & 2033
- Figure 32: South America Automotive Selective Catalytic Reduction Market Revenue (billion), by Country 2025 & 2033
- Figure 33: South America Automotive Selective Catalytic Reduction Market Revenue Share (%), by Country 2025 & 2033
- Figure 34: Middle East and Africa Automotive Selective Catalytic Reduction Market Revenue (billion), by Catalyst Type 2025 & 2033
- Figure 35: Middle East and Africa Automotive Selective Catalytic Reduction Market Revenue Share (%), by Catalyst Type 2025 & 2033
- Figure 36: Middle East and Africa Automotive Selective Catalytic Reduction Market Revenue (billion), by Process Type 2025 & 2033
- Figure 37: Middle East and Africa Automotive Selective Catalytic Reduction Market Revenue Share (%), by Process Type 2025 & 2033
- Figure 38: Middle East and Africa Automotive Selective Catalytic Reduction Market Revenue (billion), by Application 2025 & 2033
- Figure 39: Middle East and Africa Automotive Selective Catalytic Reduction Market Revenue Share (%), by Application 2025 & 2033
- Figure 40: Middle East and Africa Automotive Selective Catalytic Reduction Market Revenue (billion), by Country 2025 & 2033
- Figure 41: Middle East and Africa Automotive Selective Catalytic Reduction Market Revenue Share (%), by Country 2025 & 2033
List of Tables
- Table 1: Global Automotive Selective Catalytic Reduction Market Revenue billion Forecast, by Catalyst Type 2020 & 2033
- Table 2: Global Automotive Selective Catalytic Reduction Market Revenue billion Forecast, by Process Type 2020 & 2033
- Table 3: Global Automotive Selective Catalytic Reduction Market Revenue billion Forecast, by Application 2020 & 2033
- Table 4: Global Automotive Selective Catalytic Reduction Market Revenue billion Forecast, by Region 2020 & 2033
- Table 5: Global Automotive Selective Catalytic Reduction Market Revenue billion Forecast, by Catalyst Type 2020 & 2033
- Table 6: Global Automotive Selective Catalytic Reduction Market Revenue billion Forecast, by Process Type 2020 & 2033
- Table 7: Global Automotive Selective Catalytic Reduction Market Revenue billion Forecast, by Application 2020 & 2033
- Table 8: Global Automotive Selective Catalytic Reduction Market Revenue billion Forecast, by Country 2020 & 2033
- Table 9: China Automotive Selective Catalytic Reduction Market Revenue (billion) Forecast, by Application 2020 & 2033
- Table 10: India Automotive Selective Catalytic Reduction Market Revenue (billion) Forecast, by Application 2020 & 2033
- Table 11: Japan Automotive Selective Catalytic Reduction Market Revenue (billion) Forecast, by Application 2020 & 2033
- Table 12: South Korea Automotive Selective Catalytic Reduction Market Revenue (billion) Forecast, by Application 2020 & 2033
- Table 13: ASEAN Countries Automotive Selective Catalytic Reduction Market Revenue (billion) Forecast, by Application 2020 & 2033
- Table 14: Rest of Asia Pacific Automotive Selective Catalytic Reduction Market Revenue (billion) Forecast, by Application 2020 & 2033
- Table 15: Global Automotive Selective Catalytic Reduction Market Revenue billion Forecast, by Catalyst Type 2020 & 2033
- Table 16: Global Automotive Selective Catalytic Reduction Market Revenue billion Forecast, by Process Type 2020 & 2033
- Table 17: Global Automotive Selective Catalytic Reduction Market Revenue billion Forecast, by Application 2020 & 2033
- Table 18: Global Automotive Selective Catalytic Reduction Market Revenue billion Forecast, by Country 2020 & 2033
- Table 19: United States Automotive Selective Catalytic Reduction Market Revenue (billion) Forecast, by Application 2020 & 2033
- Table 20: Canada Automotive Selective Catalytic Reduction Market Revenue (billion) Forecast, by Application 2020 & 2033
- Table 21: Mexico Automotive Selective Catalytic Reduction Market Revenue (billion) Forecast, by Application 2020 & 2033
- Table 22: Global Automotive Selective Catalytic Reduction Market Revenue billion Forecast, by Catalyst Type 2020 & 2033
- Table 23: Global Automotive Selective Catalytic Reduction Market Revenue billion Forecast, by Process Type 2020 & 2033
- Table 24: Global Automotive Selective Catalytic Reduction Market Revenue billion Forecast, by Application 2020 & 2033
- Table 25: Global Automotive Selective Catalytic Reduction Market Revenue billion Forecast, by Country 2020 & 2033
- Table 26: Germany Automotive Selective Catalytic Reduction Market Revenue (billion) Forecast, by Application 2020 & 2033
- Table 27: United Kingdom Automotive Selective Catalytic Reduction Market Revenue (billion) Forecast, by Application 2020 & 2033
- Table 28: Italy Automotive Selective Catalytic Reduction Market Revenue (billion) Forecast, by Application 2020 & 2033
- Table 29: Russia Automotive Selective Catalytic Reduction Market Revenue (billion) Forecast, by Application 2020 & 2033
- Table 30: Rest of the Europe Automotive Selective Catalytic Reduction Market Revenue (billion) Forecast, by Application 2020 & 2033
- Table 31: Global Automotive Selective Catalytic Reduction Market Revenue billion Forecast, by Catalyst Type 2020 & 2033
- Table 32: Global Automotive Selective Catalytic Reduction Market Revenue billion Forecast, by Process Type 2020 & 2033
- Table 33: Global Automotive Selective Catalytic Reduction Market Revenue billion Forecast, by Application 2020 & 2033
- Table 34: Global Automotive Selective Catalytic Reduction Market Revenue billion Forecast, by Country 2020 & 2033
- Table 35: Brazil Automotive Selective Catalytic Reduction Market Revenue (billion) Forecast, by Application 2020 & 2033
- Table 36: Argentina Automotive Selective Catalytic Reduction Market Revenue (billion) Forecast, by Application 2020 & 2033
- Table 37: Rest of South America Automotive Selective Catalytic Reduction Market Revenue (billion) Forecast, by Application 2020 & 2033
- Table 38: Global Automotive Selective Catalytic Reduction Market Revenue billion Forecast, by Catalyst Type 2020 & 2033
- Table 39: Global Automotive Selective Catalytic Reduction Market Revenue billion Forecast, by Process Type 2020 & 2033
- Table 40: Global Automotive Selective Catalytic Reduction Market Revenue billion Forecast, by Application 2020 & 2033
- Table 41: Global Automotive Selective Catalytic Reduction Market Revenue billion Forecast, by Country 2020 & 2033
- Table 42: Saudi Arabia Automotive Selective Catalytic Reduction Market Revenue (billion) Forecast, by Application 2020 & 2033
- Table 43: South Africa Automotive Selective Catalytic Reduction Market Revenue (billion) Forecast, by Application 2020 & 2033
- Table 44: Rest of Middle East and Africa Automotive Selective Catalytic Reduction Market Revenue (billion) Forecast, by Application 2020 & 2033
Frequently Asked Questions
1. What is the projected Compound Annual Growth Rate (CAGR) of the Automotive Selective Catalytic Reduction Market?
The projected CAGR is approximately 11.8%.
2. Which companies are prominent players in the Automotive Selective Catalytic Reduction Market?
Key companies in the market include Umicore*List Not Exhaustive, Honeywell International Inc, Clariant, JGC C&C, CRI Catalyst Company, DCL International Inc, CDTi Advanced Materials Inc, Hitachi Zosen Corporation, CORMETECH, BASF SE, Cataler Corporation, Johnson Matthey, IBIDEN Porzellanfabrik Frauenthal, Corning Incorporated.
3. What are the main segments of the Automotive Selective Catalytic Reduction Market?
The market segments include Catalyst Type, Process Type, Application.
4. Can you provide details about the market size?
The market size is estimated to be USD 13.22 billion as of 2022.
5. What are some drivers contributing to market growth?
Increasing Demand due to Stringent Emission Standards of Developed Countries; Increasing Thermal Power Production Capacity in China and India.
6. What are the notable trends driving market growth?
Power Industry to Dominate the Market.
7. Are there any restraints impacting market growth?
Decline in Coal Based Thermal Power Generation in Western European Countries.
8. Can you provide examples of recent developments in the market?
N/A
9. What pricing options are available for accessing the report?
Pricing options include single-user, multi-user, and enterprise licenses priced at USD 4750, USD 5250, and USD 8750 respectively.
10. Is the market size provided in terms of value or volume?
The market size is provided in terms of value, measured in billion.
11. Are there any specific market keywords associated with the report?
Yes, the market keyword associated with the report is "Automotive Selective Catalytic Reduction Market," which aids in identifying and referencing the specific market segment covered.
12. How do I determine which pricing option suits my needs best?
The pricing options vary based on user requirements and access needs. Individual users may opt for single-user licenses, while businesses requiring broader access may choose multi-user or enterprise licenses for cost-effective access to the report.
13. Are there any additional resources or data provided in the Automotive Selective Catalytic Reduction Market report?
While the report offers comprehensive insights, it's advisable to review the specific contents or supplementary materials provided to ascertain if additional resources or data are available.
14. How can I stay updated on further developments or reports in the Automotive Selective Catalytic Reduction Market?
To stay informed about further developments, trends, and reports in the Automotive Selective Catalytic Reduction Market, consider subscribing to industry newsletters, following relevant companies and organizations, or regularly checking reputable industry news sources and publications.
Methodology
Step 1 - Identification of Relevant Samples Size from Population Database


Step 2 - Approaches for Defining Global Market Size (Value, Volume* & Price*)

Note*: In applicable scenarios
Step 3 - Data Sources
Primary Research
- Web Analytics
- Survey Reports
- Research Institute
- Latest Research Reports
- Opinion Leaders
Secondary Research
- Annual Reports
- White Paper
- Latest Press Release
- Industry Association
- Paid Database
- Investor Presentations

Step 4 - Data Triangulation
Involves using different sources of information in order to increase the validity of a study
These sources are likely to be stakeholders in a program - participants, other researchers, program staff, other community members, and so on.
Then we put all data in single framework & apply various statistical tools to find out the dynamic on the market.
During the analysis stage, feedback from the stakeholder groups would be compared to determine areas of agreement as well as areas of divergence