

Key Insights
The global beryllium market, valued at $231.5 million in 2025, is poised for robust expansion, projected to achieve a compound annual growth rate (CAGR) of 6.8% between 2025 and 2033. This growth is propelled by escalating demand across critical end-user sectors, notably aerospace and defense. Beryllium's exceptional strength-to-weight ratio, superior thermal conductivity, and dimensional stability make it indispensable for advanced applications such as high-speed aircraft and satellite components. The automotive industry also presents a significant opportunity, with the accelerating adoption of electric vehicles and lightweighting initiatives driving demand for beryllium alloys in components like brake systems and electric motor parts. Ongoing advancements in beryllium processing technologies and the development of novel beryllium-based composites further stimulate market growth. However, market expansion is moderated by inherent challenges, including beryllium's toxicity, stringent safety and disposal regulations, and its comparatively high cost. Consequently, continuous research into safer processing methods and the development of cost-effective alternatives are essential to navigate these constraints. Segment analysis indicates that aerospace and defense currently leads in market share, followed by the electronics and telecommunications sector. In terms of product type, beryllium alloys dominate the market, with a gradual increase anticipated in demand for ceramics due to their specialized applications. Geographically, North America and Asia-Pacific are expected to emerge as the primary growth regions, fueled by substantial industrial activity and technological innovation.
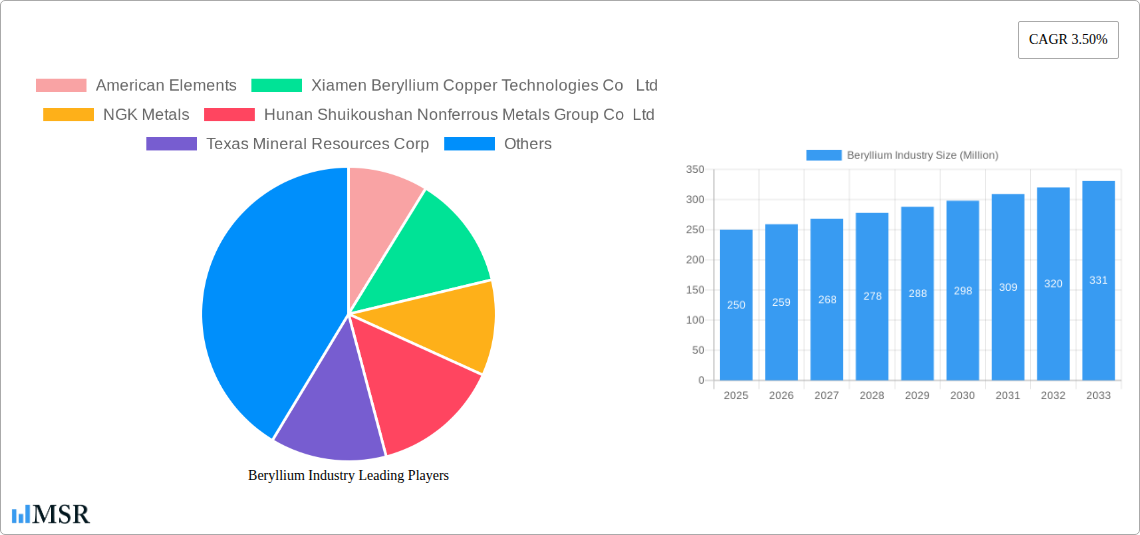
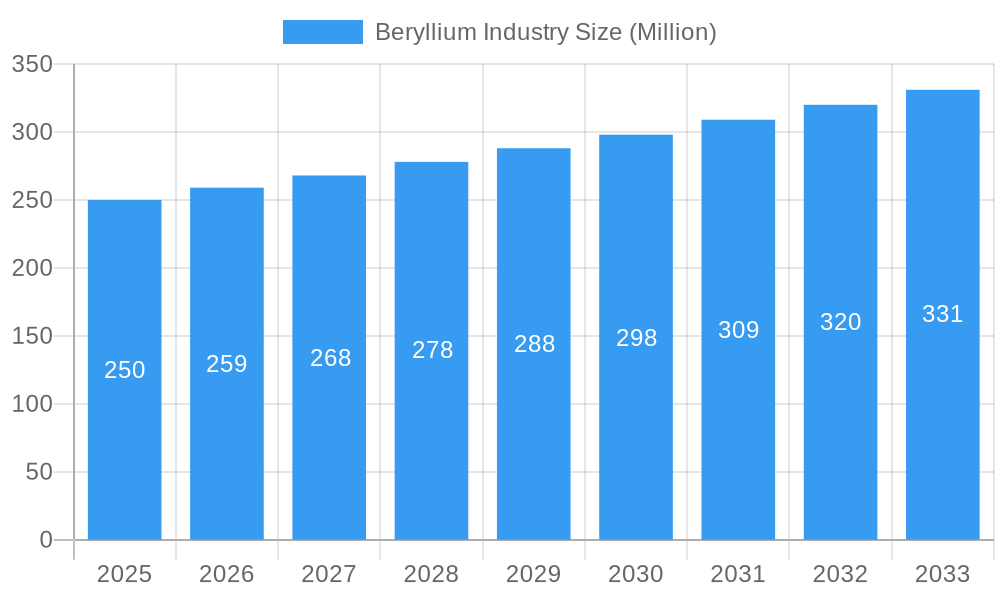
Beryllium Industry Market Size (In Million)
The future trajectory of the beryllium market is influenced by several key drivers. Innovations in materials science are expected to yield new beryllium alloys with enhanced properties and reduced toxicity. Government initiatives promoting lightweight materials across various industries will also bolster market expansion. Nevertheless, addressing beryllium's toxicity and cost concerns remains paramount for sustainable market growth. Companies are increasingly prioritizing sustainable and responsible sourcing practices for beryllium, alongside advancements in processing techniques to minimize environmental impact. The competitive landscape features a dynamic interplay between established industry leaders and emerging enterprises, fostering an innovative market environment. Strategic partnerships and collaborations are anticipated to play a crucial role in shaping the future of the beryllium industry.
Beryllium Industry Company Market Share
Beryllium Industry Market Report: 2019-2033 Forecast
This comprehensive report provides a detailed analysis of the global beryllium industry, offering invaluable insights for stakeholders across the value chain. With a study period spanning 2019-2033, a base year of 2025, and a forecast period of 2025-2033, this report meticulously examines market dynamics, key segments, leading players, and future growth prospects. The report covers a market valued at $XX Million in 2025, projected to reach $XX Million by 2033, exhibiting a CAGR of XX%.
Beryllium Industry Market Concentration & Dynamics
The beryllium industry demonstrates moderate market concentration, with a handful of key players holding significant market share. American Elements, Materion Corporation, and IBC Advanced Alloys are among the leading global producers, while regional players like Xiamen Beryllium Copper Technologies Co Ltd and Hunan Shuikoushan Nonferrous Metals Group Co Ltd hold substantial market positions within their respective geographies. The industry’s innovation ecosystem is characterized by ongoing R&D efforts focused on enhancing alloy properties, exploring new applications, and improving production processes. Regulatory frameworks, particularly concerning the handling and disposal of beryllium due to its toxicity, significantly impact industry operations. Substitute materials, while limited due to beryllium's unique properties, pose some competitive pressure, especially in specific applications. End-user trends, particularly in aerospace and defense, heavily influence market demand. M&A activity in the beryllium industry has been relatively modest in recent years, with a reported XX M&A deals over the past five years, indicating a focus on organic growth and operational efficiency improvements.
- Market Share (2025 Estimate): Materion Corporation (XX%), American Elements (XX%), IBC Advanced Alloys (XX%), Others (XX%)
- M&A Deal Count (2019-2024): XX
Beryllium Industry Insights & Trends
The global beryllium market is driven by robust demand from key sectors such as aerospace and defense, electronics, and healthcare. The increasing adoption of lightweight yet high-strength materials in aerospace applications, coupled with the rising demand for high-performance electronics, fuels significant market growth. Technological disruptions, such as advancements in additive manufacturing and improved alloy formulations, are expanding the application potential of beryllium. Evolving consumer behaviors, particularly a growing preference for smaller, lighter, and more energy-efficient devices, further drive demand. The market is also witnessing increased interest in sustainable and environmentally friendly beryllium extraction and processing methods. Overall, the industry displays strong potential for growth, driven by ongoing technological advancements and expanding end-user applications.
Key Markets & Segments Leading Beryllium Industry
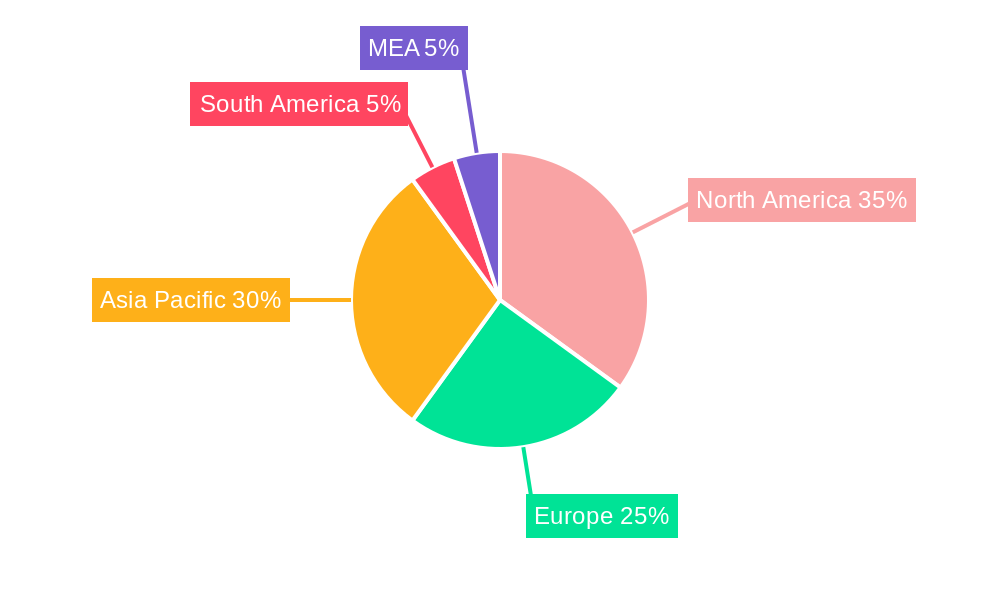
The Aerospace and Defense sector accounts for the largest share of beryllium consumption, driven by its unique properties crucial for high-performance aircraft and defense systems. Geographically, North America and Asia-Pacific are the dominant markets, fueled by strong industrial growth, technological advancements, and a large manufacturing base. Within product types, beryllium alloys dominate the market due to their superior strength-to-weight ratio and high thermal conductivity.
Key Drivers:
- Aerospace & Defense: High demand for lightweight, high-strength materials in aircraft and missile systems.
- Electronics: Growing use in high-frequency applications and advanced electronics.
- Healthcare: Demand for precision instruments and medical imaging equipment.
- Economic Growth: Positive economic outlook in key regions drives industrial growth and investment.
- Infrastructure Development: Expansion of infrastructure projects boosts demand for beryllium-based components.
Dominance Analysis: North America currently leads the beryllium market due to the strong presence of major manufacturers and substantial demand from the aerospace and defense sectors. However, Asia-Pacific is projected to witness rapid growth over the forecast period, driven by burgeoning electronics manufacturing and infrastructure development.
Beryllium Industry Product Developments
Recent advancements in beryllium processing technologies have led to the development of novel alloys with enhanced properties, such as improved machinability and corrosion resistance. These improvements are expanding the applications of beryllium in various industries, particularly in aerospace and electronics. Furthermore, the development of new composites incorporating beryllium enhances its performance and expands its market relevance across diversified applications. This focus on innovation is creating competitive advantages for producers who are able to offer superior products with enhanced performance and improved manufacturing processes.
Challenges in the Beryllium Industry Market
The beryllium industry faces several challenges, including stringent regulatory restrictions on beryllium handling due to its toxicity, resulting in increased production costs and logistical complexities. Supply chain disruptions, particularly disruptions to raw material sourcing and processing, can significantly impact production and market stability. The industry also experiences competitive pressure from substitute materials in certain applications. These factors collectively affect market growth potential.
Forces Driving Beryllium Industry Growth
Several factors are driving the growth of the beryllium industry. Advancements in material science and processing technologies lead to the development of new beryllium alloys with improved properties, expanding their applications. Strong economic growth in key markets (e.g., aerospace, electronics) drives demand. Government investments in research and development stimulate innovation within the industry.
Long-Term Growth Catalysts in the Beryllium Industry
Long-term growth is fueled by collaborations between industry players and research institutions to improve beryllium production and processing methods. This ensures a sustainable and cost-effective supply chain. Exploration of novel beryllium applications in emerging technologies (e.g., renewable energy) expands the market scope. Strategic partnerships and collaborations among industry players boost innovation and market expansion.
Emerging Opportunities in Beryllium Industry
Emerging opportunities exist in developing new beryllium-based composites with enhanced performance characteristics for aerospace and defense applications. Growth in the renewable energy sector creates demand for beryllium in advanced energy storage solutions. The expanding 5G infrastructure provides opportunities for using beryllium components in high-frequency applications.
Leading Players in the Beryllium Industry Sector
- American Elements
- Xiamen Beryllium Copper Technologies Co Ltd
- NGK Metals
- Hunan Shuikoushan Nonferrous Metals Group Co Ltd
- Texas Mineral Resources Corp
- Belmont Metals
- Tropag Oscar H Ritter Nachf GmbH
- National Atomic Company Kazatomprom
- IBC Advanced Alloys
- Materion Corporation
- American Beryllia Inc
Key Milestones in Beryllium Industry
- July 2022: Materion Corporation and Kairos Power jointly commissioned a Molten Salt Purification Plant (MSPP) for Flibe production, solidifying Materion's position as a key supplier in the burgeoning nuclear energy sector.
- April 2022: IBC Advanced Alloys launched copper alloy casting at its expanded Indiana facility, boosting its production capacity and market competitiveness.
Strategic Outlook for Beryllium Industry Market
The beryllium industry exhibits strong long-term growth potential driven by technological advancements, expanding applications across diverse sectors, and the increasing demand for lightweight and high-performance materials. Strategic partnerships, investments in R&D, and the development of sustainable production methods will further shape the industry's trajectory, leading to significant market expansion in the coming years.
Beryllium Industry Segmentation
-
1. Product Type
- 1.1. Alloys
- 1.2. Metals
- 1.3. Ceramics
- 1.4. Other Product Types
-
2. End-user Industry
- 2.1. Industrial Components
- 2.2. Automotive
- 2.3. Healthcare
- 2.4. Aerospace and Defense
- 2.5. Oil and Gas
- 2.6. Electronics and Telecommunication
- 2.7. Other End-user Industries
Beryllium Industry Segmentation By Geography
-
1. Asia Pacific
- 1.1. China
- 1.2. India
- 1.3. Japan
- 1.4. South Korea
- 1.5. Malaysia
- 1.6. Thailand
- 1.7. Indonesia
- 1.8. Vietnam
- 1.9. Rest of Asia Pacific
-
2. North America
- 2.1. United States
- 2.2. Canada
- 2.3. Mexico
-
3. Europe
- 3.1. Germany
- 3.2. United Kingdom
- 3.3. France
- 3.4. Italy
- 3.5. Spain
- 3.6. NORDIC Countries
- 3.7. Turkey
- 3.8. Russia
- 3.9. Rest of Europe
-
4. South America
- 4.1. Brazil
- 4.2. Argentina
- 4.3. Colombia
- 4.4. Rest of South America
-
5. Middle East and Africa
- 5.1. Saudi Arabia
- 5.2. Qatar
- 5.3. United Arab Emirates
- 5.4. Nigeria
- 5.5. Egypt
- 5.6. South Africa
- 5.7. Rest of Middle East and Africa
Beryllium Industry Regional Market Share
Geographic Coverage of Beryllium Industry
Beryllium Industry REPORT HIGHLIGHTS
| Aspects | Details |
|---|---|
| Study Period | 2020-2034 |
| Base Year | 2025 |
| Estimated Year | 2026 |
| Forecast Period | 2026-2034 |
| Historical Period | 2020-2025 |
| Growth Rate | CAGR of 6.8% from 2020-2034 |
| Segmentation |
|
Table of Contents
- 1. Introduction
- 1.1. Research Scope
- 1.2. Market Segmentation
- 1.3. Research Objective
- 1.4. Definitions and Assumptions
- 2. Executive Summary
- 2.1. Market Snapshot
- 3. Market Dynamics
- 3.1. Market Drivers
- 3.2. Market Restrains
- 3.3. Market Trends
- 3.4. Market Opportunities
- 4. Market Factor Analysis
- 4.1. Porters Five Forces
- 4.1.1. Bargaining Power of Suppliers
- 4.1.2. Bargaining Power of Buyers
- 4.1.3. Threat of New Entrants
- 4.1.4. Threat of Substitutes
- 4.1.5. Competitive Rivalry
- 4.2. PESTEL analysis
- 4.3. BCG Analysis
- 4.3.1. Stars (High Growth, High Market Share)
- 4.3.2. Cash Cows (Low Growth, High Market Share)
- 4.3.3. Question Mark (High Growth, Low Market Share)
- 4.3.4. Dogs (Low Growth, Low Market Share)
- 4.4. Ansoff Matrix Analysis
- 4.5. Supply Chain Analysis
- 4.6. Regulatory Landscape
- 4.7. Current Market Potential and Opportunity Assessment (TAM–SAM–SOM Framework)
- 4.8. MSR Analyst Note
- 4.1. Porters Five Forces
- 5. Market Analysis, Insights and Forecast 2021-2033
- 5.1. Market Analysis, Insights and Forecast - by Product Type
- 5.1.1. Alloys
- 5.1.2. Metals
- 5.1.3. Ceramics
- 5.1.4. Other Product Types
- 5.2. Market Analysis, Insights and Forecast - by End-user Industry
- 5.2.1. Industrial Components
- 5.2.2. Automotive
- 5.2.3. Healthcare
- 5.2.4. Aerospace and Defense
- 5.2.5. Oil and Gas
- 5.2.6. Electronics and Telecommunication
- 5.2.7. Other End-user Industries
- 5.3. Market Analysis, Insights and Forecast - by Region
- 5.3.1. Asia Pacific
- 5.3.2. North America
- 5.3.3. Europe
- 5.3.4. South America
- 5.3.5. Middle East and Africa
- 5.1. Market Analysis, Insights and Forecast - by Product Type
- 6. Global Beryllium Industry Analysis, Insights and Forecast, 2021-2033
- 6.1. Market Analysis, Insights and Forecast - by Product Type
- 6.1.1. Alloys
- 6.1.2. Metals
- 6.1.3. Ceramics
- 6.1.4. Other Product Types
- 6.2. Market Analysis, Insights and Forecast - by End-user Industry
- 6.2.1. Industrial Components
- 6.2.2. Automotive
- 6.2.3. Healthcare
- 6.2.4. Aerospace and Defense
- 6.2.5. Oil and Gas
- 6.2.6. Electronics and Telecommunication
- 6.2.7. Other End-user Industries
- 6.1. Market Analysis, Insights and Forecast - by Product Type
- 7. Asia Pacific Beryllium Industry Analysis, Insights and Forecast, 2020-2032
- 7.1. Market Analysis, Insights and Forecast - by Product Type
- 7.1.1. Alloys
- 7.1.2. Metals
- 7.1.3. Ceramics
- 7.1.4. Other Product Types
- 7.2. Market Analysis, Insights and Forecast - by End-user Industry
- 7.2.1. Industrial Components
- 7.2.2. Automotive
- 7.2.3. Healthcare
- 7.2.4. Aerospace and Defense
- 7.2.5. Oil and Gas
- 7.2.6. Electronics and Telecommunication
- 7.2.7. Other End-user Industries
- 7.1. Market Analysis, Insights and Forecast - by Product Type
- 8. North America Beryllium Industry Analysis, Insights and Forecast, 2020-2032
- 8.1. Market Analysis, Insights and Forecast - by Product Type
- 8.1.1. Alloys
- 8.1.2. Metals
- 8.1.3. Ceramics
- 8.1.4. Other Product Types
- 8.2. Market Analysis, Insights and Forecast - by End-user Industry
- 8.2.1. Industrial Components
- 8.2.2. Automotive
- 8.2.3. Healthcare
- 8.2.4. Aerospace and Defense
- 8.2.5. Oil and Gas
- 8.2.6. Electronics and Telecommunication
- 8.2.7. Other End-user Industries
- 8.1. Market Analysis, Insights and Forecast - by Product Type
- 9. Europe Beryllium Industry Analysis, Insights and Forecast, 2020-2032
- 9.1. Market Analysis, Insights and Forecast - by Product Type
- 9.1.1. Alloys
- 9.1.2. Metals
- 9.1.3. Ceramics
- 9.1.4. Other Product Types
- 9.2. Market Analysis, Insights and Forecast - by End-user Industry
- 9.2.1. Industrial Components
- 9.2.2. Automotive
- 9.2.3. Healthcare
- 9.2.4. Aerospace and Defense
- 9.2.5. Oil and Gas
- 9.2.6. Electronics and Telecommunication
- 9.2.7. Other End-user Industries
- 9.1. Market Analysis, Insights and Forecast - by Product Type
- 10. South America Beryllium Industry Analysis, Insights and Forecast, 2020-2032
- 10.1. Market Analysis, Insights and Forecast - by Product Type
- 10.1.1. Alloys
- 10.1.2. Metals
- 10.1.3. Ceramics
- 10.1.4. Other Product Types
- 10.2. Market Analysis, Insights and Forecast - by End-user Industry
- 10.2.1. Industrial Components
- 10.2.2. Automotive
- 10.2.3. Healthcare
- 10.2.4. Aerospace and Defense
- 10.2.5. Oil and Gas
- 10.2.6. Electronics and Telecommunication
- 10.2.7. Other End-user Industries
- 10.1. Market Analysis, Insights and Forecast - by Product Type
- 11. Middle East and Africa Beryllium Industry Analysis, Insights and Forecast, 2020-2032
- 11.1. Market Analysis, Insights and Forecast - by Product Type
- 11.1.1. Alloys
- 11.1.2. Metals
- 11.1.3. Ceramics
- 11.1.4. Other Product Types
- 11.2. Market Analysis, Insights and Forecast - by End-user Industry
- 11.2.1. Industrial Components
- 11.2.2. Automotive
- 11.2.3. Healthcare
- 11.2.4. Aerospace and Defense
- 11.2.5. Oil and Gas
- 11.2.6. Electronics and Telecommunication
- 11.2.7. Other End-user Industries
- 11.1. Market Analysis, Insights and Forecast - by Product Type
- 12. Competitive Analysis
- 12.1. Company Profiles
- 12.1.1 American Elements
- 12.1.1.1. Company Overview
- 12.1.1.2. Products
- 12.1.1.3. Company Financials
- 12.1.1.4. SWOT Analysis
- 12.1.2 Xiamen Beryllium Copper Technologies Co Ltd
- 12.1.2.1. Company Overview
- 12.1.2.2. Products
- 12.1.2.3. Company Financials
- 12.1.2.4. SWOT Analysis
- 12.1.3 NGK Metals
- 12.1.3.1. Company Overview
- 12.1.3.2. Products
- 12.1.3.3. Company Financials
- 12.1.3.4. SWOT Analysis
- 12.1.4 Hunan Shuikoushan Nonferrous Metals Group Co Ltd
- 12.1.4.1. Company Overview
- 12.1.4.2. Products
- 12.1.4.3. Company Financials
- 12.1.4.4. SWOT Analysis
- 12.1.5 Texas Mineral Resources Corp
- 12.1.5.1. Company Overview
- 12.1.5.2. Products
- 12.1.5.3. Company Financials
- 12.1.5.4. SWOT Analysis
- 12.1.6 Belmont Metals
- 12.1.6.1. Company Overview
- 12.1.6.2. Products
- 12.1.6.3. Company Financials
- 12.1.6.4. SWOT Analysis
- 12.1.7 Tropag Oscar H Ritter Nachf GmbH
- 12.1.7.1. Company Overview
- 12.1.7.2. Products
- 12.1.7.3. Company Financials
- 12.1.7.4. SWOT Analysis
- 12.1.8 National Atomic Company Kazatomprom
- 12.1.8.1. Company Overview
- 12.1.8.2. Products
- 12.1.8.3. Company Financials
- 12.1.8.4. SWOT Analysis
- 12.1.9 IBC Advanced Alloys
- 12.1.9.1. Company Overview
- 12.1.9.2. Products
- 12.1.9.3. Company Financials
- 12.1.9.4. SWOT Analysis
- 12.1.10 Materion Corporation
- 12.1.10.1. Company Overview
- 12.1.10.2. Products
- 12.1.10.3. Company Financials
- 12.1.10.4. SWOT Analysis
- 12.1.11 American Beryllia Inc
- 12.1.11.1. Company Overview
- 12.1.11.2. Products
- 12.1.11.3. Company Financials
- 12.1.11.4. SWOT Analysis
- 12.1.1 American Elements
- 12.2. Market Entropy
- 12.2.1 Company's Key Areas Served
- 12.2.2 Recent Developments
- 12.3. Company Market Share Analysis 2025
- 12.3.1 Top 5 Companies Market Share Analysis
- 12.3.2 Top 3 Companies Market Share Analysis
- 12.4. List of Potential Customers
- 13. Research Methodology
List of Figures
- Figure 1: Global Beryllium Industry Revenue Breakdown (million, %) by Region 2025 & 2033
- Figure 2: Global Beryllium Industry Volume Breakdown (K Tons, %) by Region 2025 & 2033
- Figure 3: Asia Pacific Beryllium Industry Revenue (million), by Product Type 2025 & 2033
- Figure 4: Asia Pacific Beryllium Industry Volume (K Tons), by Product Type 2025 & 2033
- Figure 5: Asia Pacific Beryllium Industry Revenue Share (%), by Product Type 2025 & 2033
- Figure 6: Asia Pacific Beryllium Industry Volume Share (%), by Product Type 2025 & 2033
- Figure 7: Asia Pacific Beryllium Industry Revenue (million), by End-user Industry 2025 & 2033
- Figure 8: Asia Pacific Beryllium Industry Volume (K Tons), by End-user Industry 2025 & 2033
- Figure 9: Asia Pacific Beryllium Industry Revenue Share (%), by End-user Industry 2025 & 2033
- Figure 10: Asia Pacific Beryllium Industry Volume Share (%), by End-user Industry 2025 & 2033
- Figure 11: Asia Pacific Beryllium Industry Revenue (million), by Country 2025 & 2033
- Figure 12: Asia Pacific Beryllium Industry Volume (K Tons), by Country 2025 & 2033
- Figure 13: Asia Pacific Beryllium Industry Revenue Share (%), by Country 2025 & 2033
- Figure 14: Asia Pacific Beryllium Industry Volume Share (%), by Country 2025 & 2033
- Figure 15: North America Beryllium Industry Revenue (million), by Product Type 2025 & 2033
- Figure 16: North America Beryllium Industry Volume (K Tons), by Product Type 2025 & 2033
- Figure 17: North America Beryllium Industry Revenue Share (%), by Product Type 2025 & 2033
- Figure 18: North America Beryllium Industry Volume Share (%), by Product Type 2025 & 2033
- Figure 19: North America Beryllium Industry Revenue (million), by End-user Industry 2025 & 2033
- Figure 20: North America Beryllium Industry Volume (K Tons), by End-user Industry 2025 & 2033
- Figure 21: North America Beryllium Industry Revenue Share (%), by End-user Industry 2025 & 2033
- Figure 22: North America Beryllium Industry Volume Share (%), by End-user Industry 2025 & 2033
- Figure 23: North America Beryllium Industry Revenue (million), by Country 2025 & 2033
- Figure 24: North America Beryllium Industry Volume (K Tons), by Country 2025 & 2033
- Figure 25: North America Beryllium Industry Revenue Share (%), by Country 2025 & 2033
- Figure 26: North America Beryllium Industry Volume Share (%), by Country 2025 & 2033
- Figure 27: Europe Beryllium Industry Revenue (million), by Product Type 2025 & 2033
- Figure 28: Europe Beryllium Industry Volume (K Tons), by Product Type 2025 & 2033
- Figure 29: Europe Beryllium Industry Revenue Share (%), by Product Type 2025 & 2033
- Figure 30: Europe Beryllium Industry Volume Share (%), by Product Type 2025 & 2033
- Figure 31: Europe Beryllium Industry Revenue (million), by End-user Industry 2025 & 2033
- Figure 32: Europe Beryllium Industry Volume (K Tons), by End-user Industry 2025 & 2033
- Figure 33: Europe Beryllium Industry Revenue Share (%), by End-user Industry 2025 & 2033
- Figure 34: Europe Beryllium Industry Volume Share (%), by End-user Industry 2025 & 2033
- Figure 35: Europe Beryllium Industry Revenue (million), by Country 2025 & 2033
- Figure 36: Europe Beryllium Industry Volume (K Tons), by Country 2025 & 2033
- Figure 37: Europe Beryllium Industry Revenue Share (%), by Country 2025 & 2033
- Figure 38: Europe Beryllium Industry Volume Share (%), by Country 2025 & 2033
- Figure 39: South America Beryllium Industry Revenue (million), by Product Type 2025 & 2033
- Figure 40: South America Beryllium Industry Volume (K Tons), by Product Type 2025 & 2033
- Figure 41: South America Beryllium Industry Revenue Share (%), by Product Type 2025 & 2033
- Figure 42: South America Beryllium Industry Volume Share (%), by Product Type 2025 & 2033
- Figure 43: South America Beryllium Industry Revenue (million), by End-user Industry 2025 & 2033
- Figure 44: South America Beryllium Industry Volume (K Tons), by End-user Industry 2025 & 2033
- Figure 45: South America Beryllium Industry Revenue Share (%), by End-user Industry 2025 & 2033
- Figure 46: South America Beryllium Industry Volume Share (%), by End-user Industry 2025 & 2033
- Figure 47: South America Beryllium Industry Revenue (million), by Country 2025 & 2033
- Figure 48: South America Beryllium Industry Volume (K Tons), by Country 2025 & 2033
- Figure 49: South America Beryllium Industry Revenue Share (%), by Country 2025 & 2033
- Figure 50: South America Beryllium Industry Volume Share (%), by Country 2025 & 2033
- Figure 51: Middle East and Africa Beryllium Industry Revenue (million), by Product Type 2025 & 2033
- Figure 52: Middle East and Africa Beryllium Industry Volume (K Tons), by Product Type 2025 & 2033
- Figure 53: Middle East and Africa Beryllium Industry Revenue Share (%), by Product Type 2025 & 2033
- Figure 54: Middle East and Africa Beryllium Industry Volume Share (%), by Product Type 2025 & 2033
- Figure 55: Middle East and Africa Beryllium Industry Revenue (million), by End-user Industry 2025 & 2033
- Figure 56: Middle East and Africa Beryllium Industry Volume (K Tons), by End-user Industry 2025 & 2033
- Figure 57: Middle East and Africa Beryllium Industry Revenue Share (%), by End-user Industry 2025 & 2033
- Figure 58: Middle East and Africa Beryllium Industry Volume Share (%), by End-user Industry 2025 & 2033
- Figure 59: Middle East and Africa Beryllium Industry Revenue (million), by Country 2025 & 2033
- Figure 60: Middle East and Africa Beryllium Industry Volume (K Tons), by Country 2025 & 2033
- Figure 61: Middle East and Africa Beryllium Industry Revenue Share (%), by Country 2025 & 2033
- Figure 62: Middle East and Africa Beryllium Industry Volume Share (%), by Country 2025 & 2033
List of Tables
- Table 1: Global Beryllium Industry Revenue million Forecast, by Product Type 2020 & 2033
- Table 2: Global Beryllium Industry Volume K Tons Forecast, by Product Type 2020 & 2033
- Table 3: Global Beryllium Industry Revenue million Forecast, by End-user Industry 2020 & 2033
- Table 4: Global Beryllium Industry Volume K Tons Forecast, by End-user Industry 2020 & 2033
- Table 5: Global Beryllium Industry Revenue million Forecast, by Region 2020 & 2033
- Table 6: Global Beryllium Industry Volume K Tons Forecast, by Region 2020 & 2033
- Table 7: Global Beryllium Industry Revenue million Forecast, by Product Type 2020 & 2033
- Table 8: Global Beryllium Industry Volume K Tons Forecast, by Product Type 2020 & 2033
- Table 9: Global Beryllium Industry Revenue million Forecast, by End-user Industry 2020 & 2033
- Table 10: Global Beryllium Industry Volume K Tons Forecast, by End-user Industry 2020 & 2033
- Table 11: Global Beryllium Industry Revenue million Forecast, by Country 2020 & 2033
- Table 12: Global Beryllium Industry Volume K Tons Forecast, by Country 2020 & 2033
- Table 13: China Beryllium Industry Revenue (million) Forecast, by Application 2020 & 2033
- Table 14: China Beryllium Industry Volume (K Tons) Forecast, by Application 2020 & 2033
- Table 15: India Beryllium Industry Revenue (million) Forecast, by Application 2020 & 2033
- Table 16: India Beryllium Industry Volume (K Tons) Forecast, by Application 2020 & 2033
- Table 17: Japan Beryllium Industry Revenue (million) Forecast, by Application 2020 & 2033
- Table 18: Japan Beryllium Industry Volume (K Tons) Forecast, by Application 2020 & 2033
- Table 19: South Korea Beryllium Industry Revenue (million) Forecast, by Application 2020 & 2033
- Table 20: South Korea Beryllium Industry Volume (K Tons) Forecast, by Application 2020 & 2033
- Table 21: Malaysia Beryllium Industry Revenue (million) Forecast, by Application 2020 & 2033
- Table 22: Malaysia Beryllium Industry Volume (K Tons) Forecast, by Application 2020 & 2033
- Table 23: Thailand Beryllium Industry Revenue (million) Forecast, by Application 2020 & 2033
- Table 24: Thailand Beryllium Industry Volume (K Tons) Forecast, by Application 2020 & 2033
- Table 25: Indonesia Beryllium Industry Revenue (million) Forecast, by Application 2020 & 2033
- Table 26: Indonesia Beryllium Industry Volume (K Tons) Forecast, by Application 2020 & 2033
- Table 27: Vietnam Beryllium Industry Revenue (million) Forecast, by Application 2020 & 2033
- Table 28: Vietnam Beryllium Industry Volume (K Tons) Forecast, by Application 2020 & 2033
- Table 29: Rest of Asia Pacific Beryllium Industry Revenue (million) Forecast, by Application 2020 & 2033
- Table 30: Rest of Asia Pacific Beryllium Industry Volume (K Tons) Forecast, by Application 2020 & 2033
- Table 31: Global Beryllium Industry Revenue million Forecast, by Product Type 2020 & 2033
- Table 32: Global Beryllium Industry Volume K Tons Forecast, by Product Type 2020 & 2033
- Table 33: Global Beryllium Industry Revenue million Forecast, by End-user Industry 2020 & 2033
- Table 34: Global Beryllium Industry Volume K Tons Forecast, by End-user Industry 2020 & 2033
- Table 35: Global Beryllium Industry Revenue million Forecast, by Country 2020 & 2033
- Table 36: Global Beryllium Industry Volume K Tons Forecast, by Country 2020 & 2033
- Table 37: United States Beryllium Industry Revenue (million) Forecast, by Application 2020 & 2033
- Table 38: United States Beryllium Industry Volume (K Tons) Forecast, by Application 2020 & 2033
- Table 39: Canada Beryllium Industry Revenue (million) Forecast, by Application 2020 & 2033
- Table 40: Canada Beryllium Industry Volume (K Tons) Forecast, by Application 2020 & 2033
- Table 41: Mexico Beryllium Industry Revenue (million) Forecast, by Application 2020 & 2033
- Table 42: Mexico Beryllium Industry Volume (K Tons) Forecast, by Application 2020 & 2033
- Table 43: Global Beryllium Industry Revenue million Forecast, by Product Type 2020 & 2033
- Table 44: Global Beryllium Industry Volume K Tons Forecast, by Product Type 2020 & 2033
- Table 45: Global Beryllium Industry Revenue million Forecast, by End-user Industry 2020 & 2033
- Table 46: Global Beryllium Industry Volume K Tons Forecast, by End-user Industry 2020 & 2033
- Table 47: Global Beryllium Industry Revenue million Forecast, by Country 2020 & 2033
- Table 48: Global Beryllium Industry Volume K Tons Forecast, by Country 2020 & 2033
- Table 49: Germany Beryllium Industry Revenue (million) Forecast, by Application 2020 & 2033
- Table 50: Germany Beryllium Industry Volume (K Tons) Forecast, by Application 2020 & 2033
- Table 51: United Kingdom Beryllium Industry Revenue (million) Forecast, by Application 2020 & 2033
- Table 52: United Kingdom Beryllium Industry Volume (K Tons) Forecast, by Application 2020 & 2033
- Table 53: France Beryllium Industry Revenue (million) Forecast, by Application 2020 & 2033
- Table 54: France Beryllium Industry Volume (K Tons) Forecast, by Application 2020 & 2033
- Table 55: Italy Beryllium Industry Revenue (million) Forecast, by Application 2020 & 2033
- Table 56: Italy Beryllium Industry Volume (K Tons) Forecast, by Application 2020 & 2033
- Table 57: Spain Beryllium Industry Revenue (million) Forecast, by Application 2020 & 2033
- Table 58: Spain Beryllium Industry Volume (K Tons) Forecast, by Application 2020 & 2033
- Table 59: NORDIC Countries Beryllium Industry Revenue (million) Forecast, by Application 2020 & 2033
- Table 60: NORDIC Countries Beryllium Industry Volume (K Tons) Forecast, by Application 2020 & 2033
- Table 61: Turkey Beryllium Industry Revenue (million) Forecast, by Application 2020 & 2033
- Table 62: Turkey Beryllium Industry Volume (K Tons) Forecast, by Application 2020 & 2033
- Table 63: Russia Beryllium Industry Revenue (million) Forecast, by Application 2020 & 2033
- Table 64: Russia Beryllium Industry Volume (K Tons) Forecast, by Application 2020 & 2033
- Table 65: Rest of Europe Beryllium Industry Revenue (million) Forecast, by Application 2020 & 2033
- Table 66: Rest of Europe Beryllium Industry Volume (K Tons) Forecast, by Application 2020 & 2033
- Table 67: Global Beryllium Industry Revenue million Forecast, by Product Type 2020 & 2033
- Table 68: Global Beryllium Industry Volume K Tons Forecast, by Product Type 2020 & 2033
- Table 69: Global Beryllium Industry Revenue million Forecast, by End-user Industry 2020 & 2033
- Table 70: Global Beryllium Industry Volume K Tons Forecast, by End-user Industry 2020 & 2033
- Table 71: Global Beryllium Industry Revenue million Forecast, by Country 2020 & 2033
- Table 72: Global Beryllium Industry Volume K Tons Forecast, by Country 2020 & 2033
- Table 73: Brazil Beryllium Industry Revenue (million) Forecast, by Application 2020 & 2033
- Table 74: Brazil Beryllium Industry Volume (K Tons) Forecast, by Application 2020 & 2033
- Table 75: Argentina Beryllium Industry Revenue (million) Forecast, by Application 2020 & 2033
- Table 76: Argentina Beryllium Industry Volume (K Tons) Forecast, by Application 2020 & 2033
- Table 77: Colombia Beryllium Industry Revenue (million) Forecast, by Application 2020 & 2033
- Table 78: Colombia Beryllium Industry Volume (K Tons) Forecast, by Application 2020 & 2033
- Table 79: Rest of South America Beryllium Industry Revenue (million) Forecast, by Application 2020 & 2033
- Table 80: Rest of South America Beryllium Industry Volume (K Tons) Forecast, by Application 2020 & 2033
- Table 81: Global Beryllium Industry Revenue million Forecast, by Product Type 2020 & 2033
- Table 82: Global Beryllium Industry Volume K Tons Forecast, by Product Type 2020 & 2033
- Table 83: Global Beryllium Industry Revenue million Forecast, by End-user Industry 2020 & 2033
- Table 84: Global Beryllium Industry Volume K Tons Forecast, by End-user Industry 2020 & 2033
- Table 85: Global Beryllium Industry Revenue million Forecast, by Country 2020 & 2033
- Table 86: Global Beryllium Industry Volume K Tons Forecast, by Country 2020 & 2033
- Table 87: Saudi Arabia Beryllium Industry Revenue (million) Forecast, by Application 2020 & 2033
- Table 88: Saudi Arabia Beryllium Industry Volume (K Tons) Forecast, by Application 2020 & 2033
- Table 89: Qatar Beryllium Industry Revenue (million) Forecast, by Application 2020 & 2033
- Table 90: Qatar Beryllium Industry Volume (K Tons) Forecast, by Application 2020 & 2033
- Table 91: United Arab Emirates Beryllium Industry Revenue (million) Forecast, by Application 2020 & 2033
- Table 92: United Arab Emirates Beryllium Industry Volume (K Tons) Forecast, by Application 2020 & 2033
- Table 93: Nigeria Beryllium Industry Revenue (million) Forecast, by Application 2020 & 2033
- Table 94: Nigeria Beryllium Industry Volume (K Tons) Forecast, by Application 2020 & 2033
- Table 95: Egypt Beryllium Industry Revenue (million) Forecast, by Application 2020 & 2033
- Table 96: Egypt Beryllium Industry Volume (K Tons) Forecast, by Application 2020 & 2033
- Table 97: South Africa Beryllium Industry Revenue (million) Forecast, by Application 2020 & 2033
- Table 98: South Africa Beryllium Industry Volume (K Tons) Forecast, by Application 2020 & 2033
- Table 99: Rest of Middle East and Africa Beryllium Industry Revenue (million) Forecast, by Application 2020 & 2033
- Table 100: Rest of Middle East and Africa Beryllium Industry Volume (K Tons) Forecast, by Application 2020 & 2033
Frequently Asked Questions
1. What is the projected Compound Annual Growth Rate (CAGR) of the Beryllium Industry?
The projected CAGR is approximately 6.8%.
2. Which companies are prominent players in the Beryllium Industry?
Key companies in the market include American Elements, Xiamen Beryllium Copper Technologies Co Ltd , NGK Metals, Hunan Shuikoushan Nonferrous Metals Group Co Ltd, Texas Mineral Resources Corp, Belmont Metals, Tropag Oscar H Ritter Nachf GmbH, National Atomic Company Kazatomprom, IBC Advanced Alloys, Materion Corporation, American Beryllia Inc.
3. What are the main segments of the Beryllium Industry?
The market segments include Product Type, End-user Industry.
4. Can you provide details about the market size?
The market size is estimated to be USD 231.5 million as of 2022.
5. What are some drivers contributing to market growth?
Extensive Usage of Beryllium Alloys in Aerospace and Military Applications; Increasing Usage in Medical Equipment Owing to its Superior Properties.
6. What are the notable trends driving market growth?
Automotive Segment to Drive the Market Growth.
7. Are there any restraints impacting market growth?
Competition from Potential Alternatives.
8. Can you provide examples of recent developments in the market?
July 2022: Materion Corporation jointly commissioned a Molten Salt Purification Plant (MSPP) with Kairos Power at Materion's location in Elmore, Ohio, for the commercial production of Flibe, a molten salt coolant used in nuclear energy production. Materion is the only domestic supplier of the beryllium fluoride component for Flibe, a key component of this energy solution.
9. What pricing options are available for accessing the report?
Pricing options include single-user, multi-user, and enterprise licenses priced at USD 4750, USD 5250, and USD 8750 respectively.
10. Is the market size provided in terms of value or volume?
The market size is provided in terms of value, measured in million and volume, measured in K Tons.
11. Are there any specific market keywords associated with the report?
Yes, the market keyword associated with the report is "Beryllium Industry," which aids in identifying and referencing the specific market segment covered.
12. How do I determine which pricing option suits my needs best?
The pricing options vary based on user requirements and access needs. Individual users may opt for single-user licenses, while businesses requiring broader access may choose multi-user or enterprise licenses for cost-effective access to the report.
13. Are there any additional resources or data provided in the Beryllium Industry report?
While the report offers comprehensive insights, it's advisable to review the specific contents or supplementary materials provided to ascertain if additional resources or data are available.
14. How can I stay updated on further developments or reports in the Beryllium Industry?
To stay informed about further developments, trends, and reports in the Beryllium Industry, consider subscribing to industry newsletters, following relevant companies and organizations, or regularly checking reputable industry news sources and publications.
Methodology
Step 1 - Identification of Relevant Samples Size from Population Database


Step 2 - Approaches for Defining Global Market Size (Value, Volume* & Price*)

Note*: In applicable scenarios
Step 3 - Data Sources
Primary Research
- Web Analytics
- Survey Reports
- Research Institute
- Latest Research Reports
- Opinion Leaders
Secondary Research
- Annual Reports
- White Paper
- Latest Press Release
- Industry Association
- Paid Database
- Investor Presentations

Step 4 - Data Triangulation
Involves using different sources of information in order to increase the validity of a study
These sources are likely to be stakeholders in a program - participants, other researchers, program staff, other community members, and so on.
Then we put all data in single framework & apply various statistical tools to find out the dynamic on the market.
During the analysis stage, feedback from the stakeholder groups would be compared to determine areas of agreement as well as areas of divergence