

Key Insights
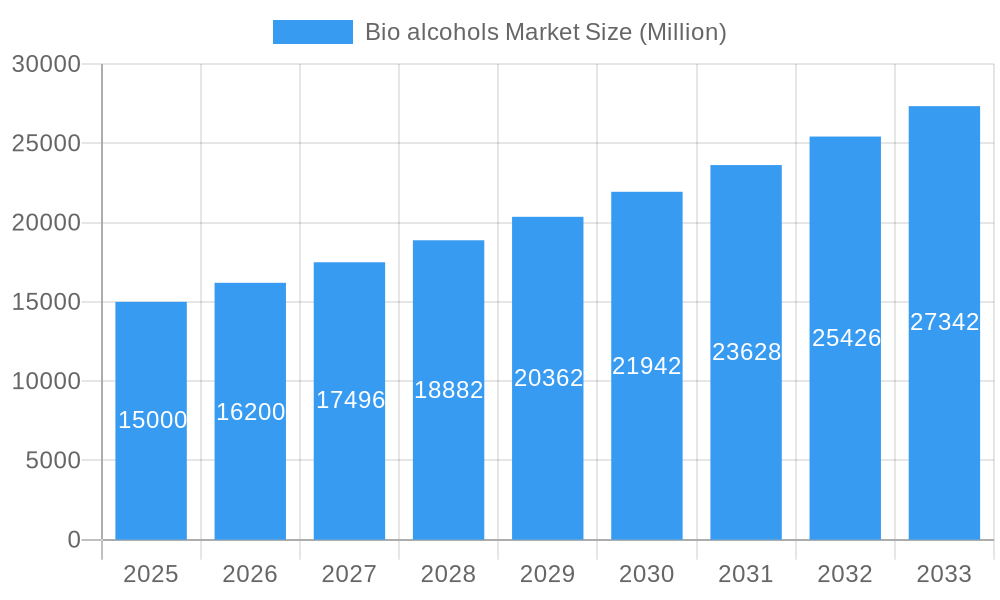
The bio-alcohols market, encompassing bio-methanol, bio-ethanol, bio-butanol, bio-BDO, and other bio-based alcohols, is experiencing robust growth, projected to maintain a Compound Annual Growth Rate (CAGR) exceeding 8% from 2025 to 2033. This expansion is driven by several key factors. Firstly, the increasing global demand for sustainable and renewable alternatives to fossil fuels is significantly boosting the adoption of bio-alcohols in transportation, particularly as a blend component in gasoline and diesel, and increasingly as a feedstock for the production of advanced biofuels. Secondly, the burgeoning construction industry, coupled with stringent environmental regulations, is fueling the demand for bio-based building materials and adhesives, further propelling market growth. The electronics and pharmaceutical sectors also contribute significantly, utilizing bio-alcohols as solvents and intermediates in various manufacturing processes. Regional variations exist, with Asia Pacific, particularly China and India, expected to lead the market due to rapid industrialization and supportive government policies promoting renewable energy. North America and Europe also hold substantial market share, driven by established biofuel mandates and consumer demand for environmentally conscious products.
Bio alcohols Market Market Size (In Billion)
Market restraints include the relatively high production costs compared to traditional petrochemical-based alternatives, and the fluctuating prices of raw materials such as biomass feedstocks. Technological advancements focused on enhancing the efficiency and cost-effectiveness of bio-alcohol production, along with continued government incentives and supportive policies, are crucial for overcoming these challenges. Segment-wise, bio-ethanol currently dominates the market due to its established production infrastructure and widespread applications in the transportation sector. However, bio-butanol and bio-BDO are poised for significant growth due to their superior properties and expanding application areas, particularly in specialized chemicals and materials. The continued diversification of feedstocks and advancements in fermentation technologies are likely to further shape the competitive landscape, enabling new market entrants and fostering innovation in this dynamic sector.
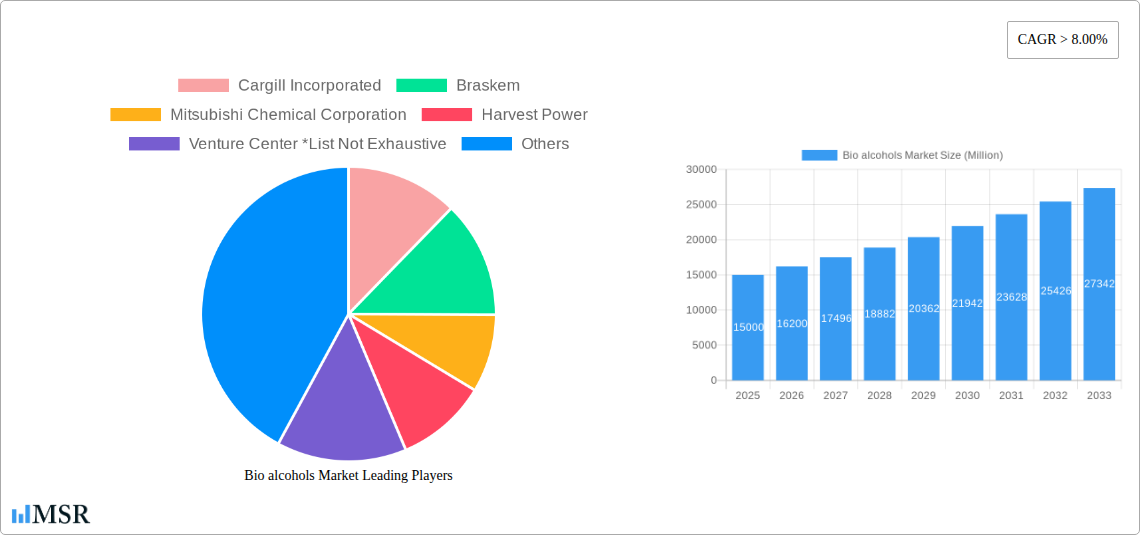
Bio alcohols Market Company Market Share
Unlock Growth Potential: A Comprehensive Analysis of the Bio Alcohols Market (2019-2033)
This meticulously researched report provides a deep dive into the dynamic Bio Alcohols Market, offering invaluable insights for industry stakeholders, investors, and strategic decision-makers. Covering the period 2019-2033, with a focus on 2025, this report unveils market trends, growth drivers, competitive landscapes, and future opportunities within the Bio-methanol, Bio-ethanol, Bio-butanol, Bio-BDO, and other bio alcohol segments. The study encompasses a wide range of applications across Transportation, Construction, Electronics, Pharmaceutical, and other sectors. Expect detailed analysis of key players like Cargill Incorporated, Braskem, Mitsubishi Chemical Corporation, and BASF SE, amongst others, providing a comprehensive understanding of this rapidly evolving market poised for significant expansion. The report’s value extends to identifying emerging opportunities and navigating market challenges, providing actionable strategies for sustained success. The market size is projected to reach xx Million by 2033.
Bio alcohols Market Concentration & Dynamics
The Bio alcohols market exhibits a moderately concentrated landscape, with key players holding significant market share. However, the presence of numerous smaller players and ongoing innovation fosters a dynamic environment. Market concentration is further influenced by regulatory frameworks varying across regions, impacting production and distribution. Substitute products, such as conventional fuels, pose a challenge, but the growing demand for sustainable alternatives is creating new opportunities.
- Market Share: Cargill Incorporated and Braskem hold a combined xx% market share (estimated) in 2025. Other significant players include Mitsubishi Chemical Corporation and BASF SE.
- Innovation Ecosystem: Significant R&D investments are driving process improvements, reducing production costs, and expanding applications for bio alcohols.
- Regulatory Frameworks: Government policies promoting renewable energy and biofuel mandates are crucial drivers, but variations in regulations across geographies create complexities.
- Substitute Products: Competition from conventional fuels remains a significant factor, but the push for environmental sustainability is gradually shifting market dynamics.
- End-User Trends: The increasing adoption of bio alcohols in transportation fuels, particularly bioethanol and bio-methanol, reflects a growing preference for eco-friendly options.
- M&A Activities: The number of M&A deals in the sector has increased in recent years (xx deals between 2019-2024, estimated), indicating consolidation and expansion efforts by major players.
Bio alcohols Market Industry Insights & Trends
The global Bio alcohols market is experiencing robust growth, driven by increasing environmental concerns and supportive government regulations. The market size was valued at xx Million in 2024 and is projected to reach xx Million by 2033, exhibiting a CAGR of xx%. This growth is propelled by several factors: the rising demand for sustainable transportation fuels, expanding applications in various industries, and technological advancements leading to enhanced production efficiency and cost reduction. Technological disruptions, such as improved fermentation technologies and advanced biorefinery designs, are significantly impacting production costs and yield, contributing to market expansion. Furthermore, evolving consumer preferences towards sustainable products are further driving market growth.
Key Markets & Segments Leading Bio alcohols Market
Dominant Regions & Segments:
Region: North America currently holds the largest market share (estimated xx% in 2025) due to established biofuel industries and supportive government policies. However, Asia Pacific is expected to witness the highest growth rate during the forecast period driven by increasing industrialization and rising demand for renewable energy.
Product Type: Bio-ethanol currently dominates the market (estimated xx% market share in 2025), primarily driven by its extensive use in the transportation sector. Bio-methanol is gaining traction due to its diverse applications.
Application: The transportation sector is the largest consumer of bio alcohols (estimated xx% market share in 2025), followed by the chemical industry and construction.
Drivers:
- Transportation: Stringent emission regulations and government incentives for biofuel adoption.
- Construction: Growing use in adhesives, coatings, and other construction materials.
- Electronics: Increasing applications in solvents and cleaning agents.
- Pharmaceutical: Utilized as solvents and intermediates in pharmaceutical manufacturing.
- Economic Growth: Strong economic growth in developing economies fuels higher demand for bio alcohols in various applications.
- Infrastructure Development: Investments in biorefineries and related infrastructure expand production capacity.
Bio alcohols Market Product Developments
Recent years have witnessed significant product innovations in the bio alcohols market, leading to improved efficiency, reduced costs, and expanded applications. Advancements in fermentation technologies have resulted in higher yields and reduced production times. The development of novel bio-based catalysts has enhanced the production of specific bio alcohols, further broadening market applications. These technological advancements are strengthening the competitive edge of leading players and promoting sustainable production practices within the industry.
Challenges in the Bio alcohols Market Market
The Bio alcohols market faces several challenges, including:
- Regulatory Hurdles: Inconsistencies in regulations across different regions create complexities in market entry and expansion.
- Supply Chain Issues: Fluctuations in feedstock prices and availability can impact production costs and profitability.
- Competitive Pressures: Competition from conventional fuels and other alternative fuels necessitates continuous innovation and cost optimization.
- High Capital Investment: Setting up and operating biorefineries requires significant capital investment, which can be a barrier for smaller players. This has a quantified impact on market entry and expansion.
Forces Driving Bio alcohols Market Growth
Several factors are driving the growth of the bio alcohols market:
- Government Policies: Favorable policies promoting the use of renewable fuels are providing significant impetus.
- Environmental Concerns: Growing awareness of environmental issues is increasing demand for sustainable alternatives to fossil fuels.
- Technological Advancements: Improvements in production technology are leading to lower production costs and enhanced efficiency.
- Rising Demand: Growth across various applications, including transportation, construction, and chemicals, is fueling market expansion.
Long-Term Growth Catalysts in the Bio alcohols Market
Long-term growth will be significantly influenced by:
Continued innovation in fermentation and biorefinery technologies will drive down production costs, making bio alcohols even more competitive. Strategic partnerships between technology developers, fuel producers, and end-users will facilitate broader adoption and market penetration. Expansion into new markets, particularly in developing economies with growing energy demands, will unlock considerable growth potential.
Emerging Opportunities in Bio alcohols Market
- New Markets: Growing demand in developing countries presents significant opportunities for expansion.
- Advanced Biofuels: The development of next-generation biofuels with higher energy density holds immense potential.
- Integration with Circular Economy: Developing integrated biorefineries that utilize various byproducts will improve sustainability and efficiency.
Leading Players in the Bio alcohols Market Sector
- Cargill Incorporated
- Braskem
- Mitsubishi Chemical Corporation
- Harvest Power
- Venture Center
- BASF SE
- DSM
- Valero Marketing and Supply Company
- Mascoma LLC
- Fulcrum BioEnergy
Key Milestones in Bio alcohols Market Industry
- 2020: Launch of a new generation bioethanol plant by Cargill Incorporated in [Location].
- 2021: Braskem announces a major investment in expanding its bio-methanol production capacity.
- 2022: Partnership between BASF SE and a leading technology provider to develop advanced biorefinery technologies.
- 2023: Government regulations in [Country] further incentivize biofuel adoption.
- 2024: Acquisition of a smaller bio alcohol producer by Mitsubishi Chemical Corporation. (Specific dates and details may vary, pending verification)
Strategic Outlook for Bio alcohols Market Market
The Bio alcohols market exhibits immense long-term potential. Continuous innovation, strategic partnerships, and government support are pivotal for realizing this potential. Expansion into new markets, particularly in regions with growing energy demand and supportive regulations, presents significant opportunities. Companies focused on efficient production, sustainable practices, and diversification into new applications are well-positioned for long-term success in this dynamic and rapidly evolving market.
Bio alcohols Market Segmentation
-
1. Product Type
- 1.1. Bio-methanol
- 1.2. Bio-ethanol
- 1.3. Bio-butanol
- 1.4. Bio-BDO
- 1.5. Other Product Types
-
2. Application
- 2.1. Transportation
- 2.2. Construction
- 2.3. Electronics
- 2.4. Pharmaceutical
- 2.5. Other Applications
Bio alcohols Market Segmentation By Geography
-
1. Asia Pacific
- 1.1. China
- 1.2. India
- 1.3. Japan
- 1.4. South Korea
- 1.5. ASEAN Countries
- 1.6. Rest of Asia Pacific
-
2. North America
- 2.1. United States
- 2.2. Canada
- 2.3. Mexico
-
3. Europe
- 3.1. Germany
- 3.2. United Kingdom
- 3.3. Italy
- 3.4. France
- 3.5. Rest of Europe
-
4. South America
- 4.1. Brazil
- 4.2. Argentina
- 4.3. Rest of South America
-
5. Middle East and Africa
- 5.1. Saudi Arabia
- 5.2. South Africa
- 5.3. Rest of Middle East and Africa
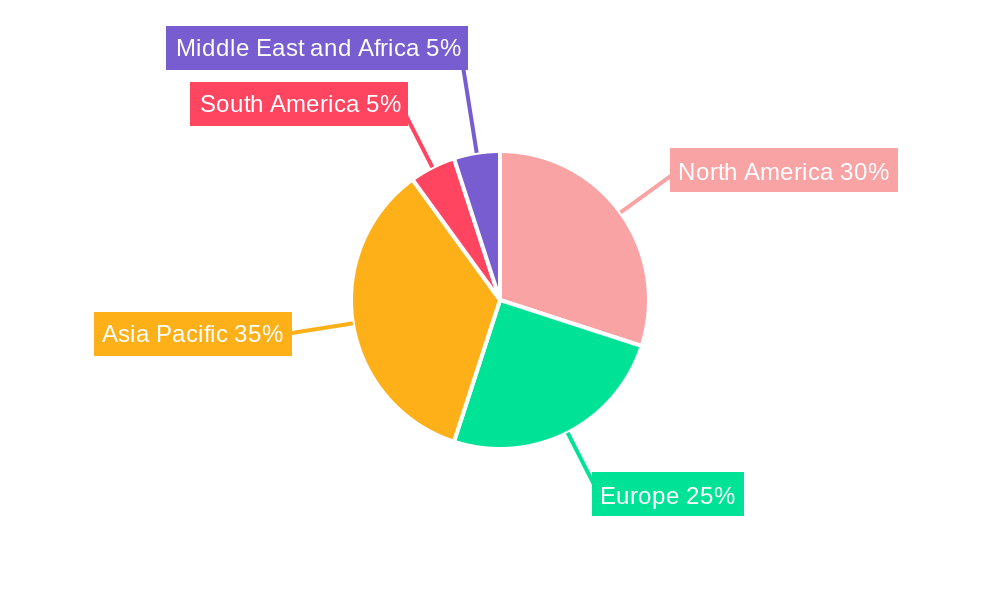
Bio alcohols Market Regional Market Share
Geographic Coverage of Bio alcohols Market
Bio alcohols Market REPORT HIGHLIGHTS
| Aspects | Details |
|---|---|
| Study Period | 2020-2034 |
| Base Year | 2025 |
| Estimated Year | 2026 |
| Forecast Period | 2026-2034 |
| Historical Period | 2020-2025 |
| Growth Rate | CAGR of 6.5% from 2020-2034 |
| Segmentation |
|
Table of Contents
- 1. Introduction
- 1.1. Research Scope
- 1.2. Market Segmentation
- 1.3. Research Objective
- 1.4. Definitions and Assumptions
- 2. Executive Summary
- 2.1. Market Snapshot
- 3. Market Dynamics
- 3.1. Market Drivers
- 3.2. Market Restrains
- 3.3. Market Trends
- 3.4. Market Opportunities
- 4. Market Factor Analysis
- 4.1. Porters Five Forces
- 4.1.1. Bargaining Power of Suppliers
- 4.1.2. Bargaining Power of Buyers
- 4.1.3. Threat of New Entrants
- 4.1.4. Threat of Substitutes
- 4.1.5. Competitive Rivalry
- 4.2. PESTEL analysis
- 4.3. BCG Analysis
- 4.3.1. Stars (High Growth, High Market Share)
- 4.3.2. Cash Cows (Low Growth, High Market Share)
- 4.3.3. Question Mark (High Growth, Low Market Share)
- 4.3.4. Dogs (Low Growth, Low Market Share)
- 4.4. Ansoff Matrix Analysis
- 4.5. Supply Chain Analysis
- 4.6. Regulatory Landscape
- 4.7. Current Market Potential and Opportunity Assessment (TAM–SAM–SOM Framework)
- 4.8. MSR Analyst Note
- 4.1. Porters Five Forces
- 5. Market Analysis, Insights and Forecast 2021-2033
- 5.1. Market Analysis, Insights and Forecast - by Product Type
- 5.1.1. Bio-methanol
- 5.1.2. Bio-ethanol
- 5.1.3. Bio-butanol
- 5.1.4. Bio-BDO
- 5.1.5. Other Product Types
- 5.2. Market Analysis, Insights and Forecast - by Application
- 5.2.1. Transportation
- 5.2.2. Construction
- 5.2.3. Electronics
- 5.2.4. Pharmaceutical
- 5.2.5. Other Applications
- 5.3. Market Analysis, Insights and Forecast - by Region
- 5.3.1. Asia Pacific
- 5.3.2. North America
- 5.3.3. Europe
- 5.3.4. South America
- 5.3.5. Middle East and Africa
- 5.1. Market Analysis, Insights and Forecast - by Product Type
- 6. Global Bio alcohols Market Analysis, Insights and Forecast, 2021-2033
- 6.1. Market Analysis, Insights and Forecast - by Product Type
- 6.1.1. Bio-methanol
- 6.1.2. Bio-ethanol
- 6.1.3. Bio-butanol
- 6.1.4. Bio-BDO
- 6.1.5. Other Product Types
- 6.2. Market Analysis, Insights and Forecast - by Application
- 6.2.1. Transportation
- 6.2.2. Construction
- 6.2.3. Electronics
- 6.2.4. Pharmaceutical
- 6.2.5. Other Applications
- 6.1. Market Analysis, Insights and Forecast - by Product Type
- 7. Asia Pacific Bio alcohols Market Analysis, Insights and Forecast, 2020-2032
- 7.1. Market Analysis, Insights and Forecast - by Product Type
- 7.1.1. Bio-methanol
- 7.1.2. Bio-ethanol
- 7.1.3. Bio-butanol
- 7.1.4. Bio-BDO
- 7.1.5. Other Product Types
- 7.2. Market Analysis, Insights and Forecast - by Application
- 7.2.1. Transportation
- 7.2.2. Construction
- 7.2.3. Electronics
- 7.2.4. Pharmaceutical
- 7.2.5. Other Applications
- 7.1. Market Analysis, Insights and Forecast - by Product Type
- 8. North America Bio alcohols Market Analysis, Insights and Forecast, 2020-2032
- 8.1. Market Analysis, Insights and Forecast - by Product Type
- 8.1.1. Bio-methanol
- 8.1.2. Bio-ethanol
- 8.1.3. Bio-butanol
- 8.1.4. Bio-BDO
- 8.1.5. Other Product Types
- 8.2. Market Analysis, Insights and Forecast - by Application
- 8.2.1. Transportation
- 8.2.2. Construction
- 8.2.3. Electronics
- 8.2.4. Pharmaceutical
- 8.2.5. Other Applications
- 8.1. Market Analysis, Insights and Forecast - by Product Type
- 9. Europe Bio alcohols Market Analysis, Insights and Forecast, 2020-2032
- 9.1. Market Analysis, Insights and Forecast - by Product Type
- 9.1.1. Bio-methanol
- 9.1.2. Bio-ethanol
- 9.1.3. Bio-butanol
- 9.1.4. Bio-BDO
- 9.1.5. Other Product Types
- 9.2. Market Analysis, Insights and Forecast - by Application
- 9.2.1. Transportation
- 9.2.2. Construction
- 9.2.3. Electronics
- 9.2.4. Pharmaceutical
- 9.2.5. Other Applications
- 9.1. Market Analysis, Insights and Forecast - by Product Type
- 10. South America Bio alcohols Market Analysis, Insights and Forecast, 2020-2032
- 10.1. Market Analysis, Insights and Forecast - by Product Type
- 10.1.1. Bio-methanol
- 10.1.2. Bio-ethanol
- 10.1.3. Bio-butanol
- 10.1.4. Bio-BDO
- 10.1.5. Other Product Types
- 10.2. Market Analysis, Insights and Forecast - by Application
- 10.2.1. Transportation
- 10.2.2. Construction
- 10.2.3. Electronics
- 10.2.4. Pharmaceutical
- 10.2.5. Other Applications
- 10.1. Market Analysis, Insights and Forecast - by Product Type
- 11. Middle East and Africa Bio alcohols Market Analysis, Insights and Forecast, 2020-2032
- 11.1. Market Analysis, Insights and Forecast - by Product Type
- 11.1.1. Bio-methanol
- 11.1.2. Bio-ethanol
- 11.1.3. Bio-butanol
- 11.1.4. Bio-BDO
- 11.1.5. Other Product Types
- 11.2. Market Analysis, Insights and Forecast - by Application
- 11.2.1. Transportation
- 11.2.2. Construction
- 11.2.3. Electronics
- 11.2.4. Pharmaceutical
- 11.2.5. Other Applications
- 11.1. Market Analysis, Insights and Forecast - by Product Type
- 12. Competitive Analysis
- 12.1. Company Profiles
- 12.1.1 Cargill Incorporated
- 12.1.1.1. Company Overview
- 12.1.1.2. Products
- 12.1.1.3. Company Financials
- 12.1.1.4. SWOT Analysis
- 12.1.2 Braskem
- 12.1.2.1. Company Overview
- 12.1.2.2. Products
- 12.1.2.3. Company Financials
- 12.1.2.4. SWOT Analysis
- 12.1.3 Mitsubishi Chemical Corporation
- 12.1.3.1. Company Overview
- 12.1.3.2. Products
- 12.1.3.3. Company Financials
- 12.1.3.4. SWOT Analysis
- 12.1.4 Harvest Power
- 12.1.4.1. Company Overview
- 12.1.4.2. Products
- 12.1.4.3. Company Financials
- 12.1.4.4. SWOT Analysis
- 12.1.5 Venture Center *List Not Exhaustive
- 12.1.5.1. Company Overview
- 12.1.5.2. Products
- 12.1.5.3. Company Financials
- 12.1.5.4. SWOT Analysis
- 12.1.6 BASF SE
- 12.1.6.1. Company Overview
- 12.1.6.2. Products
- 12.1.6.3. Company Financials
- 12.1.6.4. SWOT Analysis
- 12.1.7 DSM
- 12.1.7.1. Company Overview
- 12.1.7.2. Products
- 12.1.7.3. Company Financials
- 12.1.7.4. SWOT Analysis
- 12.1.8 Valero Marketing and Supply Company
- 12.1.8.1. Company Overview
- 12.1.8.2. Products
- 12.1.8.3. Company Financials
- 12.1.8.4. SWOT Analysis
- 12.1.9 Mascoma LLC
- 12.1.9.1. Company Overview
- 12.1.9.2. Products
- 12.1.9.3. Company Financials
- 12.1.9.4. SWOT Analysis
- 12.1.10 Fulcrum BioEnergy
- 12.1.10.1. Company Overview
- 12.1.10.2. Products
- 12.1.10.3. Company Financials
- 12.1.10.4. SWOT Analysis
- 12.1.1 Cargill Incorporated
- 12.2. Market Entropy
- 12.2.1 Company's Key Areas Served
- 12.2.2 Recent Developments
- 12.3. Company Market Share Analysis 2025
- 12.3.1 Top 5 Companies Market Share Analysis
- 12.3.2 Top 3 Companies Market Share Analysis
- 12.4. List of Potential Customers
- 13. Research Methodology
List of Figures
- Figure 1: Global Bio alcohols Market Revenue Breakdown (billion, %) by Region 2025 & 2033
- Figure 2: Asia Pacific Bio alcohols Market Revenue (billion), by Product Type 2025 & 2033
- Figure 3: Asia Pacific Bio alcohols Market Revenue Share (%), by Product Type 2025 & 2033
- Figure 4: Asia Pacific Bio alcohols Market Revenue (billion), by Application 2025 & 2033
- Figure 5: Asia Pacific Bio alcohols Market Revenue Share (%), by Application 2025 & 2033
- Figure 6: Asia Pacific Bio alcohols Market Revenue (billion), by Country 2025 & 2033
- Figure 7: Asia Pacific Bio alcohols Market Revenue Share (%), by Country 2025 & 2033
- Figure 8: North America Bio alcohols Market Revenue (billion), by Product Type 2025 & 2033
- Figure 9: North America Bio alcohols Market Revenue Share (%), by Product Type 2025 & 2033
- Figure 10: North America Bio alcohols Market Revenue (billion), by Application 2025 & 2033
- Figure 11: North America Bio alcohols Market Revenue Share (%), by Application 2025 & 2033
- Figure 12: North America Bio alcohols Market Revenue (billion), by Country 2025 & 2033
- Figure 13: North America Bio alcohols Market Revenue Share (%), by Country 2025 & 2033
- Figure 14: Europe Bio alcohols Market Revenue (billion), by Product Type 2025 & 2033
- Figure 15: Europe Bio alcohols Market Revenue Share (%), by Product Type 2025 & 2033
- Figure 16: Europe Bio alcohols Market Revenue (billion), by Application 2025 & 2033
- Figure 17: Europe Bio alcohols Market Revenue Share (%), by Application 2025 & 2033
- Figure 18: Europe Bio alcohols Market Revenue (billion), by Country 2025 & 2033
- Figure 19: Europe Bio alcohols Market Revenue Share (%), by Country 2025 & 2033
- Figure 20: South America Bio alcohols Market Revenue (billion), by Product Type 2025 & 2033
- Figure 21: South America Bio alcohols Market Revenue Share (%), by Product Type 2025 & 2033
- Figure 22: South America Bio alcohols Market Revenue (billion), by Application 2025 & 2033
- Figure 23: South America Bio alcohols Market Revenue Share (%), by Application 2025 & 2033
- Figure 24: South America Bio alcohols Market Revenue (billion), by Country 2025 & 2033
- Figure 25: South America Bio alcohols Market Revenue Share (%), by Country 2025 & 2033
- Figure 26: Middle East and Africa Bio alcohols Market Revenue (billion), by Product Type 2025 & 2033
- Figure 27: Middle East and Africa Bio alcohols Market Revenue Share (%), by Product Type 2025 & 2033
- Figure 28: Middle East and Africa Bio alcohols Market Revenue (billion), by Application 2025 & 2033
- Figure 29: Middle East and Africa Bio alcohols Market Revenue Share (%), by Application 2025 & 2033
- Figure 30: Middle East and Africa Bio alcohols Market Revenue (billion), by Country 2025 & 2033
- Figure 31: Middle East and Africa Bio alcohols Market Revenue Share (%), by Country 2025 & 2033
List of Tables
- Table 1: Global Bio alcohols Market Revenue billion Forecast, by Product Type 2020 & 2033
- Table 2: Global Bio alcohols Market Revenue billion Forecast, by Application 2020 & 2033
- Table 3: Global Bio alcohols Market Revenue billion Forecast, by Region 2020 & 2033
- Table 4: Global Bio alcohols Market Revenue billion Forecast, by Product Type 2020 & 2033
- Table 5: Global Bio alcohols Market Revenue billion Forecast, by Application 2020 & 2033
- Table 6: Global Bio alcohols Market Revenue billion Forecast, by Country 2020 & 2033
- Table 7: China Bio alcohols Market Revenue (billion) Forecast, by Application 2020 & 2033
- Table 8: India Bio alcohols Market Revenue (billion) Forecast, by Application 2020 & 2033
- Table 9: Japan Bio alcohols Market Revenue (billion) Forecast, by Application 2020 & 2033
- Table 10: South Korea Bio alcohols Market Revenue (billion) Forecast, by Application 2020 & 2033
- Table 11: ASEAN Countries Bio alcohols Market Revenue (billion) Forecast, by Application 2020 & 2033
- Table 12: Rest of Asia Pacific Bio alcohols Market Revenue (billion) Forecast, by Application 2020 & 2033
- Table 13: Global Bio alcohols Market Revenue billion Forecast, by Product Type 2020 & 2033
- Table 14: Global Bio alcohols Market Revenue billion Forecast, by Application 2020 & 2033
- Table 15: Global Bio alcohols Market Revenue billion Forecast, by Country 2020 & 2033
- Table 16: United States Bio alcohols Market Revenue (billion) Forecast, by Application 2020 & 2033
- Table 17: Canada Bio alcohols Market Revenue (billion) Forecast, by Application 2020 & 2033
- Table 18: Mexico Bio alcohols Market Revenue (billion) Forecast, by Application 2020 & 2033
- Table 19: Global Bio alcohols Market Revenue billion Forecast, by Product Type 2020 & 2033
- Table 20: Global Bio alcohols Market Revenue billion Forecast, by Application 2020 & 2033
- Table 21: Global Bio alcohols Market Revenue billion Forecast, by Country 2020 & 2033
- Table 22: Germany Bio alcohols Market Revenue (billion) Forecast, by Application 2020 & 2033
- Table 23: United Kingdom Bio alcohols Market Revenue (billion) Forecast, by Application 2020 & 2033
- Table 24: Italy Bio alcohols Market Revenue (billion) Forecast, by Application 2020 & 2033
- Table 25: France Bio alcohols Market Revenue (billion) Forecast, by Application 2020 & 2033
- Table 26: Rest of Europe Bio alcohols Market Revenue (billion) Forecast, by Application 2020 & 2033
- Table 27: Global Bio alcohols Market Revenue billion Forecast, by Product Type 2020 & 2033
- Table 28: Global Bio alcohols Market Revenue billion Forecast, by Application 2020 & 2033
- Table 29: Global Bio alcohols Market Revenue billion Forecast, by Country 2020 & 2033
- Table 30: Brazil Bio alcohols Market Revenue (billion) Forecast, by Application 2020 & 2033
- Table 31: Argentina Bio alcohols Market Revenue (billion) Forecast, by Application 2020 & 2033
- Table 32: Rest of South America Bio alcohols Market Revenue (billion) Forecast, by Application 2020 & 2033
- Table 33: Global Bio alcohols Market Revenue billion Forecast, by Product Type 2020 & 2033
- Table 34: Global Bio alcohols Market Revenue billion Forecast, by Application 2020 & 2033
- Table 35: Global Bio alcohols Market Revenue billion Forecast, by Country 2020 & 2033
- Table 36: Saudi Arabia Bio alcohols Market Revenue (billion) Forecast, by Application 2020 & 2033
- Table 37: South Africa Bio alcohols Market Revenue (billion) Forecast, by Application 2020 & 2033
- Table 38: Rest of Middle East and Africa Bio alcohols Market Revenue (billion) Forecast, by Application 2020 & 2033
Frequently Asked Questions
1. What is the projected Compound Annual Growth Rate (CAGR) of the Bio alcohols Market?
The projected CAGR is approximately 6.5%.
2. Which companies are prominent players in the Bio alcohols Market?
Key companies in the market include Cargill Incorporated, Braskem, Mitsubishi Chemical Corporation, Harvest Power, Venture Center *List Not Exhaustive, BASF SE, DSM, Valero Marketing and Supply Company, Mascoma LLC, Fulcrum BioEnergy.
3. What are the main segments of the Bio alcohols Market?
The market segments include Product Type, Application.
4. Can you provide details about the market size?
The market size is estimated to be USD 12.55 billion as of 2022.
5. What are some drivers contributing to market growth?
; Growing Demand for Bio-based Products; Other Drivers.
6. What are the notable trends driving market growth?
Bio-ethanol to Dominate the Market.
7. Are there any restraints impacting market growth?
; Declining Automotive Production; Impact of COVID-19 Pandemic.
8. Can you provide examples of recent developments in the market?
N/A
9. What pricing options are available for accessing the report?
Pricing options include single-user, multi-user, and enterprise licenses priced at USD 4750, USD 5250, and USD 8750 respectively.
10. Is the market size provided in terms of value or volume?
The market size is provided in terms of value, measured in billion.
11. Are there any specific market keywords associated with the report?
Yes, the market keyword associated with the report is "Bio alcohols Market," which aids in identifying and referencing the specific market segment covered.
12. How do I determine which pricing option suits my needs best?
The pricing options vary based on user requirements and access needs. Individual users may opt for single-user licenses, while businesses requiring broader access may choose multi-user or enterprise licenses for cost-effective access to the report.
13. Are there any additional resources or data provided in the Bio alcohols Market report?
While the report offers comprehensive insights, it's advisable to review the specific contents or supplementary materials provided to ascertain if additional resources or data are available.
14. How can I stay updated on further developments or reports in the Bio alcohols Market?
To stay informed about further developments, trends, and reports in the Bio alcohols Market, consider subscribing to industry newsletters, following relevant companies and organizations, or regularly checking reputable industry news sources and publications.
Methodology
Step 1 - Identification of Relevant Samples Size from Population Database


Step 2 - Approaches for Defining Global Market Size (Value, Volume* & Price*)

Note*: In applicable scenarios
Step 3 - Data Sources
Primary Research
- Web Analytics
- Survey Reports
- Research Institute
- Latest Research Reports
- Opinion Leaders
Secondary Research
- Annual Reports
- White Paper
- Latest Press Release
- Industry Association
- Paid Database
- Investor Presentations

Step 4 - Data Triangulation
Involves using different sources of information in order to increase the validity of a study
These sources are likely to be stakeholders in a program - participants, other researchers, program staff, other community members, and so on.
Then we put all data in single framework & apply various statistical tools to find out the dynamic on the market.
During the analysis stage, feedback from the stakeholder groups would be compared to determine areas of agreement as well as areas of divergence