

Key Insights
The global bioethanol market, projected at $66.99 billion in 2025, is poised for significant expansion, forecasting a compound annual growth rate (CAGR) of 11.7% from 2025 to 2033. This growth is propelled by the escalating demand for sustainable fuels, driven by stringent environmental regulations and the pursuit of energy independence. The increasing environmental consciousness and the advancement of the circular bioeconomy are accelerating the adoption of bioethanol as a viable alternative to fossil fuels. Its diverse applications span automotive, food and beverage, pharmaceuticals, and cosmetics, further stimulating market growth. While feedstock price volatility and land-use competition present challenges, advancements in production technologies, including enhanced fermentation and the development of novel feedstocks, are effectively addressing these constraints. The market is segmented by feedstock (sugarcane, corn, wheat, etc.) and application, with the automotive sector leading, though other segments demonstrate strong growth potential. North America and Asia-Pacific exhibit robust market presence due to substantial biofuel mandates and feedstock production capabilities. Europe and South America also play crucial roles, offering diverse feedstock options and established production infrastructure. Continued R&D investment and supportive government policies indicate a favorable outlook for bioethanol market expansion.
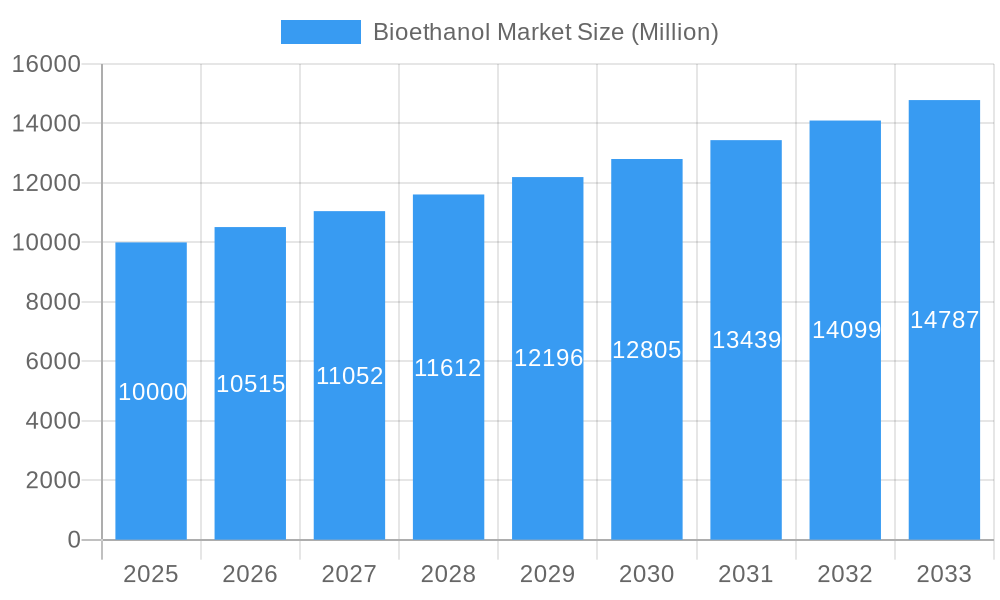
Bioethanol Market Market Size (In Billion)
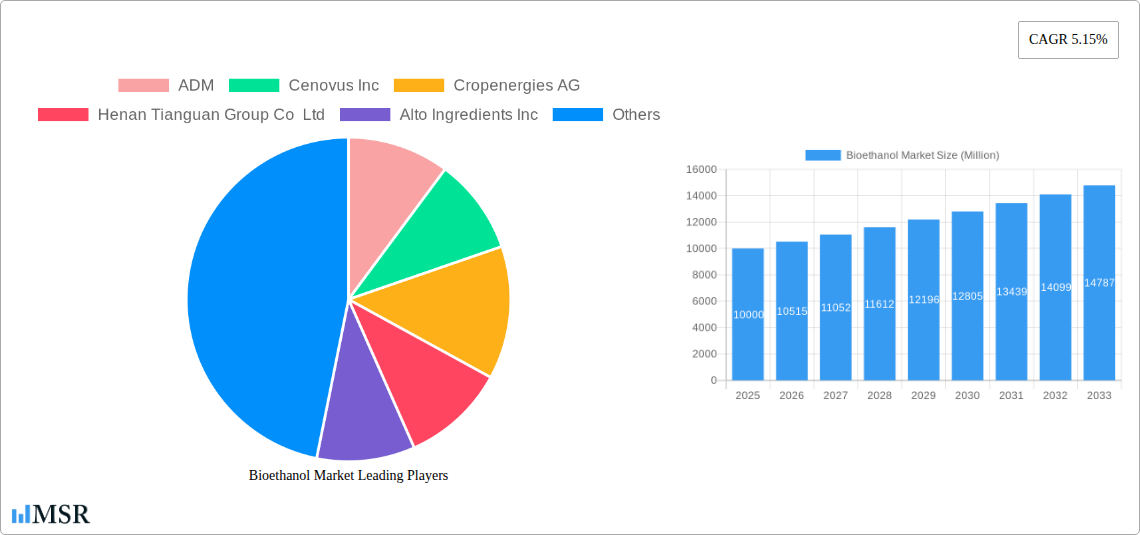
The competitive landscape features established multinational corporations and agile regional players. Leading companies such as ADM, Valero, and Poet LLC command significant market share through robust supply chains and technological expertise. Emerging companies are gaining traction by focusing on innovative feedstock utilization and advanced production methods. Strategic collaborations and M&A activities are anticipated to influence market dynamics. The market's future will be shaped by evolving regulations, technological breakthroughs, feedstock price fluctuations, and the global economic climate. Sustainable and efficient production practices, coupled with continuous innovation, are essential for competitive advantage and capitalizing on opportunities in the bioethanol market.
Bioethanol Market Company Market Share
Bioethanol Market: A Comprehensive Report (2019-2033)
This comprehensive report provides an in-depth analysis of the Bioethanol Market, covering the period 2019-2033, with a focus on market dynamics, key segments, leading players, and future growth opportunities. The study meticulously examines market size, CAGR, and future projections, providing actionable insights for stakeholders across the biofuel industry. The report leverages extensive primary and secondary research to deliver a robust and reliable assessment of this dynamic market.
Bioethanol Market Concentration & Dynamics
The global bioethanol market exhibits a moderately concentrated landscape, with several large players holding significant market share. However, the presence of numerous smaller, specialized producers contributes to a dynamic competitive environment. Market concentration is influenced by factors such as feedstock availability, technological advancements, and regulatory policies. Innovation ecosystems are emerging around advanced biofuel technologies, particularly in the development of sustainable aviation fuel (SAF) and bio-based chemicals.
Regulatory frameworks play a pivotal role, with government incentives and mandates significantly impacting market growth. Substitute products, such as gasoline and other renewable fuels, exert competitive pressure. End-user trends, driven by increasing environmental concerns and government regulations, favor bioethanol as a sustainable alternative.
Mergers and acquisitions (M&A) activity is frequent, reflecting strategic consolidation within the sector and the pursuit of technological capabilities. Recent M&A deal counts suggest a trend towards increased industry consolidation.
- Market Share: The top 5 players hold approximately xx% of the global market share (estimated).
- M&A Deal Counts: An estimated xx M&A deals were recorded in the last 5 years (estimated).
- Key Market Drivers: Government regulations, rising environmental concerns, and increasing demand for sustainable fuels.
- Key Restraints: Feedstock price volatility, competition from alternative fuels, and technological challenges.
Bioethanol Market Industry Insights & Trends
The global bioethanol market is experiencing significant growth, driven by increasing demand for renewable energy sources and stricter environmental regulations. The market size was valued at xx Million in 2024 and is projected to reach xx Million by 2033, exhibiting a CAGR of xx% during the forecast period (2025-2033). This growth is primarily attributed to several factors, including rising consumer awareness of environmental sustainability, governmental support for biofuels, and technological advancements that enhance the efficiency and cost-effectiveness of bioethanol production.
Technological disruptions, such as the development of advanced biofuel technologies capable of utilizing a wider range of feedstocks, are further propelling market expansion. Evolving consumer behaviors, particularly a growing preference for eco-friendly products, have also positively impacted market growth. Moreover, the increasing use of bioethanol in various applications, including automotive fuel, food and beverages, and pharmaceuticals, fuels this expansion.
Key Markets & Segments Leading Bioethanol Market
The automotive and transportation segment dominates the bioethanol market, primarily due to its extensive application as a fuel additive or blend in gasoline. Geographically, the Americas represent the leading region in bioethanol production and consumption.
- Dominant Region: The Americas (estimated xx% market share).
- Dominant Feedstock Type: Corn (estimated xx% market share) and Sugarcane (estimated xx% market share).
- Dominant Application: Automotive and Transportation (estimated xx% market share).
Drivers for Dominant Segments:
- Automotive & Transportation: Stringent emission regulations, government incentives for biofuel adoption, and increasing consumer demand for sustainable transportation.
- Corn & Sugarcane Feedstock: Wide availability, established production infrastructure, and relatively low cost compared to other feedstocks.
- Americas Region: Favorable government policies, extensive agricultural land suitable for biofuel feedstock production, and established bioethanol industry infrastructure.
Detailed analysis further highlights the specific drivers for each region and segment. For instance, Brazil's dominance in sugarcane-based bioethanol production is fuelled by its large-scale sugarcane cultivation and well-established biofuel infrastructure. Similarly, the U.S. leads in corn-based bioethanol production due to its vast corn acreage and well-established ethanol industry.
Bioethanol Market Product Developments
Recent advancements in bioethanol production technologies are leading to improved efficiency, reduced production costs, and enhanced sustainability. These innovations include the development of advanced biofuel technologies utilizing diverse feedstocks, such as cellulosic biomass, and the optimization of fermentation processes to achieve higher yields. Such technological progress results in cost reductions and improved environmental sustainability, enhancing the competitiveness of bioethanol. The focus on developing sustainable aviation fuel (SAF) using ethanol feedstock represents a significant step towards decarbonizing the aviation industry, creating substantial new market opportunities.
Challenges in the Bioethanol Market Market
The bioethanol market faces several challenges, including feedstock price volatility, which significantly impacts production costs. Regulatory hurdles and changes in government policies can also create uncertainty. Supply chain disruptions, particularly during periods of high demand or geopolitical instability, can negatively impact production and distribution. Lastly, intense competition from established fossil fuels and emerging alternative biofuels pressures the market. These factors collectively present headwinds to consistent and stable growth. The estimated impact of these challenges is a reduction in projected market growth by xx% (estimated).
Forces Driving Bioethanol Market Growth
Several factors are driving the growth of the bioethanol market. Firstly, stringent government regulations aiming to reduce greenhouse gas emissions create increasing demand for renewable fuels, including bioethanol. Secondly, favorable government policies, including subsidies and tax incentives, encourage bioethanol production. Thirdly, growing consumer awareness of environmental concerns and a preference for sustainable products drive adoption. Lastly, technological advancements in production methods improve efficiency and reduce production costs.
Long-Term Growth Catalysts in the Bioethanol Market
Long-term growth in the bioethanol market is contingent on several catalysts. Sustained innovation in biofuel technologies, especially in the production of advanced biofuels from cellulosic biomass, presents significant opportunities for enhanced sustainability and cost reduction. Strategic partnerships and collaborations across the industry value chain further enhance innovation. Expanding into new markets, including developing economies, alongside aggressive market penetration strategies through robust supply chain integration and strategic partnerships provide a considerable opportunity for sustainable growth.
Emerging Opportunities in Bioethanol Market
Emerging opportunities exist in the development and commercialization of sustainable aviation fuel (SAF) produced from bioethanol. This addresses the significant environmental impact of air travel. The production of bio-based chemicals derived from bioethanol presents a new avenue for diversifying applications, opening up new markets. Lastly, the increasing integration of bioethanol into existing fuel infrastructure and its adoption as a fuel additive or blend provide significant growth potential.
Leading Players in the Bioethanol Market Sector
- ADM
- Cenovus Inc
- Cropenergies AG
- Henan Tianguan Group Co Ltd
- Alto Ingredients Inc
- Green Plains Inc
- Suncor Energy Inc
- Valero
- Ethanol Technologies
- Verbio Vereinigte Bioenergie AG
- Abengoa
- Granbio Investimentos SA
- Sekab
- Blue Bio Fuels Inc
- Lantmannen
- Tereos
- Cristalco
- Poet LLC
- Jilin Fuel Ethanol Co Ltd
- Raizen
- KWST
Key Milestones in Bioethanol Market Industry
- May 2022: Blue Biofuels Inc. announced the successful testing and further engineering of its fifth-generation Cellulose-to-Sugar ("CTS") machine, paving the way for larger-scale production.
- September 2022: CropEnergies AG acquired a stake in Syclus BV, a Dutch start-up focused on producing renewable ethylene from renewable ethanol, signaling a move towards diversified bio-based chemical production.
- January 2023: United Airlines, Tallgrass, and Green Plains Inc. announced a joint venture with Blue Blade Energy to develop and commercialize sustainable aviation fuel (SAF) technology using ethanol feedstock, highlighting the growing interest in SAF as a green aviation fuel.
Strategic Outlook for Bioethanol Market Market
The future of the bioethanol market is promising, characterized by sustained growth driven by government policies, technological advancements, and increasing consumer demand for sustainable products. Strategic opportunities lie in exploring new feedstock sources, optimizing production processes, and developing advanced biofuel technologies. Expanding into new markets and forging strategic partnerships are crucial for maximizing long-term growth potential and strengthening the position of players within this rapidly evolving market.
Bioethanol Market Segmentation
-
1. Feedstock Type
- 1.1. Sugarcane
- 1.2. Corn
- 1.3. Wheat
- 1.4. Other Feedstock Types
-
2. Application
- 2.1. Automotive and Transportation
- 2.2. Food and Beverage
- 2.3. Pharmaceutical
- 2.4. Cosmetics and Personal Care
- 2.5. Other Applications
Bioethanol Market Segmentation By Geography
-
1. Asia Pacific
- 1.1. China
- 1.2. India
- 1.3. Japan
- 1.4. South Korea
- 1.5. Rest of Asia Pacific
-
2. North America
- 2.1. United States
- 2.2. Canada
- 2.3. Mexico
-
3. Europe
- 3.1. Germany
- 3.2. United Kingdom
- 3.3. France
- 3.4. Italy
- 3.5. Rest of Europe
-
4. South America
- 4.1. Brazil
- 4.2. Argentina
- 4.3. Rest of South America
-
5. Middle East and Africa
- 5.1. Saudi Arabia
- 5.2. South Africa
- 5.3. Rest of Middle East and Africa
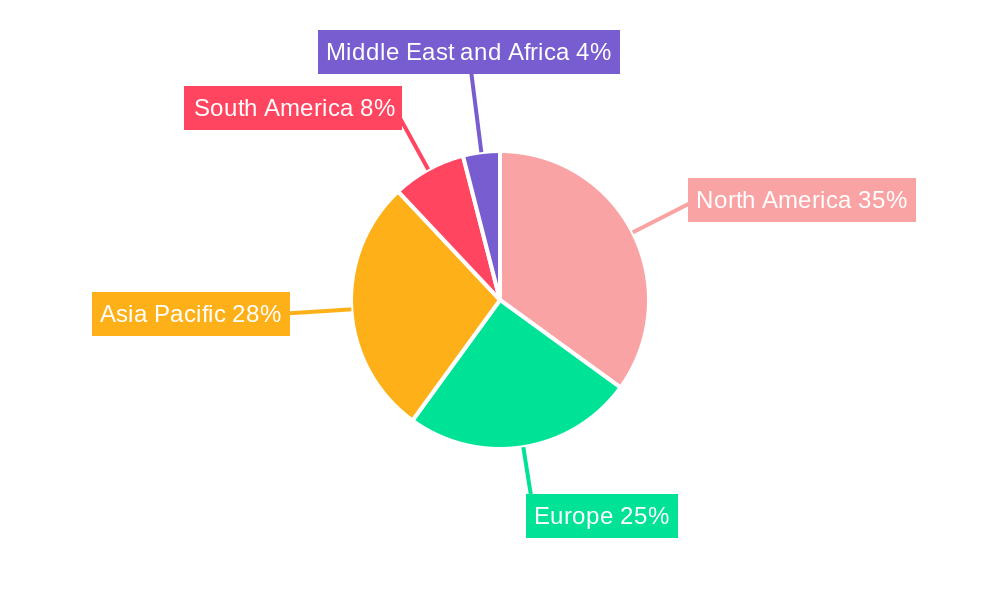
Bioethanol Market Regional Market Share
Geographic Coverage of Bioethanol Market
Bioethanol Market REPORT HIGHLIGHTS
| Aspects | Details |
|---|---|
| Study Period | 2020-2034 |
| Base Year | 2025 |
| Estimated Year | 2026 |
| Forecast Period | 2026-2034 |
| Historical Period | 2020-2025 |
| Growth Rate | CAGR of 11.7% from 2020-2034 |
| Segmentation |
|
Table of Contents
- 1. Introduction
- 1.1. Research Scope
- 1.2. Market Segmentation
- 1.3. Research Objective
- 1.4. Definitions and Assumptions
- 2. Executive Summary
- 2.1. Market Snapshot
- 3. Market Dynamics
- 3.1. Market Drivers
- 3.2. Market Restrains
- 3.3. Market Trends
- 3.4. Market Opportunities
- 4. Market Factor Analysis
- 4.1. Porters Five Forces
- 4.1.1. Bargaining Power of Suppliers
- 4.1.2. Bargaining Power of Buyers
- 4.1.3. Threat of New Entrants
- 4.1.4. Threat of Substitutes
- 4.1.5. Competitive Rivalry
- 4.2. PESTEL analysis
- 4.3. BCG Analysis
- 4.3.1. Stars (High Growth, High Market Share)
- 4.3.2. Cash Cows (Low Growth, High Market Share)
- 4.3.3. Question Mark (High Growth, Low Market Share)
- 4.3.4. Dogs (Low Growth, Low Market Share)
- 4.4. Ansoff Matrix Analysis
- 4.5. Supply Chain Analysis
- 4.6. Regulatory Landscape
- 4.7. Current Market Potential and Opportunity Assessment (TAM–SAM–SOM Framework)
- 4.8. MSR Analyst Note
- 4.1. Porters Five Forces
- 5. Market Analysis, Insights and Forecast 2021-2033
- 5.1. Market Analysis, Insights and Forecast - by Feedstock Type
- 5.1.1. Sugarcane
- 5.1.2. Corn
- 5.1.3. Wheat
- 5.1.4. Other Feedstock Types
- 5.2. Market Analysis, Insights and Forecast - by Application
- 5.2.1. Automotive and Transportation
- 5.2.2. Food and Beverage
- 5.2.3. Pharmaceutical
- 5.2.4. Cosmetics and Personal Care
- 5.2.5. Other Applications
- 5.3. Market Analysis, Insights and Forecast - by Region
- 5.3.1. Asia Pacific
- 5.3.2. North America
- 5.3.3. Europe
- 5.3.4. South America
- 5.3.5. Middle East and Africa
- 5.1. Market Analysis, Insights and Forecast - by Feedstock Type
- 6. Global Bioethanol Market Analysis, Insights and Forecast, 2021-2033
- 6.1. Market Analysis, Insights and Forecast - by Feedstock Type
- 6.1.1. Sugarcane
- 6.1.2. Corn
- 6.1.3. Wheat
- 6.1.4. Other Feedstock Types
- 6.2. Market Analysis, Insights and Forecast - by Application
- 6.2.1. Automotive and Transportation
- 6.2.2. Food and Beverage
- 6.2.3. Pharmaceutical
- 6.2.4. Cosmetics and Personal Care
- 6.2.5. Other Applications
- 6.1. Market Analysis, Insights and Forecast - by Feedstock Type
- 7. Asia Pacific Bioethanol Market Analysis, Insights and Forecast, 2020-2032
- 7.1. Market Analysis, Insights and Forecast - by Feedstock Type
- 7.1.1. Sugarcane
- 7.1.2. Corn
- 7.1.3. Wheat
- 7.1.4. Other Feedstock Types
- 7.2. Market Analysis, Insights and Forecast - by Application
- 7.2.1. Automotive and Transportation
- 7.2.2. Food and Beverage
- 7.2.3. Pharmaceutical
- 7.2.4. Cosmetics and Personal Care
- 7.2.5. Other Applications
- 7.1. Market Analysis, Insights and Forecast - by Feedstock Type
- 8. North America Bioethanol Market Analysis, Insights and Forecast, 2020-2032
- 8.1. Market Analysis, Insights and Forecast - by Feedstock Type
- 8.1.1. Sugarcane
- 8.1.2. Corn
- 8.1.3. Wheat
- 8.1.4. Other Feedstock Types
- 8.2. Market Analysis, Insights and Forecast - by Application
- 8.2.1. Automotive and Transportation
- 8.2.2. Food and Beverage
- 8.2.3. Pharmaceutical
- 8.2.4. Cosmetics and Personal Care
- 8.2.5. Other Applications
- 8.1. Market Analysis, Insights and Forecast - by Feedstock Type
- 9. Europe Bioethanol Market Analysis, Insights and Forecast, 2020-2032
- 9.1. Market Analysis, Insights and Forecast - by Feedstock Type
- 9.1.1. Sugarcane
- 9.1.2. Corn
- 9.1.3. Wheat
- 9.1.4. Other Feedstock Types
- 9.2. Market Analysis, Insights and Forecast - by Application
- 9.2.1. Automotive and Transportation
- 9.2.2. Food and Beverage
- 9.2.3. Pharmaceutical
- 9.2.4. Cosmetics and Personal Care
- 9.2.5. Other Applications
- 9.1. Market Analysis, Insights and Forecast - by Feedstock Type
- 10. South America Bioethanol Market Analysis, Insights and Forecast, 2020-2032
- 10.1. Market Analysis, Insights and Forecast - by Feedstock Type
- 10.1.1. Sugarcane
- 10.1.2. Corn
- 10.1.3. Wheat
- 10.1.4. Other Feedstock Types
- 10.2. Market Analysis, Insights and Forecast - by Application
- 10.2.1. Automotive and Transportation
- 10.2.2. Food and Beverage
- 10.2.3. Pharmaceutical
- 10.2.4. Cosmetics and Personal Care
- 10.2.5. Other Applications
- 10.1. Market Analysis, Insights and Forecast - by Feedstock Type
- 11. Middle East and Africa Bioethanol Market Analysis, Insights and Forecast, 2020-2032
- 11.1. Market Analysis, Insights and Forecast - by Feedstock Type
- 11.1.1. Sugarcane
- 11.1.2. Corn
- 11.1.3. Wheat
- 11.1.4. Other Feedstock Types
- 11.2. Market Analysis, Insights and Forecast - by Application
- 11.2.1. Automotive and Transportation
- 11.2.2. Food and Beverage
- 11.2.3. Pharmaceutical
- 11.2.4. Cosmetics and Personal Care
- 11.2.5. Other Applications
- 11.1. Market Analysis, Insights and Forecast - by Feedstock Type
- 12. Competitive Analysis
- 12.1. Company Profiles
- 12.1.1 ADM
- 12.1.1.1. Company Overview
- 12.1.1.2. Products
- 12.1.1.3. Company Financials
- 12.1.1.4. SWOT Analysis
- 12.1.2 Cenovus Inc
- 12.1.2.1. Company Overview
- 12.1.2.2. Products
- 12.1.2.3. Company Financials
- 12.1.2.4. SWOT Analysis
- 12.1.3 Cropenergies AG
- 12.1.3.1. Company Overview
- 12.1.3.2. Products
- 12.1.3.3. Company Financials
- 12.1.3.4. SWOT Analysis
- 12.1.4 Henan Tianguan Group Co Ltd
- 12.1.4.1. Company Overview
- 12.1.4.2. Products
- 12.1.4.3. Company Financials
- 12.1.4.4. SWOT Analysis
- 12.1.5 Alto Ingredients Inc
- 12.1.5.1. Company Overview
- 12.1.5.2. Products
- 12.1.5.3. Company Financials
- 12.1.5.4. SWOT Analysis
- 12.1.6 Green Plains Inc
- 12.1.6.1. Company Overview
- 12.1.6.2. Products
- 12.1.6.3. Company Financials
- 12.1.6.4. SWOT Analysis
- 12.1.7 Suncor Energy Inc
- 12.1.7.1. Company Overview
- 12.1.7.2. Products
- 12.1.7.3. Company Financials
- 12.1.7.4. SWOT Analysis
- 12.1.8 Valero
- 12.1.8.1. Company Overview
- 12.1.8.2. Products
- 12.1.8.3. Company Financials
- 12.1.8.4. SWOT Analysis
- 12.1.9 Ethanol Technologies
- 12.1.9.1. Company Overview
- 12.1.9.2. Products
- 12.1.9.3. Company Financials
- 12.1.9.4. SWOT Analysis
- 12.1.10 Verbio Vereinigte Bioenergie AG*List Not Exhaustive
- 12.1.10.1. Company Overview
- 12.1.10.2. Products
- 12.1.10.3. Company Financials
- 12.1.10.4. SWOT Analysis
- 12.1.11 Abengoa
- 12.1.11.1. Company Overview
- 12.1.11.2. Products
- 12.1.11.3. Company Financials
- 12.1.11.4. SWOT Analysis
- 12.1.12 Granbio Investimentos SA
- 12.1.12.1. Company Overview
- 12.1.12.2. Products
- 12.1.12.3. Company Financials
- 12.1.12.4. SWOT Analysis
- 12.1.13 Sekab
- 12.1.13.1. Company Overview
- 12.1.13.2. Products
- 12.1.13.3. Company Financials
- 12.1.13.4. SWOT Analysis
- 12.1.14 Blue Bio Fuels Inc
- 12.1.14.1. Company Overview
- 12.1.14.2. Products
- 12.1.14.3. Company Financials
- 12.1.14.4. SWOT Analysis
- 12.1.15 Lantmannen
- 12.1.15.1. Company Overview
- 12.1.15.2. Products
- 12.1.15.3. Company Financials
- 12.1.15.4. SWOT Analysis
- 12.1.16 Tereos
- 12.1.16.1. Company Overview
- 12.1.16.2. Products
- 12.1.16.3. Company Financials
- 12.1.16.4. SWOT Analysis
- 12.1.17 Cristalco
- 12.1.17.1. Company Overview
- 12.1.17.2. Products
- 12.1.17.3. Company Financials
- 12.1.17.4. SWOT Analysis
- 12.1.18 Poet LLC
- 12.1.18.1. Company Overview
- 12.1.18.2. Products
- 12.1.18.3. Company Financials
- 12.1.18.4. SWOT Analysis
- 12.1.19 Jilin Fuel Ethanol Co Ltd
- 12.1.19.1. Company Overview
- 12.1.19.2. Products
- 12.1.19.3. Company Financials
- 12.1.19.4. SWOT Analysis
- 12.1.20 Raizen
- 12.1.20.1. Company Overview
- 12.1.20.2. Products
- 12.1.20.3. Company Financials
- 12.1.20.4. SWOT Analysis
- 12.1.21 KWST
- 12.1.21.1. Company Overview
- 12.1.21.2. Products
- 12.1.21.3. Company Financials
- 12.1.21.4. SWOT Analysis
- 12.1.1 ADM
- 12.2. Market Entropy
- 12.2.1 Company's Key Areas Served
- 12.2.2 Recent Developments
- 12.3. Company Market Share Analysis 2025
- 12.3.1 Top 5 Companies Market Share Analysis
- 12.3.2 Top 3 Companies Market Share Analysis
- 12.4. List of Potential Customers
- 13. Research Methodology
List of Figures
- Figure 1: Global Bioethanol Market Revenue Breakdown (billion, %) by Region 2025 & 2033
- Figure 2: Global Bioethanol Market Volume Breakdown (Billion, %) by Region 2025 & 2033
- Figure 3: Asia Pacific Bioethanol Market Revenue (billion), by Feedstock Type 2025 & 2033
- Figure 4: Asia Pacific Bioethanol Market Volume (Billion), by Feedstock Type 2025 & 2033
- Figure 5: Asia Pacific Bioethanol Market Revenue Share (%), by Feedstock Type 2025 & 2033
- Figure 6: Asia Pacific Bioethanol Market Volume Share (%), by Feedstock Type 2025 & 2033
- Figure 7: Asia Pacific Bioethanol Market Revenue (billion), by Application 2025 & 2033
- Figure 8: Asia Pacific Bioethanol Market Volume (Billion), by Application 2025 & 2033
- Figure 9: Asia Pacific Bioethanol Market Revenue Share (%), by Application 2025 & 2033
- Figure 10: Asia Pacific Bioethanol Market Volume Share (%), by Application 2025 & 2033
- Figure 11: Asia Pacific Bioethanol Market Revenue (billion), by Country 2025 & 2033
- Figure 12: Asia Pacific Bioethanol Market Volume (Billion), by Country 2025 & 2033
- Figure 13: Asia Pacific Bioethanol Market Revenue Share (%), by Country 2025 & 2033
- Figure 14: Asia Pacific Bioethanol Market Volume Share (%), by Country 2025 & 2033
- Figure 15: North America Bioethanol Market Revenue (billion), by Feedstock Type 2025 & 2033
- Figure 16: North America Bioethanol Market Volume (Billion), by Feedstock Type 2025 & 2033
- Figure 17: North America Bioethanol Market Revenue Share (%), by Feedstock Type 2025 & 2033
- Figure 18: North America Bioethanol Market Volume Share (%), by Feedstock Type 2025 & 2033
- Figure 19: North America Bioethanol Market Revenue (billion), by Application 2025 & 2033
- Figure 20: North America Bioethanol Market Volume (Billion), by Application 2025 & 2033
- Figure 21: North America Bioethanol Market Revenue Share (%), by Application 2025 & 2033
- Figure 22: North America Bioethanol Market Volume Share (%), by Application 2025 & 2033
- Figure 23: North America Bioethanol Market Revenue (billion), by Country 2025 & 2033
- Figure 24: North America Bioethanol Market Volume (Billion), by Country 2025 & 2033
- Figure 25: North America Bioethanol Market Revenue Share (%), by Country 2025 & 2033
- Figure 26: North America Bioethanol Market Volume Share (%), by Country 2025 & 2033
- Figure 27: Europe Bioethanol Market Revenue (billion), by Feedstock Type 2025 & 2033
- Figure 28: Europe Bioethanol Market Volume (Billion), by Feedstock Type 2025 & 2033
- Figure 29: Europe Bioethanol Market Revenue Share (%), by Feedstock Type 2025 & 2033
- Figure 30: Europe Bioethanol Market Volume Share (%), by Feedstock Type 2025 & 2033
- Figure 31: Europe Bioethanol Market Revenue (billion), by Application 2025 & 2033
- Figure 32: Europe Bioethanol Market Volume (Billion), by Application 2025 & 2033
- Figure 33: Europe Bioethanol Market Revenue Share (%), by Application 2025 & 2033
- Figure 34: Europe Bioethanol Market Volume Share (%), by Application 2025 & 2033
- Figure 35: Europe Bioethanol Market Revenue (billion), by Country 2025 & 2033
- Figure 36: Europe Bioethanol Market Volume (Billion), by Country 2025 & 2033
- Figure 37: Europe Bioethanol Market Revenue Share (%), by Country 2025 & 2033
- Figure 38: Europe Bioethanol Market Volume Share (%), by Country 2025 & 2033
- Figure 39: South America Bioethanol Market Revenue (billion), by Feedstock Type 2025 & 2033
- Figure 40: South America Bioethanol Market Volume (Billion), by Feedstock Type 2025 & 2033
- Figure 41: South America Bioethanol Market Revenue Share (%), by Feedstock Type 2025 & 2033
- Figure 42: South America Bioethanol Market Volume Share (%), by Feedstock Type 2025 & 2033
- Figure 43: South America Bioethanol Market Revenue (billion), by Application 2025 & 2033
- Figure 44: South America Bioethanol Market Volume (Billion), by Application 2025 & 2033
- Figure 45: South America Bioethanol Market Revenue Share (%), by Application 2025 & 2033
- Figure 46: South America Bioethanol Market Volume Share (%), by Application 2025 & 2033
- Figure 47: South America Bioethanol Market Revenue (billion), by Country 2025 & 2033
- Figure 48: South America Bioethanol Market Volume (Billion), by Country 2025 & 2033
- Figure 49: South America Bioethanol Market Revenue Share (%), by Country 2025 & 2033
- Figure 50: South America Bioethanol Market Volume Share (%), by Country 2025 & 2033
- Figure 51: Middle East and Africa Bioethanol Market Revenue (billion), by Feedstock Type 2025 & 2033
- Figure 52: Middle East and Africa Bioethanol Market Volume (Billion), by Feedstock Type 2025 & 2033
- Figure 53: Middle East and Africa Bioethanol Market Revenue Share (%), by Feedstock Type 2025 & 2033
- Figure 54: Middle East and Africa Bioethanol Market Volume Share (%), by Feedstock Type 2025 & 2033
- Figure 55: Middle East and Africa Bioethanol Market Revenue (billion), by Application 2025 & 2033
- Figure 56: Middle East and Africa Bioethanol Market Volume (Billion), by Application 2025 & 2033
- Figure 57: Middle East and Africa Bioethanol Market Revenue Share (%), by Application 2025 & 2033
- Figure 58: Middle East and Africa Bioethanol Market Volume Share (%), by Application 2025 & 2033
- Figure 59: Middle East and Africa Bioethanol Market Revenue (billion), by Country 2025 & 2033
- Figure 60: Middle East and Africa Bioethanol Market Volume (Billion), by Country 2025 & 2033
- Figure 61: Middle East and Africa Bioethanol Market Revenue Share (%), by Country 2025 & 2033
- Figure 62: Middle East and Africa Bioethanol Market Volume Share (%), by Country 2025 & 2033
List of Tables
- Table 1: Global Bioethanol Market Revenue billion Forecast, by Feedstock Type 2020 & 2033
- Table 2: Global Bioethanol Market Volume Billion Forecast, by Feedstock Type 2020 & 2033
- Table 3: Global Bioethanol Market Revenue billion Forecast, by Application 2020 & 2033
- Table 4: Global Bioethanol Market Volume Billion Forecast, by Application 2020 & 2033
- Table 5: Global Bioethanol Market Revenue billion Forecast, by Region 2020 & 2033
- Table 6: Global Bioethanol Market Volume Billion Forecast, by Region 2020 & 2033
- Table 7: Global Bioethanol Market Revenue billion Forecast, by Feedstock Type 2020 & 2033
- Table 8: Global Bioethanol Market Volume Billion Forecast, by Feedstock Type 2020 & 2033
- Table 9: Global Bioethanol Market Revenue billion Forecast, by Application 2020 & 2033
- Table 10: Global Bioethanol Market Volume Billion Forecast, by Application 2020 & 2033
- Table 11: Global Bioethanol Market Revenue billion Forecast, by Country 2020 & 2033
- Table 12: Global Bioethanol Market Volume Billion Forecast, by Country 2020 & 2033
- Table 13: China Bioethanol Market Revenue (billion) Forecast, by Application 2020 & 2033
- Table 14: China Bioethanol Market Volume (Billion) Forecast, by Application 2020 & 2033
- Table 15: India Bioethanol Market Revenue (billion) Forecast, by Application 2020 & 2033
- Table 16: India Bioethanol Market Volume (Billion) Forecast, by Application 2020 & 2033
- Table 17: Japan Bioethanol Market Revenue (billion) Forecast, by Application 2020 & 2033
- Table 18: Japan Bioethanol Market Volume (Billion) Forecast, by Application 2020 & 2033
- Table 19: South Korea Bioethanol Market Revenue (billion) Forecast, by Application 2020 & 2033
- Table 20: South Korea Bioethanol Market Volume (Billion) Forecast, by Application 2020 & 2033
- Table 21: Rest of Asia Pacific Bioethanol Market Revenue (billion) Forecast, by Application 2020 & 2033
- Table 22: Rest of Asia Pacific Bioethanol Market Volume (Billion) Forecast, by Application 2020 & 2033
- Table 23: Global Bioethanol Market Revenue billion Forecast, by Feedstock Type 2020 & 2033
- Table 24: Global Bioethanol Market Volume Billion Forecast, by Feedstock Type 2020 & 2033
- Table 25: Global Bioethanol Market Revenue billion Forecast, by Application 2020 & 2033
- Table 26: Global Bioethanol Market Volume Billion Forecast, by Application 2020 & 2033
- Table 27: Global Bioethanol Market Revenue billion Forecast, by Country 2020 & 2033
- Table 28: Global Bioethanol Market Volume Billion Forecast, by Country 2020 & 2033
- Table 29: United States Bioethanol Market Revenue (billion) Forecast, by Application 2020 & 2033
- Table 30: United States Bioethanol Market Volume (Billion) Forecast, by Application 2020 & 2033
- Table 31: Canada Bioethanol Market Revenue (billion) Forecast, by Application 2020 & 2033
- Table 32: Canada Bioethanol Market Volume (Billion) Forecast, by Application 2020 & 2033
- Table 33: Mexico Bioethanol Market Revenue (billion) Forecast, by Application 2020 & 2033
- Table 34: Mexico Bioethanol Market Volume (Billion) Forecast, by Application 2020 & 2033
- Table 35: Global Bioethanol Market Revenue billion Forecast, by Feedstock Type 2020 & 2033
- Table 36: Global Bioethanol Market Volume Billion Forecast, by Feedstock Type 2020 & 2033
- Table 37: Global Bioethanol Market Revenue billion Forecast, by Application 2020 & 2033
- Table 38: Global Bioethanol Market Volume Billion Forecast, by Application 2020 & 2033
- Table 39: Global Bioethanol Market Revenue billion Forecast, by Country 2020 & 2033
- Table 40: Global Bioethanol Market Volume Billion Forecast, by Country 2020 & 2033
- Table 41: Germany Bioethanol Market Revenue (billion) Forecast, by Application 2020 & 2033
- Table 42: Germany Bioethanol Market Volume (Billion) Forecast, by Application 2020 & 2033
- Table 43: United Kingdom Bioethanol Market Revenue (billion) Forecast, by Application 2020 & 2033
- Table 44: United Kingdom Bioethanol Market Volume (Billion) Forecast, by Application 2020 & 2033
- Table 45: France Bioethanol Market Revenue (billion) Forecast, by Application 2020 & 2033
- Table 46: France Bioethanol Market Volume (Billion) Forecast, by Application 2020 & 2033
- Table 47: Italy Bioethanol Market Revenue (billion) Forecast, by Application 2020 & 2033
- Table 48: Italy Bioethanol Market Volume (Billion) Forecast, by Application 2020 & 2033
- Table 49: Rest of Europe Bioethanol Market Revenue (billion) Forecast, by Application 2020 & 2033
- Table 50: Rest of Europe Bioethanol Market Volume (Billion) Forecast, by Application 2020 & 2033
- Table 51: Global Bioethanol Market Revenue billion Forecast, by Feedstock Type 2020 & 2033
- Table 52: Global Bioethanol Market Volume Billion Forecast, by Feedstock Type 2020 & 2033
- Table 53: Global Bioethanol Market Revenue billion Forecast, by Application 2020 & 2033
- Table 54: Global Bioethanol Market Volume Billion Forecast, by Application 2020 & 2033
- Table 55: Global Bioethanol Market Revenue billion Forecast, by Country 2020 & 2033
- Table 56: Global Bioethanol Market Volume Billion Forecast, by Country 2020 & 2033
- Table 57: Brazil Bioethanol Market Revenue (billion) Forecast, by Application 2020 & 2033
- Table 58: Brazil Bioethanol Market Volume (Billion) Forecast, by Application 2020 & 2033
- Table 59: Argentina Bioethanol Market Revenue (billion) Forecast, by Application 2020 & 2033
- Table 60: Argentina Bioethanol Market Volume (Billion) Forecast, by Application 2020 & 2033
- Table 61: Rest of South America Bioethanol Market Revenue (billion) Forecast, by Application 2020 & 2033
- Table 62: Rest of South America Bioethanol Market Volume (Billion) Forecast, by Application 2020 & 2033
- Table 63: Global Bioethanol Market Revenue billion Forecast, by Feedstock Type 2020 & 2033
- Table 64: Global Bioethanol Market Volume Billion Forecast, by Feedstock Type 2020 & 2033
- Table 65: Global Bioethanol Market Revenue billion Forecast, by Application 2020 & 2033
- Table 66: Global Bioethanol Market Volume Billion Forecast, by Application 2020 & 2033
- Table 67: Global Bioethanol Market Revenue billion Forecast, by Country 2020 & 2033
- Table 68: Global Bioethanol Market Volume Billion Forecast, by Country 2020 & 2033
- Table 69: Saudi Arabia Bioethanol Market Revenue (billion) Forecast, by Application 2020 & 2033
- Table 70: Saudi Arabia Bioethanol Market Volume (Billion) Forecast, by Application 2020 & 2033
- Table 71: South Africa Bioethanol Market Revenue (billion) Forecast, by Application 2020 & 2033
- Table 72: South Africa Bioethanol Market Volume (Billion) Forecast, by Application 2020 & 2033
- Table 73: Rest of Middle East and Africa Bioethanol Market Revenue (billion) Forecast, by Application 2020 & 2033
- Table 74: Rest of Middle East and Africa Bioethanol Market Volume (Billion) Forecast, by Application 2020 & 2033
Frequently Asked Questions
1. What is the projected Compound Annual Growth Rate (CAGR) of the Bioethanol Market?
The projected CAGR is approximately 11.7%.
2. Which companies are prominent players in the Bioethanol Market?
Key companies in the market include ADM, Cenovus Inc, Cropenergies AG, Henan Tianguan Group Co Ltd, Alto Ingredients Inc, Green Plains Inc, Suncor Energy Inc, Valero, Ethanol Technologies, Verbio Vereinigte Bioenergie AG*List Not Exhaustive, Abengoa, Granbio Investimentos SA, Sekab, Blue Bio Fuels Inc, Lantmannen, Tereos, Cristalco, Poet LLC, Jilin Fuel Ethanol Co Ltd, Raizen, KWST.
3. What are the main segments of the Bioethanol Market?
The market segments include Feedstock Type, Application.
4. Can you provide details about the market size?
The market size is estimated to be USD 66.99 billion as of 2022.
5. What are some drivers contributing to market growth?
Increasing Favorable Initiatives and Blending Mandates by Regulatory Bodies; Rising Environmental Concerns by the Use of Fossil Fuels and Need for the Bio-fuels.
6. What are the notable trends driving market growth?
Increasing Usage in the Automotive and Transportation Sector.
7. Are there any restraints impacting market growth?
Phasing out of Fuel-based Vehicles Due to Rising Demand for Electric Vehicles; Shifting Focus to Bio-butanol.
8. Can you provide examples of recent developments in the market?
January 2023: United Airlines, Tallgrass, and Green Plains Inc. announced a joint venture with Blue Blade Energy to develop and commercialize a novel Sustainable Aviation Fuel (SAF) technology that uses ethanol feedstock.
9. What pricing options are available for accessing the report?
Pricing options include single-user, multi-user, and enterprise licenses priced at USD 4750, USD 5250, and USD 8750 respectively.
10. Is the market size provided in terms of value or volume?
The market size is provided in terms of value, measured in billion and volume, measured in Billion.
11. Are there any specific market keywords associated with the report?
Yes, the market keyword associated with the report is "Bioethanol Market," which aids in identifying and referencing the specific market segment covered.
12. How do I determine which pricing option suits my needs best?
The pricing options vary based on user requirements and access needs. Individual users may opt for single-user licenses, while businesses requiring broader access may choose multi-user or enterprise licenses for cost-effective access to the report.
13. Are there any additional resources or data provided in the Bioethanol Market report?
While the report offers comprehensive insights, it's advisable to review the specific contents or supplementary materials provided to ascertain if additional resources or data are available.
14. How can I stay updated on further developments or reports in the Bioethanol Market?
To stay informed about further developments, trends, and reports in the Bioethanol Market, consider subscribing to industry newsletters, following relevant companies and organizations, or regularly checking reputable industry news sources and publications.
Methodology
Step 1 - Identification of Relevant Samples Size from Population Database


Step 2 - Approaches for Defining Global Market Size (Value, Volume* & Price*)

Note*: In applicable scenarios
Step 3 - Data Sources
Primary Research
- Web Analytics
- Survey Reports
- Research Institute
- Latest Research Reports
- Opinion Leaders
Secondary Research
- Annual Reports
- White Paper
- Latest Press Release
- Industry Association
- Paid Database
- Investor Presentations

Step 4 - Data Triangulation
Involves using different sources of information in order to increase the validity of a study
These sources are likely to be stakeholders in a program - participants, other researchers, program staff, other community members, and so on.
Then we put all data in single framework & apply various statistical tools to find out the dynamic on the market.
During the analysis stage, feedback from the stakeholder groups would be compared to determine areas of agreement as well as areas of divergence