

Key Insights
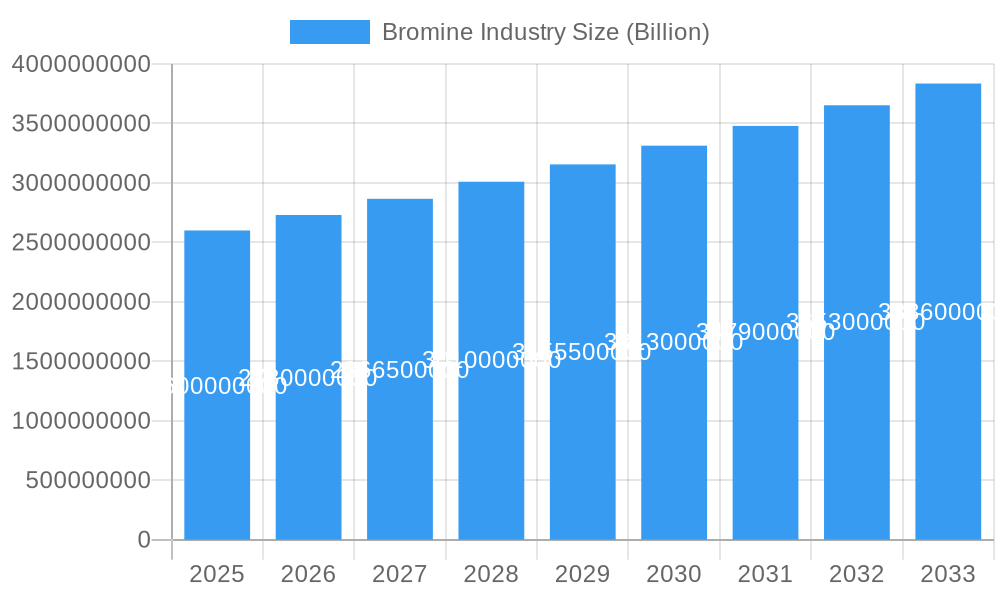
The global Bromine market is projected for robust expansion, currently valued at an estimated $2.6 billion and anticipated to grow at a Compound Annual Growth Rate (CAGR) of 5% from 2025 through 2033. This sustained growth is fueled by escalating demand across several key sectors. Flame retardants, a significant application segment, are witnessing increased adoption due to stringent fire safety regulations in electronics, construction, and automotive industries, driving the consumption of brominated compounds. Furthermore, the burgeoning field of bromine-based batteries, particularly for energy storage solutions, presents a substantial growth opportunity, aligning with the global shift towards renewable energy and grid stabilization. Emerging applications and continuous innovation within existing segments will further underpin the market's upward trajectory.
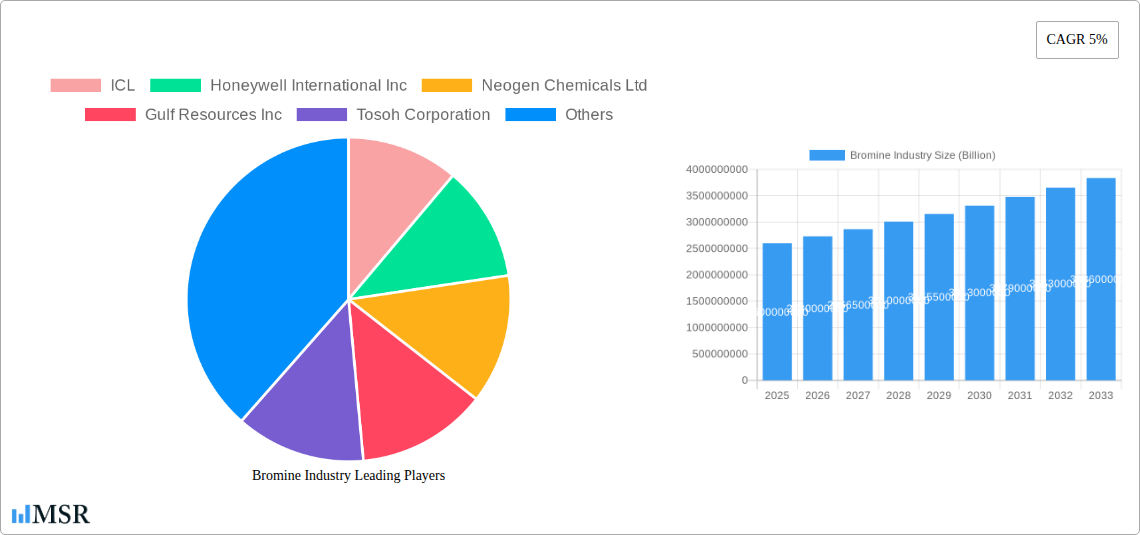
Bromine Industry Market Size (In Billion)
The market is characterized by a diverse range of derivative products, including Organo Bromines, Bromide Salts, and Hydrogen Bromide, each serving distinct industrial purposes. Beyond flame retardants and batteries, biocides play a crucial role in water treatment and agricultural applications, while clear brine fluids are indispensable in the oil and gas industry for wellbore operations. Geographically, the Asia Pacific region, led by China and India, is expected to be a dominant force, owing to its rapidly industrializing economies and increasing manufacturing output. North America and Europe remain significant markets, driven by advanced technological applications and environmental regulations. While the market exhibits strong growth potential, potential restraints such as fluctuating raw material prices and increasing environmental scrutiny on certain brominated compounds necessitate strategic adaptation and innovation from market players to ensure sustained development and market penetration.
Bromine Industry Company Market Share
Bromine Industry: Comprehensive Market Analysis & Future Forecast (2019-2033)
This in-depth report provides an exhaustive analysis of the global Bromine Industry, projecting significant growth and evolving dynamics. Covering the period from 2019 to 2033, with a base and estimated year of 2025 and a forecast period of 2025-2033, this report is an essential resource for stakeholders seeking to understand market concentration, industry insights, key segments, product developments, challenges, growth drivers, and emerging opportunities. The Bromine Industry is a critical component of numerous industrial applications, from flame retardants to advanced energy storage solutions. Our analysis dives deep into the market's intricacies, offering actionable intelligence and strategic foresight for navigating this dynamic sector.
Bromine Industry Market Concentration & Dynamics
The Bromine Industry exhibits a moderate to high level of market concentration, with a few dominant players controlling a significant share of global production and supply. Key companies such as Albemarle Corporation, ICL, and Lanxess are at the forefront, leveraging extensive R&D capabilities and established supply chains to maintain their competitive edge. Innovation ecosystems are robust, particularly in developing novel applications for bromine derivatives and improving the safety and efficiency of bromine extraction and utilization. Regulatory frameworks, while evolving to address environmental concerns, are also shaping market entry and operational standards. The threat of substitute products exists in certain applications, such as alternative flame retardants, but bromine's unique properties often make it indispensable. End-user trends are increasingly focused on sustainability and performance, driving demand for more environmentally friendly bromine-based solutions and high-performance materials. Mergers and acquisitions (M&A) activities, though not constant, periodically reshape the competitive landscape, consolidating market power and expanding geographical reach. For instance, the number of M&A deals in the last five years hovers around 15-20, with average deal values ranging from xx Billion to xx Billion. Market share for the top three players accounts for approximately 60-70% of the global market.
Bromine Industry Industry Insights & Trends
The Bromine Industry is poised for substantial growth, driven by a confluence of factors including escalating demand from key end-use sectors and continuous technological advancements. The global market size is projected to reach xx Billion by 2033, exhibiting a Compound Annual Growth Rate (CAGR) of approximately 5.8% during the forecast period (2025-2033). A primary growth driver is the increasing adoption of bromine-based flame retardants (FR) in electronics, construction, and automotive industries to meet stringent fire safety regulations. The burgeoning demand for offshore oil and gas exploration further fuels the consumption of bromine compounds as clear brine fluids (CBF) for well completion and workover operations. The development of bromine-based batteries, particularly for grid-scale energy storage and electric vehicles, represents a significant emerging trend, promising cleaner and more efficient energy solutions. Technological disruptions are focused on enhancing bromine extraction efficiency, minimizing environmental impact, and developing specialized bromine derivatives with tailored functionalities. Evolving consumer behaviors, emphasizing safety, sustainability, and advanced material performance, are indirectly influencing the Bromine Industry by pushing manufacturers to innovate and adopt greener practices. The market is also witnessing a geographical shift, with growing production and consumption capacities in emerging economies in Asia-Pacific. The exploration of new applications in pharmaceuticals and agrochemicals, coupled with advancements in synthesis techniques, is also contributing to the industry's positive trajectory. The market value in the historical period (2019-2024) grew from xx Billion to xx Billion, demonstrating a consistent upward trend.
Key Markets & Segments Leading Bromine Industry
The Bromine Industry is characterized by the dominance of specific regions and application segments, each propelled by distinct market forces.
Dominant Regions & Countries:
- Asia-Pacific: This region is a significant powerhouse, driven by rapid industrialization, a burgeoning manufacturing sector, and substantial investments in infrastructure and electronics production. Countries like China and India are key consumption hubs for flame retardants and other bromine derivatives. Economic growth in this region directly translates to increased demand across various end-use industries.
- North America: A mature market with strong demand for clear brine fluids in its extensive oil and gas sector. It also leads in the development and application of advanced flame retardants and emerging bromine-based battery technologies. Robust R&D infrastructure and stringent safety regulations contribute to its market leadership.
Key Segments & Their Drivers:
- Derivative: Organo Bromines
- Drivers: Growing demand for flame retardants in plastics and textiles, increased use in pharmaceuticals and agrochemicals, and applications in specialty chemicals.
- Dominance Analysis: Organo bromines constitute a substantial portion of the Bromine Industry, particularly due to their critical role as flame retardants. The ongoing need for enhanced fire safety in consumer electronics, building materials, and transportation sectors, coupled with the development of new pharmaceutical intermediates and crop protection agents, solidifies their leading position.
- Derivative: Bromide Salts
- Drivers: Applications in oil and gas drilling fluids, water treatment, photography, and food preservation.
- Dominance Analysis: While not as expansive as organo bromines, bromide salts remain vital. Their essential function in high-density drilling fluids for the oil and gas industry ensures consistent demand. Their use in niche but important areas like water purification and certain industrial processes further contributes to their market presence.
- Derivative: Hydrogen Bromide
- Drivers: Key intermediate in the production of various bromine compounds, including pharmaceuticals, flame retardants, and dyes.
- Dominance Analysis: Hydrogen bromide serves as a foundational chemical for many other bromine derivatives. Its importance is directly tied to the growth of the downstream sectors it serves. The increasing demand for its end products dictates its market performance.
- Application: Flame Retardants (FR)
- Drivers: Stringent fire safety regulations across industries, increasing use of polymeric materials, and rising safety awareness.
- Dominance Analysis: Flame retardants are arguably the most significant application of bromine compounds. The continuous evolution of fire safety standards, particularly in the construction, automotive, and electronics sectors, necessitates the use of effective flame retardant solutions. The development of novel, more sustainable FRs is a key focus.
- Application: Biocides
- Drivers: Growing demand for water treatment in industrial and municipal settings, applications in pulp and paper manufacturing, and personal care products.
- Dominance Analysis: Bromine-based biocides are effective against a broad spectrum of microorganisms. Their application in industrial water systems, cooling towers, and swimming pools, alongside their use in preventing microbial growth in various manufacturing processes, contributes to their consistent demand.
- Application: Bromine-based Batteries
- Drivers: Advancements in grid-scale energy storage, demand for reliable backup power solutions, and potential for electric vehicle applications.
- Dominance Analysis: This is a high-growth, emerging application. The push towards renewable energy sources and the need for efficient energy storage systems are driving significant investment and development in bromine-based battery technology, promising substantial future market share.
- Application: Clear Brine Fluids (CBF)
- Drivers: Continued global demand for oil and gas exploration and production, particularly in offshore environments.
- Dominance Analysis: Clear brine fluids are indispensable in the oil and gas industry for maintaining wellbore stability and controlling formation pressures during drilling and completion. As exploration activities continue, especially in challenging offshore terrains, the demand for CBF remains robust.
- Application: Other Applications
- Drivers: Use in pharmaceuticals, agrochemicals, photographic chemicals, and specialty chemical synthesis.
- Dominance Analysis: This category encompasses a diverse range of niche but critical applications. The pharmaceutical and agrochemical sectors, in particular, utilize bromine compounds extensively as intermediates and active ingredients, ensuring a steady demand.
Bromine Industry Product Developments
Recent product developments in the Bromine Industry are focused on enhancing performance, safety, and environmental sustainability. Companies are innovating in the field of flame retardants, introducing new formulations that offer superior fire protection while meeting evolving regulatory standards. The development of specialized organobromine compounds for advanced applications in electronics and pharmaceuticals is also a key trend. Furthermore, significant advancements are being made in bromine-based battery technologies, aiming for improved energy density and cycle life. The introduction of patented solutions for bromine leak treatment, such as ICL's BromoQuel, demonstrates a commitment to operational safety and efficiency within the industry.
Challenges in the Bromine Industry Market
The Bromine Industry faces several significant challenges that impact its growth and operational landscape. Environmental regulations, particularly concerning the persistence and potential toxicity of certain brominated compounds, pose a continuous hurdle. The cost of bromine extraction and processing can fluctuate based on energy prices and resource availability, impacting profitability. Supply chain disruptions, exacerbated by geopolitical factors and logistics constraints, can affect the timely delivery of raw materials and finished products. Furthermore, competition from alternative materials and technologies in some application areas, such as non-halogenated flame retardants, presents a constant threat, requiring continuous innovation and cost optimization.
Forces Driving Bromine Industry Growth
Several key forces are propelling the growth of the Bromine Industry. The increasing demand for fire safety across diverse sectors, including construction, automotive, and electronics, is a primary driver for flame retardants. The sustained global need for oil and gas exploration and production continues to fuel the demand for clear brine fluids. Technological advancements in energy storage, particularly the development of bromine-based batteries, represent a significant growth catalyst. Furthermore, evolving applications in pharmaceuticals and agrochemicals, driven by the need for new therapeutics and crop protection solutions, contribute to market expansion. Regulatory mandates that favor enhanced safety standards indirectly benefit the industry.
Challenges in the Bromine Industry Market
While facing challenges, the Bromine Industry also benefits from long-term growth catalysts that ensure its continued relevance and expansion. The ongoing need for advanced materials with specific properties, such as fire resistance and chemical stability, will continue to rely on bromine's unique attributes. The push towards cleaner and more efficient energy storage solutions, where bromine-based batteries show immense promise, offers substantial future growth potential. Strategic partnerships and collaborations aimed at developing sustainable bromine extraction methods and innovative downstream applications are crucial for long-term prosperity. Market expansion into emerging economies with growing industrial bases also presents significant long-term opportunities for increased consumption.
Emerging Opportunities in Bromine Industry
Emerging opportunities within the Bromine Industry are diverse and promising. The burgeoning market for electric vehicles and grid-scale energy storage systems presents a significant avenue for growth in bromine-based battery technologies. The increasing focus on sustainable agriculture and pharmaceutical innovation is creating new demand for specialized organobromine compounds. Advancements in water treatment technologies are expanding the use of bromine-based biocides. Furthermore, the development of novel, environmentally benign bromine derivatives and the exploration of its applications in advanced materials and chemical synthesis offer untapped market potential.
Leading Players in the Bromine Industry Sector
- ICL
- Honeywell International Inc
- Neogen Chemicals Ltd
- Gulf Resources Inc
- Tosoh Corporation
- Jordan Bromine Company
- TETRA Technologies Inc
- Tata Chemicals Ltd
- Shandong Haiwang Chemical Co
- Lanxess
- Sujay Chemicals
- Albemarle Corporation
Key Milestones in Bromine Industry Industry
- January 2022: ICL introduced the new BromoQuel, a patented solution that redefines bromine leakage incident treatment to expand its bromine business with safety. This innovation enhances operational safety and addresses critical incident response protocols.
- August 2022: Albemarle Corporation announced the restructuring of its bromine and lithium global business units (GBU) into a new organizational structure. The realignment aims to meet growing customer demand and execute in a competitive global environment, signaling strategic adaptation to market dynamics.
Strategic Outlook for Bromine Industry Market
The strategic outlook for the Bromine Industry remains highly positive, driven by persistent demand from established sectors and the emergence of new high-growth applications. Growth accelerators include the continuous need for advanced flame retardants driven by safety regulations, the sustained demand for clear brine fluids in energy exploration, and the transformative potential of bromine-based batteries in the energy storage revolution. Strategic opportunities lie in expanding into emerging markets, investing in R&D for sustainable bromine derivatives, and forging partnerships to unlock new application frontiers. The industry is well-positioned to capitalize on global trends in safety, energy transition, and advanced materials.
Bromine Industry Segmentation
-
1. Derivative
- 1.1. Organo Bromines
- 1.2. Bromide Salts
- 1.3. Hydrogen Bromide
-
2. Application
- 2.1. Biocides
- 2.2. Flame Retardants (FR)
- 2.3. Bromine-based Batteries
- 2.4. Clear Brine Fluids (CBF)
- 2.5. Other Applications
Bromine Industry Segmentation By Geography
-
1. Asia Pacific
- 1.1. China
- 1.2. India
- 1.3. Japan
- 1.4. South Korea
- 1.5. Rest of Asia Pacific
-
2. North America
- 2.1. United States
- 2.2. Canada
- 2.3. Mexico
-
3. Europe
- 3.1. Germany
- 3.2. United Kingdom
- 3.3. Italy
- 3.4. France
- 3.5. Rest of Europe
-
4. South America
- 4.1. Brazil
- 4.2. Argentina
- 4.3. Rest of South America
-
5. Middle East and Africa
- 5.1. Saudi Arabia
- 5.2. South Africa
- 5.3. Rest of Middle East and Africa
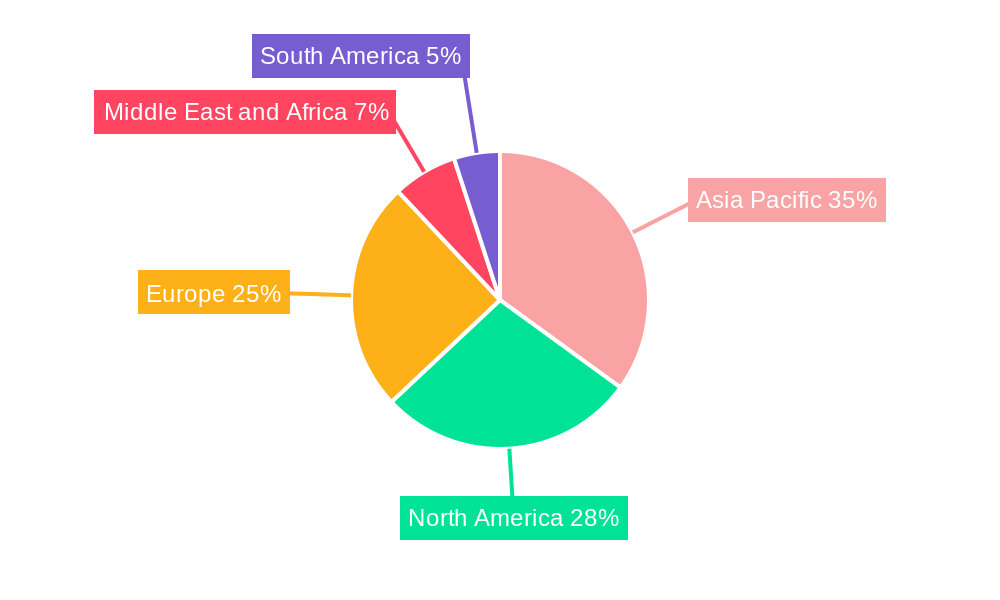
Bromine Industry Regional Market Share
Geographic Coverage of Bromine Industry
Bromine Industry REPORT HIGHLIGHTS
| Aspects | Details |
|---|---|
| Study Period | 2020-2034 |
| Base Year | 2025 |
| Estimated Year | 2026 |
| Forecast Period | 2026-2034 |
| Historical Period | 2020-2025 |
| Growth Rate | CAGR of 5% from 2020-2034 |
| Segmentation |
|
Table of Contents
- 1. Introduction
- 1.1. Research Scope
- 1.2. Market Segmentation
- 1.3. Research Objective
- 1.4. Definitions and Assumptions
- 2. Executive Summary
- 2.1. Market Snapshot
- 3. Market Dynamics
- 3.1. Market Drivers
- 3.2. Market Restrains
- 3.3. Market Trends
- 3.4. Market Opportunities
- 4. Market Factor Analysis
- 4.1. Porters Five Forces
- 4.1.1. Bargaining Power of Suppliers
- 4.1.2. Bargaining Power of Buyers
- 4.1.3. Threat of New Entrants
- 4.1.4. Threat of Substitutes
- 4.1.5. Competitive Rivalry
- 4.2. PESTEL analysis
- 4.3. BCG Analysis
- 4.3.1. Stars (High Growth, High Market Share)
- 4.3.2. Cash Cows (Low Growth, High Market Share)
- 4.3.3. Question Mark (High Growth, Low Market Share)
- 4.3.4. Dogs (Low Growth, Low Market Share)
- 4.4. Ansoff Matrix Analysis
- 4.5. Supply Chain Analysis
- 4.6. Regulatory Landscape
- 4.7. Current Market Potential and Opportunity Assessment (TAM–SAM–SOM Framework)
- 4.8. MSR Analyst Note
- 4.1. Porters Five Forces
- 5. Market Analysis, Insights and Forecast 2021-2033
- 5.1. Market Analysis, Insights and Forecast - by Derivative
- 5.1.1. Organo Bromines
- 5.1.2. Bromide Salts
- 5.1.3. Hydrogen Bromide
- 5.2. Market Analysis, Insights and Forecast - by Application
- 5.2.1. Biocides
- 5.2.2. Flame Retardants (FR)
- 5.2.3. Bromine-based Batteries
- 5.2.4. Clear Brine Fluids (CBF)
- 5.2.5. Other Applications
- 5.3. Market Analysis, Insights and Forecast - by Region
- 5.3.1. Asia Pacific
- 5.3.2. North America
- 5.3.3. Europe
- 5.3.4. South America
- 5.3.5. Middle East and Africa
- 5.1. Market Analysis, Insights and Forecast - by Derivative
- 6. Global Bromine Industry Analysis, Insights and Forecast, 2021-2033
- 6.1. Market Analysis, Insights and Forecast - by Derivative
- 6.1.1. Organo Bromines
- 6.1.2. Bromide Salts
- 6.1.3. Hydrogen Bromide
- 6.2. Market Analysis, Insights and Forecast - by Application
- 6.2.1. Biocides
- 6.2.2. Flame Retardants (FR)
- 6.2.3. Bromine-based Batteries
- 6.2.4. Clear Brine Fluids (CBF)
- 6.2.5. Other Applications
- 6.1. Market Analysis, Insights and Forecast - by Derivative
- 7. Asia Pacific Bromine Industry Analysis, Insights and Forecast, 2020-2032
- 7.1. Market Analysis, Insights and Forecast - by Derivative
- 7.1.1. Organo Bromines
- 7.1.2. Bromide Salts
- 7.1.3. Hydrogen Bromide
- 7.2. Market Analysis, Insights and Forecast - by Application
- 7.2.1. Biocides
- 7.2.2. Flame Retardants (FR)
- 7.2.3. Bromine-based Batteries
- 7.2.4. Clear Brine Fluids (CBF)
- 7.2.5. Other Applications
- 7.1. Market Analysis, Insights and Forecast - by Derivative
- 8. North America Bromine Industry Analysis, Insights and Forecast, 2020-2032
- 8.1. Market Analysis, Insights and Forecast - by Derivative
- 8.1.1. Organo Bromines
- 8.1.2. Bromide Salts
- 8.1.3. Hydrogen Bromide
- 8.2. Market Analysis, Insights and Forecast - by Application
- 8.2.1. Biocides
- 8.2.2. Flame Retardants (FR)
- 8.2.3. Bromine-based Batteries
- 8.2.4. Clear Brine Fluids (CBF)
- 8.2.5. Other Applications
- 8.1. Market Analysis, Insights and Forecast - by Derivative
- 9. Europe Bromine Industry Analysis, Insights and Forecast, 2020-2032
- 9.1. Market Analysis, Insights and Forecast - by Derivative
- 9.1.1. Organo Bromines
- 9.1.2. Bromide Salts
- 9.1.3. Hydrogen Bromide
- 9.2. Market Analysis, Insights and Forecast - by Application
- 9.2.1. Biocides
- 9.2.2. Flame Retardants (FR)
- 9.2.3. Bromine-based Batteries
- 9.2.4. Clear Brine Fluids (CBF)
- 9.2.5. Other Applications
- 9.1. Market Analysis, Insights and Forecast - by Derivative
- 10. South America Bromine Industry Analysis, Insights and Forecast, 2020-2032
- 10.1. Market Analysis, Insights and Forecast - by Derivative
- 10.1.1. Organo Bromines
- 10.1.2. Bromide Salts
- 10.1.3. Hydrogen Bromide
- 10.2. Market Analysis, Insights and Forecast - by Application
- 10.2.1. Biocides
- 10.2.2. Flame Retardants (FR)
- 10.2.3. Bromine-based Batteries
- 10.2.4. Clear Brine Fluids (CBF)
- 10.2.5. Other Applications
- 10.1. Market Analysis, Insights and Forecast - by Derivative
- 11. Middle East and Africa Bromine Industry Analysis, Insights and Forecast, 2020-2032
- 11.1. Market Analysis, Insights and Forecast - by Derivative
- 11.1.1. Organo Bromines
- 11.1.2. Bromide Salts
- 11.1.3. Hydrogen Bromide
- 11.2. Market Analysis, Insights and Forecast - by Application
- 11.2.1. Biocides
- 11.2.2. Flame Retardants (FR)
- 11.2.3. Bromine-based Batteries
- 11.2.4. Clear Brine Fluids (CBF)
- 11.2.5. Other Applications
- 11.1. Market Analysis, Insights and Forecast - by Derivative
- 12. Competitive Analysis
- 12.1. Company Profiles
- 12.1.1 ICL
- 12.1.1.1. Company Overview
- 12.1.1.2. Products
- 12.1.1.3. Company Financials
- 12.1.1.4. SWOT Analysis
- 12.1.2 Honeywell International Inc
- 12.1.2.1. Company Overview
- 12.1.2.2. Products
- 12.1.2.3. Company Financials
- 12.1.2.4. SWOT Analysis
- 12.1.3 Neogen Chemicals Ltd
- 12.1.3.1. Company Overview
- 12.1.3.2. Products
- 12.1.3.3. Company Financials
- 12.1.3.4. SWOT Analysis
- 12.1.4 Gulf Resources Inc
- 12.1.4.1. Company Overview
- 12.1.4.2. Products
- 12.1.4.3. Company Financials
- 12.1.4.4. SWOT Analysis
- 12.1.5 Tosoh Corporation
- 12.1.5.1. Company Overview
- 12.1.5.2. Products
- 12.1.5.3. Company Financials
- 12.1.5.4. SWOT Analysis
- 12.1.6 Jordan Bromine Company
- 12.1.6.1. Company Overview
- 12.1.6.2. Products
- 12.1.6.3. Company Financials
- 12.1.6.4. SWOT Analysis
- 12.1.7 TETRA Technologies Inc
- 12.1.7.1. Company Overview
- 12.1.7.2. Products
- 12.1.7.3. Company Financials
- 12.1.7.4. SWOT Analysis
- 12.1.8 Tata Chemicals Ltd
- 12.1.8.1. Company Overview
- 12.1.8.2. Products
- 12.1.8.3. Company Financials
- 12.1.8.4. SWOT Analysis
- 12.1.9 Shandong Haiwang Chemical Co
- 12.1.9.1. Company Overview
- 12.1.9.2. Products
- 12.1.9.3. Company Financials
- 12.1.9.4. SWOT Analysis
- 12.1.10 Lanxess
- 12.1.10.1. Company Overview
- 12.1.10.2. Products
- 12.1.10.3. Company Financials
- 12.1.10.4. SWOT Analysis
- 12.1.11 Sujay Chemicals
- 12.1.11.1. Company Overview
- 12.1.11.2. Products
- 12.1.11.3. Company Financials
- 12.1.11.4. SWOT Analysis
- 12.1.12 Albemarle Corporation
- 12.1.12.1. Company Overview
- 12.1.12.2. Products
- 12.1.12.3. Company Financials
- 12.1.12.4. SWOT Analysis
- 12.1.1 ICL
- 12.2. Market Entropy
- 12.2.1 Company's Key Areas Served
- 12.2.2 Recent Developments
- 12.3. Company Market Share Analysis 2025
- 12.3.1 Top 5 Companies Market Share Analysis
- 12.3.2 Top 3 Companies Market Share Analysis
- 12.4. List of Potential Customers
- 13. Research Methodology
List of Figures
- Figure 1: Global Bromine Industry Revenue Breakdown (Billion, %) by Region 2025 & 2033
- Figure 2: Global Bromine Industry Volume Breakdown (K Tons, %) by Region 2025 & 2033
- Figure 3: Asia Pacific Bromine Industry Revenue (Billion), by Derivative 2025 & 2033
- Figure 4: Asia Pacific Bromine Industry Volume (K Tons), by Derivative 2025 & 2033
- Figure 5: Asia Pacific Bromine Industry Revenue Share (%), by Derivative 2025 & 2033
- Figure 6: Asia Pacific Bromine Industry Volume Share (%), by Derivative 2025 & 2033
- Figure 7: Asia Pacific Bromine Industry Revenue (Billion), by Application 2025 & 2033
- Figure 8: Asia Pacific Bromine Industry Volume (K Tons), by Application 2025 & 2033
- Figure 9: Asia Pacific Bromine Industry Revenue Share (%), by Application 2025 & 2033
- Figure 10: Asia Pacific Bromine Industry Volume Share (%), by Application 2025 & 2033
- Figure 11: Asia Pacific Bromine Industry Revenue (Billion), by Country 2025 & 2033
- Figure 12: Asia Pacific Bromine Industry Volume (K Tons), by Country 2025 & 2033
- Figure 13: Asia Pacific Bromine Industry Revenue Share (%), by Country 2025 & 2033
- Figure 14: Asia Pacific Bromine Industry Volume Share (%), by Country 2025 & 2033
- Figure 15: North America Bromine Industry Revenue (Billion), by Derivative 2025 & 2033
- Figure 16: North America Bromine Industry Volume (K Tons), by Derivative 2025 & 2033
- Figure 17: North America Bromine Industry Revenue Share (%), by Derivative 2025 & 2033
- Figure 18: North America Bromine Industry Volume Share (%), by Derivative 2025 & 2033
- Figure 19: North America Bromine Industry Revenue (Billion), by Application 2025 & 2033
- Figure 20: North America Bromine Industry Volume (K Tons), by Application 2025 & 2033
- Figure 21: North America Bromine Industry Revenue Share (%), by Application 2025 & 2033
- Figure 22: North America Bromine Industry Volume Share (%), by Application 2025 & 2033
- Figure 23: North America Bromine Industry Revenue (Billion), by Country 2025 & 2033
- Figure 24: North America Bromine Industry Volume (K Tons), by Country 2025 & 2033
- Figure 25: North America Bromine Industry Revenue Share (%), by Country 2025 & 2033
- Figure 26: North America Bromine Industry Volume Share (%), by Country 2025 & 2033
- Figure 27: Europe Bromine Industry Revenue (Billion), by Derivative 2025 & 2033
- Figure 28: Europe Bromine Industry Volume (K Tons), by Derivative 2025 & 2033
- Figure 29: Europe Bromine Industry Revenue Share (%), by Derivative 2025 & 2033
- Figure 30: Europe Bromine Industry Volume Share (%), by Derivative 2025 & 2033
- Figure 31: Europe Bromine Industry Revenue (Billion), by Application 2025 & 2033
- Figure 32: Europe Bromine Industry Volume (K Tons), by Application 2025 & 2033
- Figure 33: Europe Bromine Industry Revenue Share (%), by Application 2025 & 2033
- Figure 34: Europe Bromine Industry Volume Share (%), by Application 2025 & 2033
- Figure 35: Europe Bromine Industry Revenue (Billion), by Country 2025 & 2033
- Figure 36: Europe Bromine Industry Volume (K Tons), by Country 2025 & 2033
- Figure 37: Europe Bromine Industry Revenue Share (%), by Country 2025 & 2033
- Figure 38: Europe Bromine Industry Volume Share (%), by Country 2025 & 2033
- Figure 39: South America Bromine Industry Revenue (Billion), by Derivative 2025 & 2033
- Figure 40: South America Bromine Industry Volume (K Tons), by Derivative 2025 & 2033
- Figure 41: South America Bromine Industry Revenue Share (%), by Derivative 2025 & 2033
- Figure 42: South America Bromine Industry Volume Share (%), by Derivative 2025 & 2033
- Figure 43: South America Bromine Industry Revenue (Billion), by Application 2025 & 2033
- Figure 44: South America Bromine Industry Volume (K Tons), by Application 2025 & 2033
- Figure 45: South America Bromine Industry Revenue Share (%), by Application 2025 & 2033
- Figure 46: South America Bromine Industry Volume Share (%), by Application 2025 & 2033
- Figure 47: South America Bromine Industry Revenue (Billion), by Country 2025 & 2033
- Figure 48: South America Bromine Industry Volume (K Tons), by Country 2025 & 2033
- Figure 49: South America Bromine Industry Revenue Share (%), by Country 2025 & 2033
- Figure 50: South America Bromine Industry Volume Share (%), by Country 2025 & 2033
- Figure 51: Middle East and Africa Bromine Industry Revenue (Billion), by Derivative 2025 & 2033
- Figure 52: Middle East and Africa Bromine Industry Volume (K Tons), by Derivative 2025 & 2033
- Figure 53: Middle East and Africa Bromine Industry Revenue Share (%), by Derivative 2025 & 2033
- Figure 54: Middle East and Africa Bromine Industry Volume Share (%), by Derivative 2025 & 2033
- Figure 55: Middle East and Africa Bromine Industry Revenue (Billion), by Application 2025 & 2033
- Figure 56: Middle East and Africa Bromine Industry Volume (K Tons), by Application 2025 & 2033
- Figure 57: Middle East and Africa Bromine Industry Revenue Share (%), by Application 2025 & 2033
- Figure 58: Middle East and Africa Bromine Industry Volume Share (%), by Application 2025 & 2033
- Figure 59: Middle East and Africa Bromine Industry Revenue (Billion), by Country 2025 & 2033
- Figure 60: Middle East and Africa Bromine Industry Volume (K Tons), by Country 2025 & 2033
- Figure 61: Middle East and Africa Bromine Industry Revenue Share (%), by Country 2025 & 2033
- Figure 62: Middle East and Africa Bromine Industry Volume Share (%), by Country 2025 & 2033
List of Tables
- Table 1: Global Bromine Industry Revenue Billion Forecast, by Derivative 2020 & 2033
- Table 2: Global Bromine Industry Volume K Tons Forecast, by Derivative 2020 & 2033
- Table 3: Global Bromine Industry Revenue Billion Forecast, by Application 2020 & 2033
- Table 4: Global Bromine Industry Volume K Tons Forecast, by Application 2020 & 2033
- Table 5: Global Bromine Industry Revenue Billion Forecast, by Region 2020 & 2033
- Table 6: Global Bromine Industry Volume K Tons Forecast, by Region 2020 & 2033
- Table 7: Global Bromine Industry Revenue Billion Forecast, by Derivative 2020 & 2033
- Table 8: Global Bromine Industry Volume K Tons Forecast, by Derivative 2020 & 2033
- Table 9: Global Bromine Industry Revenue Billion Forecast, by Application 2020 & 2033
- Table 10: Global Bromine Industry Volume K Tons Forecast, by Application 2020 & 2033
- Table 11: Global Bromine Industry Revenue Billion Forecast, by Country 2020 & 2033
- Table 12: Global Bromine Industry Volume K Tons Forecast, by Country 2020 & 2033
- Table 13: China Bromine Industry Revenue (Billion) Forecast, by Application 2020 & 2033
- Table 14: China Bromine Industry Volume (K Tons) Forecast, by Application 2020 & 2033
- Table 15: India Bromine Industry Revenue (Billion) Forecast, by Application 2020 & 2033
- Table 16: India Bromine Industry Volume (K Tons) Forecast, by Application 2020 & 2033
- Table 17: Japan Bromine Industry Revenue (Billion) Forecast, by Application 2020 & 2033
- Table 18: Japan Bromine Industry Volume (K Tons) Forecast, by Application 2020 & 2033
- Table 19: South Korea Bromine Industry Revenue (Billion) Forecast, by Application 2020 & 2033
- Table 20: South Korea Bromine Industry Volume (K Tons) Forecast, by Application 2020 & 2033
- Table 21: Rest of Asia Pacific Bromine Industry Revenue (Billion) Forecast, by Application 2020 & 2033
- Table 22: Rest of Asia Pacific Bromine Industry Volume (K Tons) Forecast, by Application 2020 & 2033
- Table 23: Global Bromine Industry Revenue Billion Forecast, by Derivative 2020 & 2033
- Table 24: Global Bromine Industry Volume K Tons Forecast, by Derivative 2020 & 2033
- Table 25: Global Bromine Industry Revenue Billion Forecast, by Application 2020 & 2033
- Table 26: Global Bromine Industry Volume K Tons Forecast, by Application 2020 & 2033
- Table 27: Global Bromine Industry Revenue Billion Forecast, by Country 2020 & 2033
- Table 28: Global Bromine Industry Volume K Tons Forecast, by Country 2020 & 2033
- Table 29: United States Bromine Industry Revenue (Billion) Forecast, by Application 2020 & 2033
- Table 30: United States Bromine Industry Volume (K Tons) Forecast, by Application 2020 & 2033
- Table 31: Canada Bromine Industry Revenue (Billion) Forecast, by Application 2020 & 2033
- Table 32: Canada Bromine Industry Volume (K Tons) Forecast, by Application 2020 & 2033
- Table 33: Mexico Bromine Industry Revenue (Billion) Forecast, by Application 2020 & 2033
- Table 34: Mexico Bromine Industry Volume (K Tons) Forecast, by Application 2020 & 2033
- Table 35: Global Bromine Industry Revenue Billion Forecast, by Derivative 2020 & 2033
- Table 36: Global Bromine Industry Volume K Tons Forecast, by Derivative 2020 & 2033
- Table 37: Global Bromine Industry Revenue Billion Forecast, by Application 2020 & 2033
- Table 38: Global Bromine Industry Volume K Tons Forecast, by Application 2020 & 2033
- Table 39: Global Bromine Industry Revenue Billion Forecast, by Country 2020 & 2033
- Table 40: Global Bromine Industry Volume K Tons Forecast, by Country 2020 & 2033
- Table 41: Germany Bromine Industry Revenue (Billion) Forecast, by Application 2020 & 2033
- Table 42: Germany Bromine Industry Volume (K Tons) Forecast, by Application 2020 & 2033
- Table 43: United Kingdom Bromine Industry Revenue (Billion) Forecast, by Application 2020 & 2033
- Table 44: United Kingdom Bromine Industry Volume (K Tons) Forecast, by Application 2020 & 2033
- Table 45: Italy Bromine Industry Revenue (Billion) Forecast, by Application 2020 & 2033
- Table 46: Italy Bromine Industry Volume (K Tons) Forecast, by Application 2020 & 2033
- Table 47: France Bromine Industry Revenue (Billion) Forecast, by Application 2020 & 2033
- Table 48: France Bromine Industry Volume (K Tons) Forecast, by Application 2020 & 2033
- Table 49: Rest of Europe Bromine Industry Revenue (Billion) Forecast, by Application 2020 & 2033
- Table 50: Rest of Europe Bromine Industry Volume (K Tons) Forecast, by Application 2020 & 2033
- Table 51: Global Bromine Industry Revenue Billion Forecast, by Derivative 2020 & 2033
- Table 52: Global Bromine Industry Volume K Tons Forecast, by Derivative 2020 & 2033
- Table 53: Global Bromine Industry Revenue Billion Forecast, by Application 2020 & 2033
- Table 54: Global Bromine Industry Volume K Tons Forecast, by Application 2020 & 2033
- Table 55: Global Bromine Industry Revenue Billion Forecast, by Country 2020 & 2033
- Table 56: Global Bromine Industry Volume K Tons Forecast, by Country 2020 & 2033
- Table 57: Brazil Bromine Industry Revenue (Billion) Forecast, by Application 2020 & 2033
- Table 58: Brazil Bromine Industry Volume (K Tons) Forecast, by Application 2020 & 2033
- Table 59: Argentina Bromine Industry Revenue (Billion) Forecast, by Application 2020 & 2033
- Table 60: Argentina Bromine Industry Volume (K Tons) Forecast, by Application 2020 & 2033
- Table 61: Rest of South America Bromine Industry Revenue (Billion) Forecast, by Application 2020 & 2033
- Table 62: Rest of South America Bromine Industry Volume (K Tons) Forecast, by Application 2020 & 2033
- Table 63: Global Bromine Industry Revenue Billion Forecast, by Derivative 2020 & 2033
- Table 64: Global Bromine Industry Volume K Tons Forecast, by Derivative 2020 & 2033
- Table 65: Global Bromine Industry Revenue Billion Forecast, by Application 2020 & 2033
- Table 66: Global Bromine Industry Volume K Tons Forecast, by Application 2020 & 2033
- Table 67: Global Bromine Industry Revenue Billion Forecast, by Country 2020 & 2033
- Table 68: Global Bromine Industry Volume K Tons Forecast, by Country 2020 & 2033
- Table 69: Saudi Arabia Bromine Industry Revenue (Billion) Forecast, by Application 2020 & 2033
- Table 70: Saudi Arabia Bromine Industry Volume (K Tons) Forecast, by Application 2020 & 2033
- Table 71: South Africa Bromine Industry Revenue (Billion) Forecast, by Application 2020 & 2033
- Table 72: South Africa Bromine Industry Volume (K Tons) Forecast, by Application 2020 & 2033
- Table 73: Rest of Middle East and Africa Bromine Industry Revenue (Billion) Forecast, by Application 2020 & 2033
- Table 74: Rest of Middle East and Africa Bromine Industry Volume (K Tons) Forecast, by Application 2020 & 2033
Frequently Asked Questions
1. What is the projected Compound Annual Growth Rate (CAGR) of the Bromine Industry?
The projected CAGR is approximately 5%.
2. Which companies are prominent players in the Bromine Industry?
Key companies in the market include ICL, Honeywell International Inc, Neogen Chemicals Ltd, Gulf Resources Inc, Tosoh Corporation, Jordan Bromine Company, TETRA Technologies Inc, Tata Chemicals Ltd, Shandong Haiwang Chemical Co, Lanxess, Sujay Chemicals, Albemarle Corporation.
3. What are the main segments of the Bromine Industry?
The market segments include Derivative, Application.
4. Can you provide details about the market size?
The market size is estimated to be USD 2.6 Billion as of 2022.
5. What are some drivers contributing to market growth?
The Increasing Demand of Bromine in Water Treatment Applications; Other Drivers.
6. What are the notable trends driving market growth?
Increasing Demand for Flame Retardants.
7. Are there any restraints impacting market growth?
Emergence of Non-halogenated Flame Retardants; Other Restraints.
8. Can you provide examples of recent developments in the market?
January 2022: ICL introduced the new BromoQuel, a patented solution that redefines bromine leakage incident treatment to expand its bromine business with safety.
9. What pricing options are available for accessing the report?
Pricing options include single-user, multi-user, and enterprise licenses priced at USD 3,950, USD 4,950, and USD 6,950 respectively.
10. Is the market size provided in terms of value or volume?
The market size is provided in terms of value, measured in Billion and volume, measured in K Tons.
11. Are there any specific market keywords associated with the report?
Yes, the market keyword associated with the report is "Bromine Industry," which aids in identifying and referencing the specific market segment covered.
12. How do I determine which pricing option suits my needs best?
The pricing options vary based on user requirements and access needs. Individual users may opt for single-user licenses, while businesses requiring broader access may choose multi-user or enterprise licenses for cost-effective access to the report.
13. Are there any additional resources or data provided in the Bromine Industry report?
While the report offers comprehensive insights, it's advisable to review the specific contents or supplementary materials provided to ascertain if additional resources or data are available.
14. How can I stay updated on further developments or reports in the Bromine Industry?
To stay informed about further developments, trends, and reports in the Bromine Industry, consider subscribing to industry newsletters, following relevant companies and organizations, or regularly checking reputable industry news sources and publications.
Methodology
Step 1 - Identification of Relevant Samples Size from Population Database


Step 2 - Approaches for Defining Global Market Size (Value, Volume* & Price*)

Note*: In applicable scenarios
Step 3 - Data Sources
Primary Research
- Web Analytics
- Survey Reports
- Research Institute
- Latest Research Reports
- Opinion Leaders
Secondary Research
- Annual Reports
- White Paper
- Latest Press Release
- Industry Association
- Paid Database
- Investor Presentations

Step 4 - Data Triangulation
Involves using different sources of information in order to increase the validity of a study
These sources are likely to be stakeholders in a program - participants, other researchers, program staff, other community members, and so on.
Then we put all data in single framework & apply various statistical tools to find out the dynamic on the market.
During the analysis stage, feedback from the stakeholder groups would be compared to determine areas of agreement as well as areas of divergence