

Key Insights
The global bulletproof glass market is poised for substantial expansion, driven by escalating security imperatives across diverse industries. Projected to reach $10.83 billion by 2025, with a compound annual growth rate (CAGR) of 11.78%, this market signifies a robust growth trajectory. Key growth catalysts include the persistent rise in security threats, amplified demand for advanced security solutions in commercial and residential infrastructure, and a heightened emphasis on occupant safety within the expanding automotive sector. Innovations in materials science, yielding lighter, stronger, and more optically clear bulletproof glass, are propelling market advancement. The automotive and building & construction sectors are identified as leading market segments. Geographically, the Asia-Pacific region, especially China and India, is demonstrating significant demand fueled by rapid urbanization and economic development. North America and Europe are also major contributors, influenced by stringent security regulations and elevated personal safety awareness. Market segmentation includes product types such as solid acrylic, traditional laminated, polycarbonate, glass-clad polycarbonate, and others, each designed for specific performance benchmarks and applications. Competitive landscapes are defined by key industry leaders like Nippon Sheet Glass, Saint-Gobain, and Fuyao Glass America, who are at the forefront of innovation and market penetration. Market limitations include the high cost of bulletproof glass, potentially hindering adoption in cost-sensitive regions, and the requirement for specialized installation and maintenance.
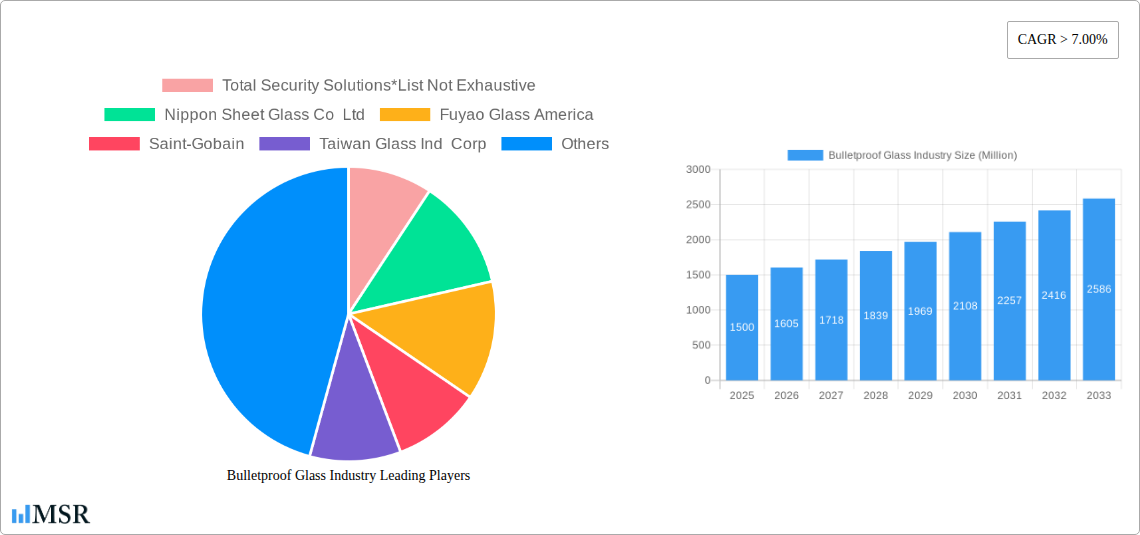
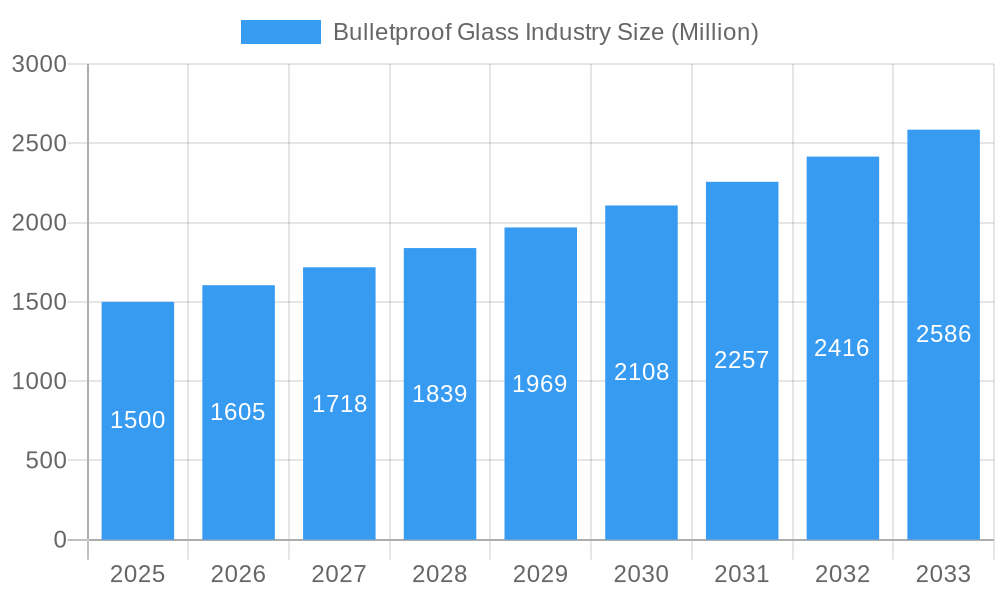
Bulletproof Glass Industry Market Size (In Billion)
Notwithstanding these challenges, the long-term outlook for the bulletproof glass market remains highly promising. Governmental endeavors to bolster public safety, particularly in areas facing elevated security risks, are anticipated to stimulate demand. The integration of smart technologies and sophisticated sensors into bulletproof glass solutions presents significant opportunities for manufacturers to diversify their product portfolios and enhance market presence. Continuous advancements in materials science and manufacturing processes will further improve performance and cost-effectiveness, thereby accelerating adoption across varied applications and global markets. Sustained investment in research and development will foster breakthroughs in transparency, weight reduction, and impact resistance, ultimately shaping the future of this critical security segment.
Bulletproof Glass Industry Company Market Share
Bulletproof Glass Industry: A Comprehensive Market Report (2019-2033)
This in-depth report provides a comprehensive analysis of the global bulletproof glass industry, projecting a market value exceeding $XX Million by 2033. The study covers the historical period (2019-2024), base year (2025), and forecast period (2025-2033), offering invaluable insights for industry stakeholders, investors, and businesses operating within this critical sector. With a focus on market dynamics, key players, and future trends, this report is an essential resource for informed decision-making.
Bulletproof Glass Industry Market Concentration & Dynamics
This section analyzes the competitive landscape of the bulletproof glass market, encompassing market concentration, innovation, regulations, substitutes, end-user trends, and merger & acquisition (M&A) activities. The global bulletproof glass market exhibits a moderately concentrated structure, with key players holding significant market share. The top five companies—including Nippon Sheet Glass Co Ltd, Fuyao Glass America, Saint-Gobain, Taiwan Glass Ind Corp, and Guardian Industries Holdings—account for approximately XX% of the global market share in 2024.
- Market Concentration: The Herfindahl-Hirschman Index (HHI) for the global bulletproof glass market is estimated to be XX, indicating a moderately concentrated market.
- Innovation Ecosystem: Significant R&D investments drive innovations in materials science, resulting in lighter, stronger, and more transparent bulletproof glass solutions.
- Regulatory Frameworks: Government regulations regarding safety and security standards influence product development and market penetration, particularly within the defense and automotive sectors.
- Substitute Products: Alternative materials and technologies pose a competitive threat, especially in cost-sensitive applications.
- End-User Trends: Growing demand from construction and automotive industries, driven by rising security concerns, is a key market driver.
- M&A Activity: The industry has witnessed XX M&A deals in the past five years, indicating consolidation trends and strategic expansion among major players.
Bulletproof Glass Industry Insights & Trends
The global bulletproof glass market is experiencing robust growth, driven by several factors. The market size reached $XX Million in 2024 and is projected to exhibit a Compound Annual Growth Rate (CAGR) of XX% during the forecast period (2025-2033). Increased urbanization, rising security concerns in both commercial and residential settings, and advancements in materials science are key growth drivers. Technological disruptions, such as the development of lightweight yet highly resistant materials, further contribute to market expansion. Evolving consumer behaviors, with a growing preference for enhanced safety and security features, also fuel market demand. The increasing adoption of bulletproof glass in automotive applications, particularly in luxury and high-security vehicles, further accelerates market growth. Government initiatives promoting enhanced infrastructure security also positively impact market size. Furthermore, the rise of terrorism and crime rates has increased the demand for bulletproof glass in various sectors.
Key Markets & Segments Leading Bulletproof Glass Industry
The building and construction sector represents the largest end-user segment, accounting for approximately XX% of the market in 2024. The Asia-Pacific region dominates the global bulletproof glass market, driven by rapid urbanization and infrastructure development. Within the product type segment, traditional laminated glass holds the largest market share, followed by Polycarbonate and Glass-clad Polycarbonate.
Key Drivers:
- Building and Construction: Rising construction activities, particularly in emerging economies, and increased awareness of safety and security standards fuel demand.
- Automotive: Growing demand for luxury and high-security vehicles contributes to market growth.
- Defense: Government spending on defense and security equipment remains a significant market driver.
Dominance Analysis:
The Asia-Pacific region's dominance stems from rapid economic growth, increasing urbanization, and significant investments in infrastructure projects. The high demand for safety and security features in commercial and residential buildings across this region drives the demand for bulletproof glass. Within product types, the prevalence of traditional laminated glass is due to its cost-effectiveness and established market presence. However, innovative materials like Polycarbonate are gaining traction due to their lightweight nature and superior impact resistance.
Bulletproof Glass Industry Product Developments
Recent years have witnessed significant product innovations in the bulletproof glass industry. Advancements focus on developing lighter, more transparent, and cost-effective solutions. Nanotechnology and composite materials are playing crucial roles in enhancing the performance and durability of bulletproof glass. These advancements have broadened the applications of bulletproof glass, extending beyond traditional security applications to include architectural, automotive, and personal protective equipment sectors. The integration of smart features, such as self-healing capabilities and enhanced visibility, is shaping the future of bulletproof glass technologies.
Challenges in the Bulletproof Glass Industry Market
The bulletproof glass industry faces several challenges. High production costs, stringent regulatory requirements, and the need for specialized manufacturing capabilities create barriers to entry for new players. Supply chain disruptions, particularly concerning raw materials, can impact production and pricing. Intense competition among established players also puts pressure on profit margins. Furthermore, fluctuating demand owing to geopolitical events can lead to market instability. The approximate quantifiable impact of these challenges is estimated at a XX% reduction in overall market growth during the forecast period.
Forces Driving Bulletproof Glass Industry Growth
Several factors drive the bulletproof glass industry's growth. Advancements in materials science lead to lighter, stronger, and more transparent products, expanding application possibilities. Growing urbanization and infrastructure development create a strong demand for enhanced security measures in both residential and commercial buildings. Increasing government spending on defense and security boosts demand within the defense sector. Additionally, stringent safety regulations and rising awareness of security concerns contribute positively to market expansion.
Long-Term Growth Catalysts in the Bulletproof Glass Industry
Long-term growth will be fueled by innovation in materials science, leading to more durable and cost-effective products. Strategic partnerships and collaborations between manufacturers and end-users will drive product development and market penetration. Expansion into new markets, particularly in developing economies, will also contribute to sustained growth. The integration of smart technologies and the development of customized solutions will further enhance market opportunities.
Emerging Opportunities in Bulletproof Glass Industry
Emerging opportunities lie in the development of lightweight, flexible, and transparent bulletproof glass for diverse applications. The growing demand for personalized protective solutions for individuals and businesses presents lucrative opportunities. Exploring new materials and technologies to enhance transparency and reduce weight offers significant potential. Expansion into niche markets, such as specialized protective equipment and high-security transportation, can unlock new growth avenues.
Leading Players in the Bulletproof Glass Industry Sector
- Total Security Solutions*List Not Exhaustive
- Nippon Sheet Glass Co Ltd
- Fuyao Glass America
- Saint-Gobain
- Taiwan Glass Ind Corp
- Armortex
- Centigon Security Group
- Guardian Industries Holdings
- Asahi India Glass Limited
- Armass glass
- STEC ARMOUR GLASS
- Consolidated Glass Holdings Inc
- Binswanger Glass
- Guangdong Golden Glass Technologies Limited
- SCHOTT AG
Key Milestones in Bulletproof Glass Industry
- January 2023: Asahi India Glass Limited collaborated with Enormous Brands for brand films, aiming to increase its market share in the doors and windows segment. This demonstrates a focus on branding and market penetration within specific application areas.
- January 2023: Guardian Glass acquired Vortex Glass, expanding its capabilities in tempered glass packages for residential and commercial construction. This acquisition indicates a strategic move toward vertical integration and comprehensive service offerings.
Strategic Outlook for Bulletproof Glass Industry Market
The bulletproof glass market shows significant growth potential driven by sustained demand from various sectors. Strategic opportunities exist in investing in R&D for innovative materials and technologies, expanding into new markets and applications, and fostering collaborations to enhance market penetration. Companies focusing on customization and value-added services will likely gain a competitive edge. The long-term outlook for the bulletproof glass market remains positive, with continuous growth driven by evolving security needs and technological advancements.
Bulletproof Glass Industry Segmentation
-
1. Type
- 1.1. Solid Acrylic
- 1.2. Traditional Laminated
- 1.3. Polycarbonate
- 1.4. Glass-clad Polycarbonate
- 1.5. Other Types
-
2. End-user Industry
- 2.1. Automotive
- 2.2. Buildings and Construction
- 2.3. Defense
- 2.4. Other End-user Industries
Bulletproof Glass Industry Segmentation By Geography
-
1. Asia Pacific
- 1.1. China
- 1.2. India
- 1.3. Japan
- 1.4. South Korea
- 1.5. Rest of Asia Pacific
-
2. North America
- 2.1. United States
- 2.2. Canada
- 2.3. Mexico
-
3. Europe
- 3.1. Germany
- 3.2. United Kingdom
- 3.3. France
- 3.4. Italy
- 3.5. Rest of Europe
-
4. South America
- 4.1. Brazil
- 4.2. Argentina
- 4.3. Rest of South America
- 5. Middle East
-
6. Saudi Arabia
- 6.1. South Africa
- 6.2. Rest of Middle East
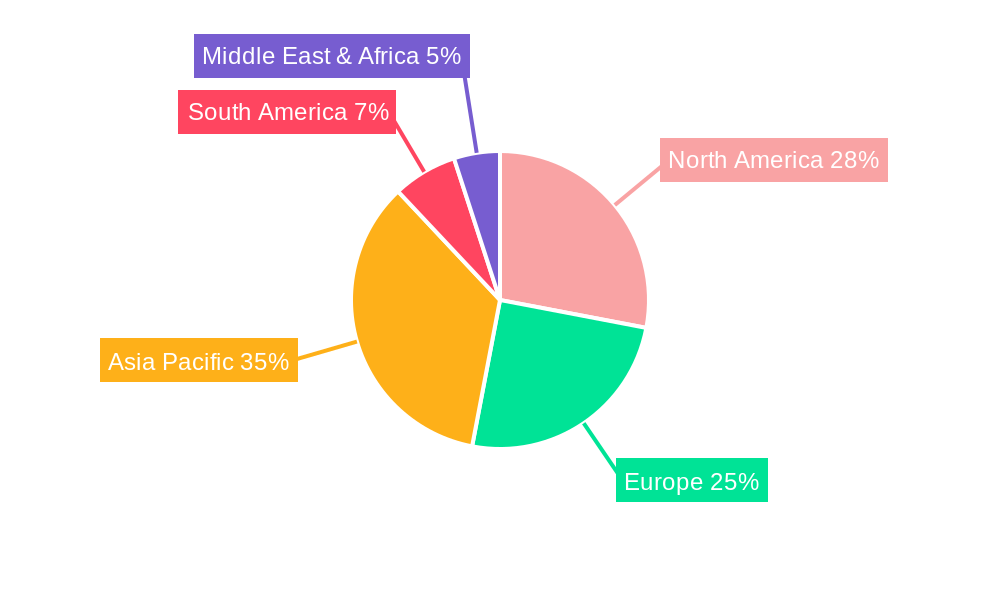
Bulletproof Glass Industry Regional Market Share
Geographic Coverage of Bulletproof Glass Industry
Bulletproof Glass Industry REPORT HIGHLIGHTS
| Aspects | Details |
|---|---|
| Study Period | 2020-2034 |
| Base Year | 2025 |
| Estimated Year | 2026 |
| Forecast Period | 2026-2034 |
| Historical Period | 2020-2025 |
| Growth Rate | CAGR of 11.78% from 2020-2034 |
| Segmentation |
|
Table of Contents
- 1. Introduction
- 1.1. Research Scope
- 1.2. Market Segmentation
- 1.3. Research Objective
- 1.4. Definitions and Assumptions
- 2. Executive Summary
- 2.1. Market Snapshot
- 3. Market Dynamics
- 3.1. Market Drivers
- 3.2. Market Restrains
- 3.3. Market Trends
- 3.4. Market Opportunities
- 4. Market Factor Analysis
- 4.1. Porters Five Forces
- 4.1.1. Bargaining Power of Suppliers
- 4.1.2. Bargaining Power of Buyers
- 4.1.3. Threat of New Entrants
- 4.1.4. Threat of Substitutes
- 4.1.5. Competitive Rivalry
- 4.2. PESTEL analysis
- 4.3. BCG Analysis
- 4.3.1. Stars (High Growth, High Market Share)
- 4.3.2. Cash Cows (Low Growth, High Market Share)
- 4.3.3. Question Mark (High Growth, Low Market Share)
- 4.3.4. Dogs (Low Growth, Low Market Share)
- 4.4. Ansoff Matrix Analysis
- 4.5. Supply Chain Analysis
- 4.6. Regulatory Landscape
- 4.7. Current Market Potential and Opportunity Assessment (TAM–SAM–SOM Framework)
- 4.8. MSR Analyst Note
- 4.1. Porters Five Forces
- 5. Market Analysis, Insights and Forecast 2021-2033
- 5.1. Market Analysis, Insights and Forecast - by Type
- 5.1.1. Solid Acrylic
- 5.1.2. Traditional Laminated
- 5.1.3. Polycarbonate
- 5.1.4. Glass-clad Polycarbonate
- 5.1.5. Other Types
- 5.2. Market Analysis, Insights and Forecast - by End-user Industry
- 5.2.1. Automotive
- 5.2.2. Buildings and Construction
- 5.2.3. Defense
- 5.2.4. Other End-user Industries
- 5.3. Market Analysis, Insights and Forecast - by Region
- 5.3.1. Asia Pacific
- 5.3.2. North America
- 5.3.3. Europe
- 5.3.4. South America
- 5.3.5. Middle East
- 5.3.6. Saudi Arabia
- 5.1. Market Analysis, Insights and Forecast - by Type
- 6. Global Bulletproof Glass Industry Analysis, Insights and Forecast, 2021-2033
- 6.1. Market Analysis, Insights and Forecast - by Type
- 6.1.1. Solid Acrylic
- 6.1.2. Traditional Laminated
- 6.1.3. Polycarbonate
- 6.1.4. Glass-clad Polycarbonate
- 6.1.5. Other Types
- 6.2. Market Analysis, Insights and Forecast - by End-user Industry
- 6.2.1. Automotive
- 6.2.2. Buildings and Construction
- 6.2.3. Defense
- 6.2.4. Other End-user Industries
- 6.1. Market Analysis, Insights and Forecast - by Type
- 7. Asia Pacific Bulletproof Glass Industry Analysis, Insights and Forecast, 2020-2032
- 7.1. Market Analysis, Insights and Forecast - by Type
- 7.1.1. Solid Acrylic
- 7.1.2. Traditional Laminated
- 7.1.3. Polycarbonate
- 7.1.4. Glass-clad Polycarbonate
- 7.1.5. Other Types
- 7.2. Market Analysis, Insights and Forecast - by End-user Industry
- 7.2.1. Automotive
- 7.2.2. Buildings and Construction
- 7.2.3. Defense
- 7.2.4. Other End-user Industries
- 7.1. Market Analysis, Insights and Forecast - by Type
- 8. North America Bulletproof Glass Industry Analysis, Insights and Forecast, 2020-2032
- 8.1. Market Analysis, Insights and Forecast - by Type
- 8.1.1. Solid Acrylic
- 8.1.2. Traditional Laminated
- 8.1.3. Polycarbonate
- 8.1.4. Glass-clad Polycarbonate
- 8.1.5. Other Types
- 8.2. Market Analysis, Insights and Forecast - by End-user Industry
- 8.2.1. Automotive
- 8.2.2. Buildings and Construction
- 8.2.3. Defense
- 8.2.4. Other End-user Industries
- 8.1. Market Analysis, Insights and Forecast - by Type
- 9. Europe Bulletproof Glass Industry Analysis, Insights and Forecast, 2020-2032
- 9.1. Market Analysis, Insights and Forecast - by Type
- 9.1.1. Solid Acrylic
- 9.1.2. Traditional Laminated
- 9.1.3. Polycarbonate
- 9.1.4. Glass-clad Polycarbonate
- 9.1.5. Other Types
- 9.2. Market Analysis, Insights and Forecast - by End-user Industry
- 9.2.1. Automotive
- 9.2.2. Buildings and Construction
- 9.2.3. Defense
- 9.2.4. Other End-user Industries
- 9.1. Market Analysis, Insights and Forecast - by Type
- 10. South America Bulletproof Glass Industry Analysis, Insights and Forecast, 2020-2032
- 10.1. Market Analysis, Insights and Forecast - by Type
- 10.1.1. Solid Acrylic
- 10.1.2. Traditional Laminated
- 10.1.3. Polycarbonate
- 10.1.4. Glass-clad Polycarbonate
- 10.1.5. Other Types
- 10.2. Market Analysis, Insights and Forecast - by End-user Industry
- 10.2.1. Automotive
- 10.2.2. Buildings and Construction
- 10.2.3. Defense
- 10.2.4. Other End-user Industries
- 10.1. Market Analysis, Insights and Forecast - by Type
- 11. Middle East Bulletproof Glass Industry Analysis, Insights and Forecast, 2020-2032
- 11.1. Market Analysis, Insights and Forecast - by Type
- 11.1.1. Solid Acrylic
- 11.1.2. Traditional Laminated
- 11.1.3. Polycarbonate
- 11.1.4. Glass-clad Polycarbonate
- 11.1.5. Other Types
- 11.2. Market Analysis, Insights and Forecast - by End-user Industry
- 11.2.1. Automotive
- 11.2.2. Buildings and Construction
- 11.2.3. Defense
- 11.2.4. Other End-user Industries
- 11.1. Market Analysis, Insights and Forecast - by Type
- 12. Saudi Arabia Bulletproof Glass Industry Analysis, Insights and Forecast, 2020-2032
- 12.1. Market Analysis, Insights and Forecast - by Type
- 12.1.1. Solid Acrylic
- 12.1.2. Traditional Laminated
- 12.1.3. Polycarbonate
- 12.1.4. Glass-clad Polycarbonate
- 12.1.5. Other Types
- 12.2. Market Analysis, Insights and Forecast - by End-user Industry
- 12.2.1. Automotive
- 12.2.2. Buildings and Construction
- 12.2.3. Defense
- 12.2.4. Other End-user Industries
- 12.1. Market Analysis, Insights and Forecast - by Type
- 13. Competitive Analysis
- 13.1. Company Profiles
- 13.1.1 Total Security Solutions*List Not Exhaustive
- 13.1.1.1. Company Overview
- 13.1.1.2. Products
- 13.1.1.3. Company Financials
- 13.1.1.4. SWOT Analysis
- 13.1.2 Nippon Sheet Glass Co Ltd
- 13.1.2.1. Company Overview
- 13.1.2.2. Products
- 13.1.2.3. Company Financials
- 13.1.2.4. SWOT Analysis
- 13.1.3 Fuyao Glass America
- 13.1.3.1. Company Overview
- 13.1.3.2. Products
- 13.1.3.3. Company Financials
- 13.1.3.4. SWOT Analysis
- 13.1.4 Saint-Gobain
- 13.1.4.1. Company Overview
- 13.1.4.2. Products
- 13.1.4.3. Company Financials
- 13.1.4.4. SWOT Analysis
- 13.1.5 Taiwan Glass Ind Corp
- 13.1.5.1. Company Overview
- 13.1.5.2. Products
- 13.1.5.3. Company Financials
- 13.1.5.4. SWOT Analysis
- 13.1.6 Armortex
- 13.1.6.1. Company Overview
- 13.1.6.2. Products
- 13.1.6.3. Company Financials
- 13.1.6.4. SWOT Analysis
- 13.1.7 Centigon Security Group
- 13.1.7.1. Company Overview
- 13.1.7.2. Products
- 13.1.7.3. Company Financials
- 13.1.7.4. SWOT Analysis
- 13.1.8 Guardian Industries Holdings
- 13.1.8.1. Company Overview
- 13.1.8.2. Products
- 13.1.8.3. Company Financials
- 13.1.8.4. SWOT Analysis
- 13.1.9 Asahi India Glass Limited
- 13.1.9.1. Company Overview
- 13.1.9.2. Products
- 13.1.9.3. Company Financials
- 13.1.9.4. SWOT Analysis
- 13.1.10 Armass glass
- 13.1.10.1. Company Overview
- 13.1.10.2. Products
- 13.1.10.3. Company Financials
- 13.1.10.4. SWOT Analysis
- 13.1.11 STEC ARMOUR GLASS
- 13.1.11.1. Company Overview
- 13.1.11.2. Products
- 13.1.11.3. Company Financials
- 13.1.11.4. SWOT Analysis
- 13.1.12 Consolidated Glass Holdings Inc
- 13.1.12.1. Company Overview
- 13.1.12.2. Products
- 13.1.12.3. Company Financials
- 13.1.12.4. SWOT Analysis
- 13.1.13 Binswanger Glass
- 13.1.13.1. Company Overview
- 13.1.13.2. Products
- 13.1.13.3. Company Financials
- 13.1.13.4. SWOT Analysis
- 13.1.14 Guangdong Golden Glass Technologies Limited
- 13.1.14.1. Company Overview
- 13.1.14.2. Products
- 13.1.14.3. Company Financials
- 13.1.14.4. SWOT Analysis
- 13.1.15 SCHOTT AG
- 13.1.15.1. Company Overview
- 13.1.15.2. Products
- 13.1.15.3. Company Financials
- 13.1.15.4. SWOT Analysis
- 13.1.1 Total Security Solutions*List Not Exhaustive
- 13.2. Market Entropy
- 13.2.1 Company's Key Areas Served
- 13.2.2 Recent Developments
- 13.3. Company Market Share Analysis 2025
- 13.3.1 Top 5 Companies Market Share Analysis
- 13.3.2 Top 3 Companies Market Share Analysis
- 13.4. List of Potential Customers
- 14. Research Methodology
List of Figures
- Figure 1: Global Bulletproof Glass Industry Revenue Breakdown (billion, %) by Region 2025 & 2033
- Figure 2: Asia Pacific Bulletproof Glass Industry Revenue (billion), by Type 2025 & 2033
- Figure 3: Asia Pacific Bulletproof Glass Industry Revenue Share (%), by Type 2025 & 2033
- Figure 4: Asia Pacific Bulletproof Glass Industry Revenue (billion), by End-user Industry 2025 & 2033
- Figure 5: Asia Pacific Bulletproof Glass Industry Revenue Share (%), by End-user Industry 2025 & 2033
- Figure 6: Asia Pacific Bulletproof Glass Industry Revenue (billion), by Country 2025 & 2033
- Figure 7: Asia Pacific Bulletproof Glass Industry Revenue Share (%), by Country 2025 & 2033
- Figure 8: North America Bulletproof Glass Industry Revenue (billion), by Type 2025 & 2033
- Figure 9: North America Bulletproof Glass Industry Revenue Share (%), by Type 2025 & 2033
- Figure 10: North America Bulletproof Glass Industry Revenue (billion), by End-user Industry 2025 & 2033
- Figure 11: North America Bulletproof Glass Industry Revenue Share (%), by End-user Industry 2025 & 2033
- Figure 12: North America Bulletproof Glass Industry Revenue (billion), by Country 2025 & 2033
- Figure 13: North America Bulletproof Glass Industry Revenue Share (%), by Country 2025 & 2033
- Figure 14: Europe Bulletproof Glass Industry Revenue (billion), by Type 2025 & 2033
- Figure 15: Europe Bulletproof Glass Industry Revenue Share (%), by Type 2025 & 2033
- Figure 16: Europe Bulletproof Glass Industry Revenue (billion), by End-user Industry 2025 & 2033
- Figure 17: Europe Bulletproof Glass Industry Revenue Share (%), by End-user Industry 2025 & 2033
- Figure 18: Europe Bulletproof Glass Industry Revenue (billion), by Country 2025 & 2033
- Figure 19: Europe Bulletproof Glass Industry Revenue Share (%), by Country 2025 & 2033
- Figure 20: South America Bulletproof Glass Industry Revenue (billion), by Type 2025 & 2033
- Figure 21: South America Bulletproof Glass Industry Revenue Share (%), by Type 2025 & 2033
- Figure 22: South America Bulletproof Glass Industry Revenue (billion), by End-user Industry 2025 & 2033
- Figure 23: South America Bulletproof Glass Industry Revenue Share (%), by End-user Industry 2025 & 2033
- Figure 24: South America Bulletproof Glass Industry Revenue (billion), by Country 2025 & 2033
- Figure 25: South America Bulletproof Glass Industry Revenue Share (%), by Country 2025 & 2033
- Figure 26: Middle East Bulletproof Glass Industry Revenue (billion), by Type 2025 & 2033
- Figure 27: Middle East Bulletproof Glass Industry Revenue Share (%), by Type 2025 & 2033
- Figure 28: Middle East Bulletproof Glass Industry Revenue (billion), by End-user Industry 2025 & 2033
- Figure 29: Middle East Bulletproof Glass Industry Revenue Share (%), by End-user Industry 2025 & 2033
- Figure 30: Middle East Bulletproof Glass Industry Revenue (billion), by Country 2025 & 2033
- Figure 31: Middle East Bulletproof Glass Industry Revenue Share (%), by Country 2025 & 2033
- Figure 32: Saudi Arabia Bulletproof Glass Industry Revenue (billion), by Type 2025 & 2033
- Figure 33: Saudi Arabia Bulletproof Glass Industry Revenue Share (%), by Type 2025 & 2033
- Figure 34: Saudi Arabia Bulletproof Glass Industry Revenue (billion), by End-user Industry 2025 & 2033
- Figure 35: Saudi Arabia Bulletproof Glass Industry Revenue Share (%), by End-user Industry 2025 & 2033
- Figure 36: Saudi Arabia Bulletproof Glass Industry Revenue (billion), by Country 2025 & 2033
- Figure 37: Saudi Arabia Bulletproof Glass Industry Revenue Share (%), by Country 2025 & 2033
List of Tables
- Table 1: Global Bulletproof Glass Industry Revenue billion Forecast, by Type 2020 & 2033
- Table 2: Global Bulletproof Glass Industry Revenue billion Forecast, by End-user Industry 2020 & 2033
- Table 3: Global Bulletproof Glass Industry Revenue billion Forecast, by Region 2020 & 2033
- Table 4: Global Bulletproof Glass Industry Revenue billion Forecast, by Type 2020 & 2033
- Table 5: Global Bulletproof Glass Industry Revenue billion Forecast, by End-user Industry 2020 & 2033
- Table 6: Global Bulletproof Glass Industry Revenue billion Forecast, by Country 2020 & 2033
- Table 7: China Bulletproof Glass Industry Revenue (billion) Forecast, by Application 2020 & 2033
- Table 8: India Bulletproof Glass Industry Revenue (billion) Forecast, by Application 2020 & 2033
- Table 9: Japan Bulletproof Glass Industry Revenue (billion) Forecast, by Application 2020 & 2033
- Table 10: South Korea Bulletproof Glass Industry Revenue (billion) Forecast, by Application 2020 & 2033
- Table 11: Rest of Asia Pacific Bulletproof Glass Industry Revenue (billion) Forecast, by Application 2020 & 2033
- Table 12: Global Bulletproof Glass Industry Revenue billion Forecast, by Type 2020 & 2033
- Table 13: Global Bulletproof Glass Industry Revenue billion Forecast, by End-user Industry 2020 & 2033
- Table 14: Global Bulletproof Glass Industry Revenue billion Forecast, by Country 2020 & 2033
- Table 15: United States Bulletproof Glass Industry Revenue (billion) Forecast, by Application 2020 & 2033
- Table 16: Canada Bulletproof Glass Industry Revenue (billion) Forecast, by Application 2020 & 2033
- Table 17: Mexico Bulletproof Glass Industry Revenue (billion) Forecast, by Application 2020 & 2033
- Table 18: Global Bulletproof Glass Industry Revenue billion Forecast, by Type 2020 & 2033
- Table 19: Global Bulletproof Glass Industry Revenue billion Forecast, by End-user Industry 2020 & 2033
- Table 20: Global Bulletproof Glass Industry Revenue billion Forecast, by Country 2020 & 2033
- Table 21: Germany Bulletproof Glass Industry Revenue (billion) Forecast, by Application 2020 & 2033
- Table 22: United Kingdom Bulletproof Glass Industry Revenue (billion) Forecast, by Application 2020 & 2033
- Table 23: France Bulletproof Glass Industry Revenue (billion) Forecast, by Application 2020 & 2033
- Table 24: Italy Bulletproof Glass Industry Revenue (billion) Forecast, by Application 2020 & 2033
- Table 25: Rest of Europe Bulletproof Glass Industry Revenue (billion) Forecast, by Application 2020 & 2033
- Table 26: Global Bulletproof Glass Industry Revenue billion Forecast, by Type 2020 & 2033
- Table 27: Global Bulletproof Glass Industry Revenue billion Forecast, by End-user Industry 2020 & 2033
- Table 28: Global Bulletproof Glass Industry Revenue billion Forecast, by Country 2020 & 2033
- Table 29: Brazil Bulletproof Glass Industry Revenue (billion) Forecast, by Application 2020 & 2033
- Table 30: Argentina Bulletproof Glass Industry Revenue (billion) Forecast, by Application 2020 & 2033
- Table 31: Rest of South America Bulletproof Glass Industry Revenue (billion) Forecast, by Application 2020 & 2033
- Table 32: Global Bulletproof Glass Industry Revenue billion Forecast, by Type 2020 & 2033
- Table 33: Global Bulletproof Glass Industry Revenue billion Forecast, by End-user Industry 2020 & 2033
- Table 34: Global Bulletproof Glass Industry Revenue billion Forecast, by Country 2020 & 2033
- Table 35: Global Bulletproof Glass Industry Revenue billion Forecast, by Type 2020 & 2033
- Table 36: Global Bulletproof Glass Industry Revenue billion Forecast, by End-user Industry 2020 & 2033
- Table 37: Global Bulletproof Glass Industry Revenue billion Forecast, by Country 2020 & 2033
- Table 38: South Africa Bulletproof Glass Industry Revenue (billion) Forecast, by Application 2020 & 2033
- Table 39: Rest of Middle East Bulletproof Glass Industry Revenue (billion) Forecast, by Application 2020 & 2033
Frequently Asked Questions
1. What is the projected Compound Annual Growth Rate (CAGR) of the Bulletproof Glass Industry?
The projected CAGR is approximately 11.78%.
2. Which companies are prominent players in the Bulletproof Glass Industry?
Key companies in the market include Total Security Solutions*List Not Exhaustive, Nippon Sheet Glass Co Ltd, Fuyao Glass America, Saint-Gobain, Taiwan Glass Ind Corp, Armortex, Centigon Security Group, Guardian Industries Holdings, Asahi India Glass Limited, Armass glass, STEC ARMOUR GLASS, Consolidated Glass Holdings Inc, Binswanger Glass, Guangdong Golden Glass Technologies Limited, SCHOTT AG.
3. What are the main segments of the Bulletproof Glass Industry?
The market segments include Type, End-user Industry.
4. Can you provide details about the market size?
The market size is estimated to be USD 10.83 billion as of 2022.
5. What are some drivers contributing to market growth?
High Military Spending; Increased Development and Construction Activity.
6. What are the notable trends driving market growth?
Increasing Demand from Defense Sector to Dominate the Market.
7. Are there any restraints impacting market growth?
High-end pricing of Raw Materials.
8. Can you provide examples of recent developments in the market?
January 2023: Asahi India Glass Limited announced its collaboration with Enormous Brands to create brand films for its complete doors and windows solutions brand, AIS Windows. With this collaboration, AIS Windows is aiming to make a large impact in the doors and windows segment.
9. What pricing options are available for accessing the report?
Pricing options include single-user, multi-user, and enterprise licenses priced at USD 4750, USD 5250, and USD 8750 respectively.
10. Is the market size provided in terms of value or volume?
The market size is provided in terms of value, measured in billion.
11. Are there any specific market keywords associated with the report?
Yes, the market keyword associated with the report is "Bulletproof Glass Industry," which aids in identifying and referencing the specific market segment covered.
12. How do I determine which pricing option suits my needs best?
The pricing options vary based on user requirements and access needs. Individual users may opt for single-user licenses, while businesses requiring broader access may choose multi-user or enterprise licenses for cost-effective access to the report.
13. Are there any additional resources or data provided in the Bulletproof Glass Industry report?
While the report offers comprehensive insights, it's advisable to review the specific contents or supplementary materials provided to ascertain if additional resources or data are available.
14. How can I stay updated on further developments or reports in the Bulletproof Glass Industry?
To stay informed about further developments, trends, and reports in the Bulletproof Glass Industry, consider subscribing to industry newsletters, following relevant companies and organizations, or regularly checking reputable industry news sources and publications.
Methodology
Step 1 - Identification of Relevant Samples Size from Population Database


Step 2 - Approaches for Defining Global Market Size (Value, Volume* & Price*)

Note*: In applicable scenarios
Step 3 - Data Sources
Primary Research
- Web Analytics
- Survey Reports
- Research Institute
- Latest Research Reports
- Opinion Leaders
Secondary Research
- Annual Reports
- White Paper
- Latest Press Release
- Industry Association
- Paid Database
- Investor Presentations

Step 4 - Data Triangulation
Involves using different sources of information in order to increase the validity of a study
These sources are likely to be stakeholders in a program - participants, other researchers, program staff, other community members, and so on.
Then we put all data in single framework & apply various statistical tools to find out the dynamic on the market.
During the analysis stage, feedback from the stakeholder groups would be compared to determine areas of agreement as well as areas of divergence