

Key Insights
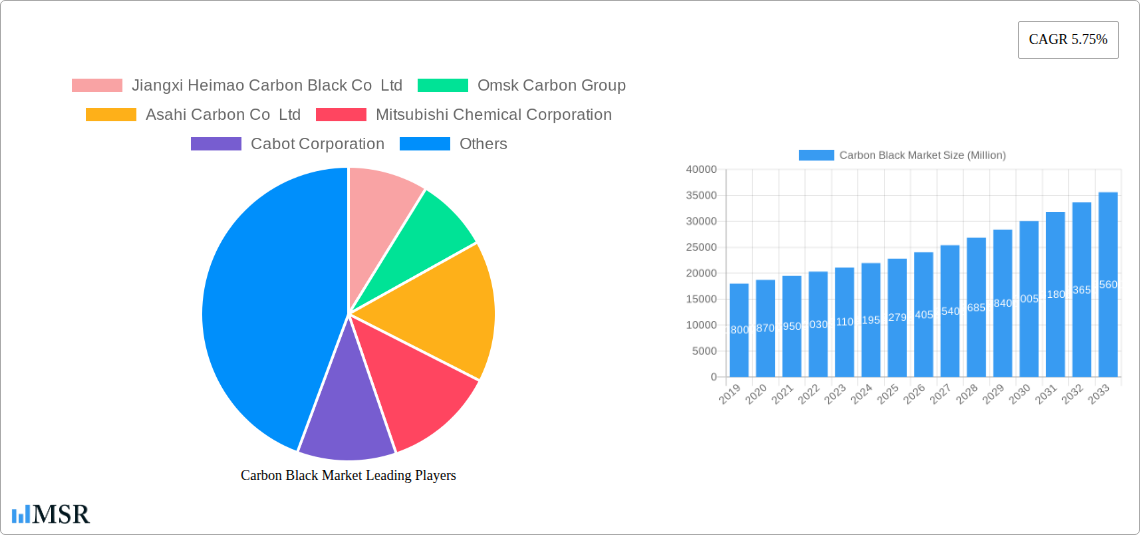
The global Carbon Black market is poised for significant growth, projected to reach a substantial valuation by 2025, driven by a robust Compound Annual Growth Rate (CAGR) of 5.75%. This expansion is primarily fueled by the burgeoning demand from the automotive sector for tire manufacturing, where carbon black acts as a critical reinforcing agent, enhancing durability and performance. Beyond tires, its widespread application in industrial rubber products, plastics, and as a pigment in toners, printing inks, and coatings further underpins this upward trajectory. Emerging applications in textile fibers and other specialized sectors are also contributing to market diversification and sustained demand. The market's resilience is evident in its steady growth across various segments, indicating a healthy and expanding industrial ecosystem reliant on this versatile material.
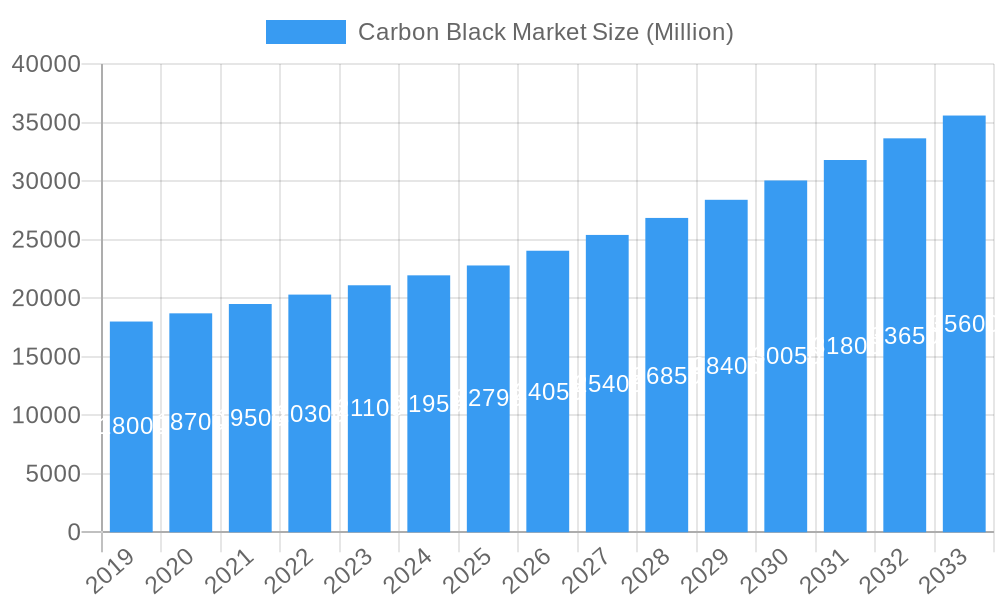
Carbon Black Market Market Size (In Billion)
The market dynamics are characterized by key trends such as increasing adoption of specialized carbon blacks for high-performance applications and a growing focus on sustainable production methods, including the use of recycled materials and cleaner manufacturing processes. While the market demonstrates strong growth potential, certain restraints, such as fluctuating raw material prices and stringent environmental regulations in some regions, could pose challenges. However, strategic investments by leading companies like Cabot Corporation, Birla Carbon, and Orion Engineered Carbons, alongside emerging players, are expected to mitigate these restraints and capitalize on growth opportunities. Geographically, the Asia Pacific region, particularly China and India, is anticipated to dominate the market due to its robust manufacturing base and increasing consumption across diverse end-use industries. North America and Europe also represent significant markets, with a growing emphasis on specialty carbon blacks and sustainable solutions.
Carbon Black Market Company Market Share
Comprehensive Carbon Black Market Report: Insights, Trends, and Future Outlook (2019-2033)
This in-depth report provides a holistic analysis of the global carbon black market, offering critical insights for industry stakeholders, investors, and manufacturers. Covering the historical period of 2019-2024, base year of 2025, and a robust forecast period from 2025 to 2033, this research delves into market dynamics, key trends, segmentation, product developments, challenges, and emerging opportunities within the specialty carbon black and rubber carbon black sectors. Discover the strategic initiatives of leading players like Cabot Corporation, Birla Carbon, Omsk Carbon Group, and Orion Engineered Carbons SA, and understand the pivotal role of furnace black and its applications in tires and industrial rubber products.
Carbon Black Market Market Concentration & Dynamics
The carbon black market exhibits a moderate to high level of concentration, with a few dominant global players accounting for a significant portion of production capacity. Key companies such as Cabot Corporation, Birla Carbon (Aditya Birla Group), Orion Engineered Carbons SA, and China Synthetic Rubber Corporation (CSRC) are instrumental in shaping market dynamics through their extensive product portfolios and geographical reach. Innovation ecosystems are thriving, driven by the continuous demand for high-performance carbon black grades in sectors like automotive and specialty plastics. Regulatory frameworks, particularly concerning environmental emissions and product safety, are becoming increasingly stringent, influencing manufacturing processes and R&D investments. Substitute products, while present in certain niche applications, have not significantly eroded the core demand for carbon black due to its unique reinforcing and pigmenting properties. End-user trends are shifting towards sustainable and eco-friendly carbon black solutions, prompting manufacturers to invest in advanced production technologies. Mergers and acquisitions (M&A) activities remain a strategic tool for market expansion and consolidation. For instance, recent M&A deals have focused on acquiring specialized carbon black producers to bolster portfolios in high-value applications. The market share distribution reveals a landscape where established players maintain a strong foothold, while emerging companies are carving out niches through innovation.
Carbon Black Market Industry Insights & Trends
The global carbon black market is poised for robust growth, driven by escalating demand from key end-use industries, particularly the automotive sector for tire manufacturing. The rubber carbon black segment, crucial for enhancing the durability and performance of tires, will continue to be a primary growth engine. Beyond tires, the increasing utilization of carbon black in plastics for UV protection, conductivity, and pigmentation in applications like masterbatches and engineered polymers is a significant trend. Furthermore, the specialty carbon black market, catering to high-value applications such as toners, printing inks, coatings, and conductive materials, is experiencing accelerated growth due to its superior performance characteristics. Technological advancements in carbon black production, including more efficient furnace black processes and the development of novel grades with enhanced properties, are shaping industry trends. For example, the adoption of advanced process controls and energy recovery systems in furnace black production aims to improve sustainability and cost-effectiveness. Evolving consumer behaviors, such as the growing preference for electric vehicles (EVs) that often require specialized tire formulations for optimal performance and longevity, are indirectly influencing carbon black demand. The market size of the carbon black industry was estimated to be around $17,000 Million in 2025, with a projected Compound Annual Growth Rate (CAGR) of approximately 5.2% during the forecast period of 2025-2033. This growth is underpinned by the increasing global vehicle production and the continuous innovation in materials science. The carbon black market is also witnessing a rising trend in the adoption of sustainable and recycled carbon black, driven by environmental regulations and corporate sustainability goals.
Key Markets & Segments Leading Carbon Black Market
The carbon black market is predominantly led by furnace black process, which accounts for the lion's share of global production and consumption due to its versatility and cost-effectiveness. This process is indispensable for the manufacturing of various carbon black grades used extensively in the tires and industrial rubber products segment. The sheer volume of tire production globally, driven by the automotive industry’s consistent demand for replacement tires and new vehicles, solidifies this segment’s dominance.
Process Type Dominance:
- Furnace Black: The bedrock of the carbon black industry, this process is favored for its scalability and the ability to produce a wide range of grades, from reinforcing to semi-reinforcing and conductive blacks. Its widespread application in tires, belts, hoses, and other rubber goods makes it the most significant segment. The projected market size for furnace black is expected to exceed $15,000 Million by 2025.
Application Segment Leadership:
- Tires and Industrial Rubber Products: This segment is the primary consumer of carbon black, with tires alone constituting over 70% of the total carbon black consumption. The demand is fueled by original equipment manufacturers (OEMs) and the replacement market. Economic growth, infrastructure development, and increasing vehicle ownership globally are key drivers. The market for carbon black in this segment is estimated to reach $13,500 Million in 2025.
- Plastic: The use of carbon black in plastics is a rapidly growing segment. It provides UV stability, electrical conductivity, and pigmentation to polymers used in automotive components, packaging, electronics, and construction materials. The increasing demand for high-performance plastics in these sectors contributes to its growth.
- Other Applications: This diverse segment includes specialized uses in batteries, conductive polymers, textiles, and construction chemicals. The growing demand for advanced materials in emerging technologies is expected to drive significant growth in this area.
Geographically, Asia-Pacific, particularly China and India, is the largest and fastest-growing market for carbon black. This is attributable to the region's massive automotive production, expanding industrial base, and increasing infrastructure development. North America and Europe remain significant markets, driven by established automotive industries and a growing demand for high-performance specialty carbon black.
Carbon Black Market Product Developments
Recent product developments in the carbon black market are characterized by a focus on enhanced performance, sustainability, and specialized applications. Manufacturers are innovating to create carbon black grades that offer superior reinforcement, improved conductivity, and better UV protection for polymers. The development of specialty carbon blacks with precise particle sizes and surface chemistries is crucial for meeting the stringent requirements of high-end applications such as conductive plastics for electronics, advanced coatings with enhanced durability, and high-performance toners for printing. Emphasis is also placed on producing eco-friendlier carbon black, including recycled carbon black derived from end-of-life tires, which aligns with global sustainability initiatives and circular economy principles.
Challenges in the Carbon Black Market Market
The carbon black market faces several challenges that can impede growth and profitability. Regulatory hurdles, particularly those related to environmental emissions from production facilities, require significant investment in pollution control technologies. Fluctuations in feedstock prices, primarily derived from petroleum products, can impact manufacturing costs and market pricing strategies. Supply chain disruptions, influenced by geopolitical events and logistical complexities, can affect the timely delivery of raw materials and finished products. Moreover, the competitive pressure from established players and the emergence of new entrants, especially in developing economies, necessitate continuous innovation and cost optimization. The pursuit of sustainable alternatives also poses a challenge as the industry transitions towards greener production methods.
Forces Driving Carbon Black Market Growth
Several key forces are driving the growth of the carbon black market. The burgeoning automotive industry, with its consistent demand for tires and rubber components, remains a primary growth accelerator. The increasing adoption of carbon black in the plastics industry, for applications demanding UV resistance, conductivity, and pigmentation, is a significant trend. Technological advancements in carbon black production, leading to the development of higher-performance grades and more sustainable manufacturing processes, also fuel market expansion. Furthermore, the growing demand for specialty carbon blacks in sectors like electronics, batteries, and coatings, driven by innovation in these end-use industries, is contributing to overall market growth. Economic development and urbanization in emerging economies are also pivotal in boosting demand for products that utilize carbon black.
Challenges in the Carbon Black Market Market
Long-term growth catalysts for the carbon black market are deeply intertwined with ongoing innovation and strategic market expansion. The continuous development of advanced carbon black grades with unique properties, tailored for emerging applications in electric vehicles, renewable energy storage (like batteries), and high-performance polymers, will be crucial. Strategic partnerships and collaborations between carbon black manufacturers and end-users are fostering the co-creation of innovative solutions. Market expansions into regions with growing industrial footprints, coupled with investments in sustainable production technologies, will ensure sustained growth. The increasing focus on the circular economy, particularly the valorization of end-of-life tires into recycled carbon black, presents a significant long-term growth opportunity.
Emerging Opportunities in Carbon Black Market
Emerging opportunities within the carbon black market are being shaped by evolving technological landscapes and changing consumer preferences. The demand for lightweight and durable materials in the automotive sector, especially for electric vehicles, is creating opportunities for specialized carbon black grades that enhance tire performance and battery conductivity. The growth of the conductive polymers market, driven by applications in smart textiles, wearable electronics, and advanced packaging, is a significant avenue for specialty carbon black. Furthermore, the increasing focus on sustainability is driving demand for recycled carbon black and bio-based alternatives. Opportunities also exist in developing carbon black solutions for additive manufacturing (3D printing) and advanced composite materials, catering to industries seeking novel material properties.
Leading Players in the Carbon Black Market Sector
- Jiangxi Heimao Carbon Black Co Ltd
- Omsk Carbon Group
- Asahi Carbon Co Ltd
- Mitsubishi Chemical Corporation
- Cabot Corporation
- Epsilon Carbon Private Limited
- NNPC Limited
- Himadri Speciality Chemical Ltd
- ADNOC Group
- Longxing Chemical Stock Co Ltd
- PCBL Limited
- International CSRC Investment Holdings Co Ltd
- Imerys SA
- Tokai Carbon Co Ltd
- OCI Company Ltd
- BKT Carbon
- Orion Engineered Carbons SA
- Birla Carbon (Aditya Birla Group)
Key Milestones in Carbon Black Market Industry
- June 2023: PCBL Limited initiated two growth projects, including a new plant expansion in Chennai, Tamil Nadu, and an existing plant project in Mundra, Gujarat. The first stage of the specialty chemical line is expected by Q1 FY 2023-24, aiming for a total manufacturing capacity of 790,000 MTPA and 122 MW of renewable energy.
- February 2023: Balkrishna Industries Ltd (BKT) intensified its carbon black production, planning a ~20% capacity increase. The Bhuj plant in Gujarat will expand to produce 198 kilotons per year, adding to its existing 65 ktpa capacity for tire tread applications.
- June 2022: ADNOC Distribution entered a new carbon black supply agreement with ADNOC, facilitating market testing for carbon black.
Strategic Outlook for Carbon Black Market Market
The strategic outlook for the carbon black market is characterized by a strong emphasis on sustainable growth, technological innovation, and market diversification. Key growth accelerators include continued expansion in the automotive sector, particularly with the rise of electric vehicles requiring specialized tire performance. The increasing application of carbon black in high-growth sectors such as plastics, advanced coatings, and electronics presents significant opportunities. Investments in R&D to develop new carbon black grades with enhanced functionalities and improved environmental profiles will be critical. Furthermore, strategic acquisitions and partnerships will enable companies to strengthen their market positions and expand their product portfolios. The growing adoption of recycled carbon black and the exploration of bio-based feedstocks will also play a crucial role in shaping the future landscape of the carbon black industry.
Carbon Black Market Segmentation
-
1. Process Type
- 1.1. Furnace Black
- 1.2. Gas Black
- 1.3. Lamp Black
- 1.4. Thermal Black
-
2. Application
- 2.1. Tires and Industrial Rubber Products
- 2.2. Plastic
- 2.3. Toners and Printing Inks
- 2.4. Coatings
- 2.5. Textile Fiber
- 2.6. Other Applications
Carbon Black Market Segmentation By Geography
-
1. Asia Pacific
- 1.1. China
- 1.2. India
- 1.3. Japan
- 1.4. South Korea
- 1.5. Rest of Asia Pacific
-
2. North America
- 2.1. United States
- 2.2. Canada
- 2.3. Mexico
-
3. Europe
- 3.1. Germany
- 3.2. United Kingdom
- 3.3. Italy
- 3.4. France
- 3.5. Rest of Europe
-
4. South America
- 4.1. Brazil
- 4.2. Argentina
- 4.3. Rest of South America
-
5. Middle East and Africa
- 5.1. Saudi Arabia
- 5.2. South Africa
- 5.3. United Arab Emirates
- 5.4. Rest of Middle East and Africa
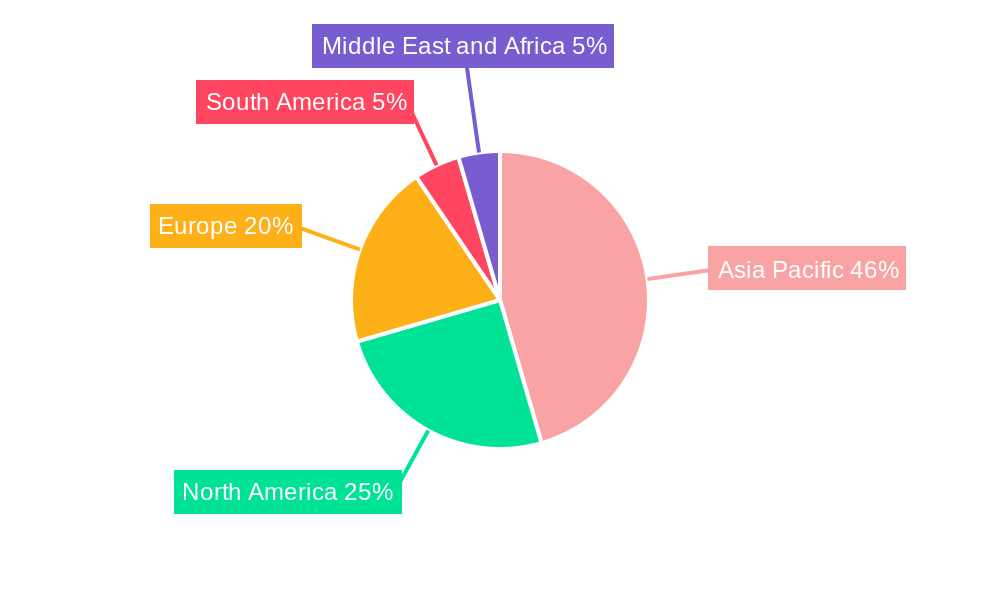
Carbon Black Market Regional Market Share
Geographic Coverage of Carbon Black Market
Carbon Black Market REPORT HIGHLIGHTS
| Aspects | Details |
|---|---|
| Study Period | 2020-2034 |
| Base Year | 2025 |
| Estimated Year | 2026 |
| Forecast Period | 2026-2034 |
| Historical Period | 2020-2025 |
| Growth Rate | CAGR of 5.75% from 2020-2034 |
| Segmentation |
|
Table of Contents
- 1. Introduction
- 1.1. Research Scope
- 1.2. Market Segmentation
- 1.3. Research Objective
- 1.4. Definitions and Assumptions
- 2. Executive Summary
- 2.1. Market Snapshot
- 3. Market Dynamics
- 3.1. Market Drivers
- 3.2. Market Restrains
- 3.3. Market Trends
- 3.4. Market Opportunities
- 4. Market Factor Analysis
- 4.1. Porters Five Forces
- 4.1.1. Bargaining Power of Suppliers
- 4.1.2. Bargaining Power of Buyers
- 4.1.3. Threat of New Entrants
- 4.1.4. Threat of Substitutes
- 4.1.5. Competitive Rivalry
- 4.2. PESTEL analysis
- 4.3. BCG Analysis
- 4.3.1. Stars (High Growth, High Market Share)
- 4.3.2. Cash Cows (Low Growth, High Market Share)
- 4.3.3. Question Mark (High Growth, Low Market Share)
- 4.3.4. Dogs (Low Growth, Low Market Share)
- 4.4. Ansoff Matrix Analysis
- 4.5. Supply Chain Analysis
- 4.6. Regulatory Landscape
- 4.7. Current Market Potential and Opportunity Assessment (TAM–SAM–SOM Framework)
- 4.8. MSR Analyst Note
- 4.1. Porters Five Forces
- 5. Market Analysis, Insights and Forecast 2021-2033
- 5.1. Market Analysis, Insights and Forecast - by Process Type
- 5.1.1. Furnace Black
- 5.1.2. Gas Black
- 5.1.3. Lamp Black
- 5.1.4. Thermal Black
- 5.2. Market Analysis, Insights and Forecast - by Application
- 5.2.1. Tires and Industrial Rubber Products
- 5.2.2. Plastic
- 5.2.3. Toners and Printing Inks
- 5.2.4. Coatings
- 5.2.5. Textile Fiber
- 5.2.6. Other Applications
- 5.3. Market Analysis, Insights and Forecast - by Region
- 5.3.1. Asia Pacific
- 5.3.2. North America
- 5.3.3. Europe
- 5.3.4. South America
- 5.3.5. Middle East and Africa
- 5.1. Market Analysis, Insights and Forecast - by Process Type
- 6. Global Carbon Black Market Analysis, Insights and Forecast, 2021-2033
- 6.1. Market Analysis, Insights and Forecast - by Process Type
- 6.1.1. Furnace Black
- 6.1.2. Gas Black
- 6.1.3. Lamp Black
- 6.1.4. Thermal Black
- 6.2. Market Analysis, Insights and Forecast - by Application
- 6.2.1. Tires and Industrial Rubber Products
- 6.2.2. Plastic
- 6.2.3. Toners and Printing Inks
- 6.2.4. Coatings
- 6.2.5. Textile Fiber
- 6.2.6. Other Applications
- 6.1. Market Analysis, Insights and Forecast - by Process Type
- 7. Asia Pacific Carbon Black Market Analysis, Insights and Forecast, 2020-2032
- 7.1. Market Analysis, Insights and Forecast - by Process Type
- 7.1.1. Furnace Black
- 7.1.2. Gas Black
- 7.1.3. Lamp Black
- 7.1.4. Thermal Black
- 7.2. Market Analysis, Insights and Forecast - by Application
- 7.2.1. Tires and Industrial Rubber Products
- 7.2.2. Plastic
- 7.2.3. Toners and Printing Inks
- 7.2.4. Coatings
- 7.2.5. Textile Fiber
- 7.2.6. Other Applications
- 7.1. Market Analysis, Insights and Forecast - by Process Type
- 8. North America Carbon Black Market Analysis, Insights and Forecast, 2020-2032
- 8.1. Market Analysis, Insights and Forecast - by Process Type
- 8.1.1. Furnace Black
- 8.1.2. Gas Black
- 8.1.3. Lamp Black
- 8.1.4. Thermal Black
- 8.2. Market Analysis, Insights and Forecast - by Application
- 8.2.1. Tires and Industrial Rubber Products
- 8.2.2. Plastic
- 8.2.3. Toners and Printing Inks
- 8.2.4. Coatings
- 8.2.5. Textile Fiber
- 8.2.6. Other Applications
- 8.1. Market Analysis, Insights and Forecast - by Process Type
- 9. Europe Carbon Black Market Analysis, Insights and Forecast, 2020-2032
- 9.1. Market Analysis, Insights and Forecast - by Process Type
- 9.1.1. Furnace Black
- 9.1.2. Gas Black
- 9.1.3. Lamp Black
- 9.1.4. Thermal Black
- 9.2. Market Analysis, Insights and Forecast - by Application
- 9.2.1. Tires and Industrial Rubber Products
- 9.2.2. Plastic
- 9.2.3. Toners and Printing Inks
- 9.2.4. Coatings
- 9.2.5. Textile Fiber
- 9.2.6. Other Applications
- 9.1. Market Analysis, Insights and Forecast - by Process Type
- 10. South America Carbon Black Market Analysis, Insights and Forecast, 2020-2032
- 10.1. Market Analysis, Insights and Forecast - by Process Type
- 10.1.1. Furnace Black
- 10.1.2. Gas Black
- 10.1.3. Lamp Black
- 10.1.4. Thermal Black
- 10.2. Market Analysis, Insights and Forecast - by Application
- 10.2.1. Tires and Industrial Rubber Products
- 10.2.2. Plastic
- 10.2.3. Toners and Printing Inks
- 10.2.4. Coatings
- 10.2.5. Textile Fiber
- 10.2.6. Other Applications
- 10.1. Market Analysis, Insights and Forecast - by Process Type
- 11. Middle East and Africa Carbon Black Market Analysis, Insights and Forecast, 2020-2032
- 11.1. Market Analysis, Insights and Forecast - by Process Type
- 11.1.1. Furnace Black
- 11.1.2. Gas Black
- 11.1.3. Lamp Black
- 11.1.4. Thermal Black
- 11.2. Market Analysis, Insights and Forecast - by Application
- 11.2.1. Tires and Industrial Rubber Products
- 11.2.2. Plastic
- 11.2.3. Toners and Printing Inks
- 11.2.4. Coatings
- 11.2.5. Textile Fiber
- 11.2.6. Other Applications
- 11.1. Market Analysis, Insights and Forecast - by Process Type
- 12. Competitive Analysis
- 12.1. Company Profiles
- 12.1.1 Jiangxi Heimao Carbon Black Co Ltd
- 12.1.1.1. Company Overview
- 12.1.1.2. Products
- 12.1.1.3. Company Financials
- 12.1.1.4. SWOT Analysis
- 12.1.2 Omsk Carbon Group
- 12.1.2.1. Company Overview
- 12.1.2.2. Products
- 12.1.2.3. Company Financials
- 12.1.2.4. SWOT Analysis
- 12.1.3 Asahi Carbon Co Ltd
- 12.1.3.1. Company Overview
- 12.1.3.2. Products
- 12.1.3.3. Company Financials
- 12.1.3.4. SWOT Analysis
- 12.1.4 Mitsubishi Chemical Corporation
- 12.1.4.1. Company Overview
- 12.1.4.2. Products
- 12.1.4.3. Company Financials
- 12.1.4.4. SWOT Analysis
- 12.1.5 Cabot Corporation
- 12.1.5.1. Company Overview
- 12.1.5.2. Products
- 12.1.5.3. Company Financials
- 12.1.5.4. SWOT Analysis
- 12.1.6 Epsilon Carbon Private Limited
- 12.1.6.1. Company Overview
- 12.1.6.2. Products
- 12.1.6.3. Company Financials
- 12.1.6.4. SWOT Analysis
- 12.1.7 NNPC Limited
- 12.1.7.1. Company Overview
- 12.1.7.2. Products
- 12.1.7.3. Company Financials
- 12.1.7.4. SWOT Analysis
- 12.1.8 Himadri Speciality Chemical Ltd
- 12.1.8.1. Company Overview
- 12.1.8.2. Products
- 12.1.8.3. Company Financials
- 12.1.8.4. SWOT Analysis
- 12.1.9 ADNOC Group
- 12.1.9.1. Company Overview
- 12.1.9.2. Products
- 12.1.9.3. Company Financials
- 12.1.9.4. SWOT Analysis
- 12.1.10 Longxing Chemical Stock Co Ltd
- 12.1.10.1. Company Overview
- 12.1.10.2. Products
- 12.1.10.3. Company Financials
- 12.1.10.4. SWOT Analysis
- 12.1.11 PCBL Limited
- 12.1.11.1. Company Overview
- 12.1.11.2. Products
- 12.1.11.3. Company Financials
- 12.1.11.4. SWOT Analysis
- 12.1.12 International CSRC Investment Holdings Co Ltd
- 12.1.12.1. Company Overview
- 12.1.12.2. Products
- 12.1.12.3. Company Financials
- 12.1.12.4. SWOT Analysis
- 12.1.13 Imerys SA
- 12.1.13.1. Company Overview
- 12.1.13.2. Products
- 12.1.13.3. Company Financials
- 12.1.13.4. SWOT Analysis
- 12.1.14 Tokai Carbon Co Ltd*List Not Exhaustive
- 12.1.14.1. Company Overview
- 12.1.14.2. Products
- 12.1.14.3. Company Financials
- 12.1.14.4. SWOT Analysis
- 12.1.15 OCI Company Ltd
- 12.1.15.1. Company Overview
- 12.1.15.2. Products
- 12.1.15.3. Company Financials
- 12.1.15.4. SWOT Analysis
- 12.1.16 BKT Carbon
- 12.1.16.1. Company Overview
- 12.1.16.2. Products
- 12.1.16.3. Company Financials
- 12.1.16.4. SWOT Analysis
- 12.1.17 Orion Engineered Carbons SA
- 12.1.17.1. Company Overview
- 12.1.17.2. Products
- 12.1.17.3. Company Financials
- 12.1.17.4. SWOT Analysis
- 12.1.18 Birla Carbon (Aditya Birla Group)
- 12.1.18.1. Company Overview
- 12.1.18.2. Products
- 12.1.18.3. Company Financials
- 12.1.18.4. SWOT Analysis
- 12.1.1 Jiangxi Heimao Carbon Black Co Ltd
- 12.2. Market Entropy
- 12.2.1 Company's Key Areas Served
- 12.2.2 Recent Developments
- 12.3. Company Market Share Analysis 2025
- 12.3.1 Top 5 Companies Market Share Analysis
- 12.3.2 Top 3 Companies Market Share Analysis
- 12.4. List of Potential Customers
- 13. Research Methodology
List of Figures
- Figure 1: Global Carbon Black Market Revenue Breakdown (Million, %) by Region 2025 & 2033
- Figure 2: Asia Pacific Carbon Black Market Revenue (Million), by Process Type 2025 & 2033
- Figure 3: Asia Pacific Carbon Black Market Revenue Share (%), by Process Type 2025 & 2033
- Figure 4: Asia Pacific Carbon Black Market Revenue (Million), by Application 2025 & 2033
- Figure 5: Asia Pacific Carbon Black Market Revenue Share (%), by Application 2025 & 2033
- Figure 6: Asia Pacific Carbon Black Market Revenue (Million), by Country 2025 & 2033
- Figure 7: Asia Pacific Carbon Black Market Revenue Share (%), by Country 2025 & 2033
- Figure 8: North America Carbon Black Market Revenue (Million), by Process Type 2025 & 2033
- Figure 9: North America Carbon Black Market Revenue Share (%), by Process Type 2025 & 2033
- Figure 10: North America Carbon Black Market Revenue (Million), by Application 2025 & 2033
- Figure 11: North America Carbon Black Market Revenue Share (%), by Application 2025 & 2033
- Figure 12: North America Carbon Black Market Revenue (Million), by Country 2025 & 2033
- Figure 13: North America Carbon Black Market Revenue Share (%), by Country 2025 & 2033
- Figure 14: Europe Carbon Black Market Revenue (Million), by Process Type 2025 & 2033
- Figure 15: Europe Carbon Black Market Revenue Share (%), by Process Type 2025 & 2033
- Figure 16: Europe Carbon Black Market Revenue (Million), by Application 2025 & 2033
- Figure 17: Europe Carbon Black Market Revenue Share (%), by Application 2025 & 2033
- Figure 18: Europe Carbon Black Market Revenue (Million), by Country 2025 & 2033
- Figure 19: Europe Carbon Black Market Revenue Share (%), by Country 2025 & 2033
- Figure 20: South America Carbon Black Market Revenue (Million), by Process Type 2025 & 2033
- Figure 21: South America Carbon Black Market Revenue Share (%), by Process Type 2025 & 2033
- Figure 22: South America Carbon Black Market Revenue (Million), by Application 2025 & 2033
- Figure 23: South America Carbon Black Market Revenue Share (%), by Application 2025 & 2033
- Figure 24: South America Carbon Black Market Revenue (Million), by Country 2025 & 2033
- Figure 25: South America Carbon Black Market Revenue Share (%), by Country 2025 & 2033
- Figure 26: Middle East and Africa Carbon Black Market Revenue (Million), by Process Type 2025 & 2033
- Figure 27: Middle East and Africa Carbon Black Market Revenue Share (%), by Process Type 2025 & 2033
- Figure 28: Middle East and Africa Carbon Black Market Revenue (Million), by Application 2025 & 2033
- Figure 29: Middle East and Africa Carbon Black Market Revenue Share (%), by Application 2025 & 2033
- Figure 30: Middle East and Africa Carbon Black Market Revenue (Million), by Country 2025 & 2033
- Figure 31: Middle East and Africa Carbon Black Market Revenue Share (%), by Country 2025 & 2033
List of Tables
- Table 1: Global Carbon Black Market Revenue Million Forecast, by Process Type 2020 & 2033
- Table 2: Global Carbon Black Market Revenue Million Forecast, by Application 2020 & 2033
- Table 3: Global Carbon Black Market Revenue Million Forecast, by Region 2020 & 2033
- Table 4: Global Carbon Black Market Revenue Million Forecast, by Process Type 2020 & 2033
- Table 5: Global Carbon Black Market Revenue Million Forecast, by Application 2020 & 2033
- Table 6: Global Carbon Black Market Revenue Million Forecast, by Country 2020 & 2033
- Table 7: China Carbon Black Market Revenue (Million) Forecast, by Application 2020 & 2033
- Table 8: India Carbon Black Market Revenue (Million) Forecast, by Application 2020 & 2033
- Table 9: Japan Carbon Black Market Revenue (Million) Forecast, by Application 2020 & 2033
- Table 10: South Korea Carbon Black Market Revenue (Million) Forecast, by Application 2020 & 2033
- Table 11: Rest of Asia Pacific Carbon Black Market Revenue (Million) Forecast, by Application 2020 & 2033
- Table 12: Global Carbon Black Market Revenue Million Forecast, by Process Type 2020 & 2033
- Table 13: Global Carbon Black Market Revenue Million Forecast, by Application 2020 & 2033
- Table 14: Global Carbon Black Market Revenue Million Forecast, by Country 2020 & 2033
- Table 15: United States Carbon Black Market Revenue (Million) Forecast, by Application 2020 & 2033
- Table 16: Canada Carbon Black Market Revenue (Million) Forecast, by Application 2020 & 2033
- Table 17: Mexico Carbon Black Market Revenue (Million) Forecast, by Application 2020 & 2033
- Table 18: Global Carbon Black Market Revenue Million Forecast, by Process Type 2020 & 2033
- Table 19: Global Carbon Black Market Revenue Million Forecast, by Application 2020 & 2033
- Table 20: Global Carbon Black Market Revenue Million Forecast, by Country 2020 & 2033
- Table 21: Germany Carbon Black Market Revenue (Million) Forecast, by Application 2020 & 2033
- Table 22: United Kingdom Carbon Black Market Revenue (Million) Forecast, by Application 2020 & 2033
- Table 23: Italy Carbon Black Market Revenue (Million) Forecast, by Application 2020 & 2033
- Table 24: France Carbon Black Market Revenue (Million) Forecast, by Application 2020 & 2033
- Table 25: Rest of Europe Carbon Black Market Revenue (Million) Forecast, by Application 2020 & 2033
- Table 26: Global Carbon Black Market Revenue Million Forecast, by Process Type 2020 & 2033
- Table 27: Global Carbon Black Market Revenue Million Forecast, by Application 2020 & 2033
- Table 28: Global Carbon Black Market Revenue Million Forecast, by Country 2020 & 2033
- Table 29: Brazil Carbon Black Market Revenue (Million) Forecast, by Application 2020 & 2033
- Table 30: Argentina Carbon Black Market Revenue (Million) Forecast, by Application 2020 & 2033
- Table 31: Rest of South America Carbon Black Market Revenue (Million) Forecast, by Application 2020 & 2033
- Table 32: Global Carbon Black Market Revenue Million Forecast, by Process Type 2020 & 2033
- Table 33: Global Carbon Black Market Revenue Million Forecast, by Application 2020 & 2033
- Table 34: Global Carbon Black Market Revenue Million Forecast, by Country 2020 & 2033
- Table 35: Saudi Arabia Carbon Black Market Revenue (Million) Forecast, by Application 2020 & 2033
- Table 36: South Africa Carbon Black Market Revenue (Million) Forecast, by Application 2020 & 2033
- Table 37: United Arab Emirates Carbon Black Market Revenue (Million) Forecast, by Application 2020 & 2033
- Table 38: Rest of Middle East and Africa Carbon Black Market Revenue (Million) Forecast, by Application 2020 & 2033
Frequently Asked Questions
1. What is the projected Compound Annual Growth Rate (CAGR) of the Carbon Black Market?
The projected CAGR is approximately 5.75%.
2. Which companies are prominent players in the Carbon Black Market?
Key companies in the market include Jiangxi Heimao Carbon Black Co Ltd, Omsk Carbon Group, Asahi Carbon Co Ltd, Mitsubishi Chemical Corporation, Cabot Corporation, Epsilon Carbon Private Limited, NNPC Limited, Himadri Speciality Chemical Ltd, ADNOC Group, Longxing Chemical Stock Co Ltd, PCBL Limited, International CSRC Investment Holdings Co Ltd, Imerys SA, Tokai Carbon Co Ltd*List Not Exhaustive, OCI Company Ltd, BKT Carbon, Orion Engineered Carbons SA, Birla Carbon (Aditya Birla Group).
3. What are the main segments of the Carbon Black Market?
The market segments include Process Type, Application.
4. Can you provide details about the market size?
The market size is estimated to be USD 22.79 Million as of 2022.
5. What are some drivers contributing to market growth?
Increasing Market Penetration of Specialty Black; Growing Applications in the Batteries Segment.
6. What are the notable trends driving market growth?
Increasing Application of Tires and Industrial Rubber Products.
7. Are there any restraints impacting market growth?
Increasing Investments for Recovered Carbon Black; Volatility in Prices of Raw Materials.
8. Can you provide examples of recent developments in the market?
June 2023: PCBL Limited initiated two growth projects which incorporate the new plant expansion in Chennai, Tamil Nadu, and an existing plant project at Mundra, Gujarat. This expansion is divided into two stages, and the first stage of the specialty chemical line is expected to be put into operation by the first quarter of the fiscal year 2023-24. As a result, the overall manufacturing capacity of the company is estimated to reach 790,000 MTPA and 122 MW of renewable energy.
9. What pricing options are available for accessing the report?
Pricing options include single-user, multi-user, and enterprise licenses priced at USD 4750, USD 5250, and USD 8750 respectively.
10. Is the market size provided in terms of value or volume?
The market size is provided in terms of value, measured in Million.
11. Are there any specific market keywords associated with the report?
Yes, the market keyword associated with the report is "Carbon Black Market," which aids in identifying and referencing the specific market segment covered.
12. How do I determine which pricing option suits my needs best?
The pricing options vary based on user requirements and access needs. Individual users may opt for single-user licenses, while businesses requiring broader access may choose multi-user or enterprise licenses for cost-effective access to the report.
13. Are there any additional resources or data provided in the Carbon Black Market report?
While the report offers comprehensive insights, it's advisable to review the specific contents or supplementary materials provided to ascertain if additional resources or data are available.
14. How can I stay updated on further developments or reports in the Carbon Black Market?
To stay informed about further developments, trends, and reports in the Carbon Black Market, consider subscribing to industry newsletters, following relevant companies and organizations, or regularly checking reputable industry news sources and publications.
Methodology
Step 1 - Identification of Relevant Samples Size from Population Database


Step 2 - Approaches for Defining Global Market Size (Value, Volume* & Price*)

Note*: In applicable scenarios
Step 3 - Data Sources
Primary Research
- Web Analytics
- Survey Reports
- Research Institute
- Latest Research Reports
- Opinion Leaders
Secondary Research
- Annual Reports
- White Paper
- Latest Press Release
- Industry Association
- Paid Database
- Investor Presentations

Step 4 - Data Triangulation
Involves using different sources of information in order to increase the validity of a study
These sources are likely to be stakeholders in a program - participants, other researchers, program staff, other community members, and so on.
Then we put all data in single framework & apply various statistical tools to find out the dynamic on the market.
During the analysis stage, feedback from the stakeholder groups would be compared to determine areas of agreement as well as areas of divergence