

Key Insights
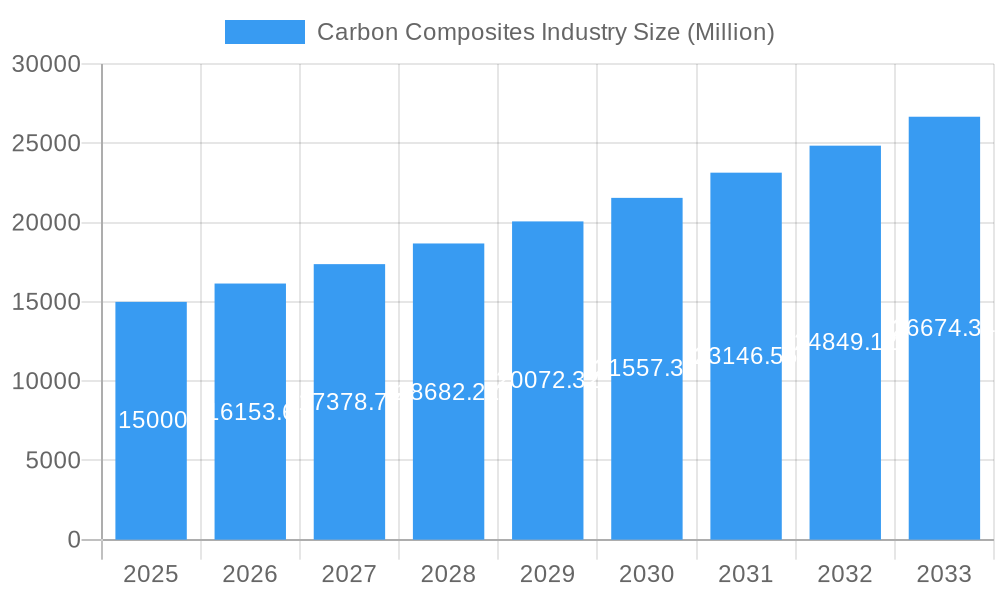
The global carbon composites market is experiencing robust growth, driven by increasing demand across diverse sectors. The market's Compound Annual Growth Rate (CAGR) of 7.68% from 2019 to 2024 suggests a significant expansion, indicating a strong trajectory for continued development. This growth is fueled by several key factors. The automotive industry's push for lighter and more fuel-efficient vehicles is a primary driver, with carbon composites offering superior strength-to-weight ratios compared to traditional materials. Furthermore, the aerospace and defense industries are increasingly adopting carbon composites for their high performance and durability in demanding applications, including aircraft components and military equipment. The renewable energy sector also contributes significantly to market growth, with carbon composites utilized in wind turbine blades and solar panel structures. Advances in manufacturing techniques, such as automated fiber placement and resin transfer molding, are further enhancing production efficiency and reducing costs, making carbon composites more accessible across various industries.
Carbon Composites Industry Market Size (In Billion)
Despite the significant growth opportunities, challenges remain. The high cost of raw materials and manufacturing processes can hinder widespread adoption, particularly in price-sensitive sectors. Furthermore, concerns about the environmental impact of carbon fiber production and disposal necessitate the development of sustainable manufacturing and recycling solutions. Nonetheless, ongoing research and development efforts focused on improving material properties, reducing production costs, and enhancing recyclability are expected to mitigate these challenges and further fuel market expansion. The market segmentation, while not fully detailed, likely includes various forms of carbon composites (e.g., carbon fiber reinforced polymers, carbon nanotubes), each with specific applications and market dynamics. Key players like Hexcel Corporation, Toray Industries Inc., and SGL Carbon are actively shaping the market through innovation and expansion, contributing to the overall growth and evolution of the carbon composites industry. The forecast period of 2025-2033 promises continued expansion, driven by technological advancements and sustained demand across multiple industries.
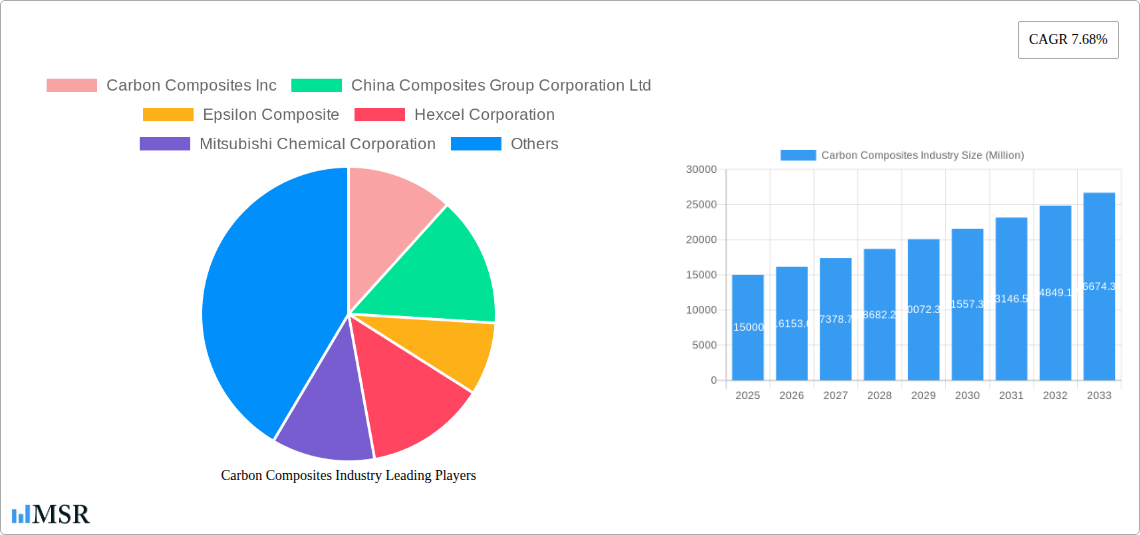
Carbon Composites Industry Company Market Share
Carbon Composites Industry Market Report: 2019-2033
This comprehensive report provides an in-depth analysis of the Carbon Composites Industry, projecting a market value exceeding $XX Million by 2033. The study covers the period 2019-2033, with a base year of 2025 and a forecast period of 2025-2033. Key players like Hexcel Corporation, Toray Industries Inc, Solvay, and SGL Carbon are profiled, alongside an analysis of market dynamics, trends, and future opportunities. This report is essential for investors, industry stakeholders, and strategic decision-makers seeking a thorough understanding of this rapidly evolving sector.
Carbon Composites Industry Market Concentration & Dynamics
The global carbon composites market exhibits a moderately concentrated structure, with several major players holding significant market share. The top ten companies account for approximately xx% of the global market in 2025. Market share dynamics are influenced by factors including technological innovation, M&A activity, and evolving regulatory frameworks. Innovation ecosystems are crucial, with companies investing heavily in R&D to develop advanced materials and manufacturing processes. Stringent environmental regulations are driving the adoption of sustainable manufacturing practices. Substitute materials, such as aluminum and steel, continue to pose competitive pressure, particularly in price-sensitive applications. End-user trends, especially in aerospace and automotive, significantly shape market demand. The historical period (2019-2024) witnessed a considerable number of M&A deals, averaging xx per year, indicating consolidation within the industry. This trend is expected to continue, further shaping the market landscape.
- Market Concentration: Top 10 players hold approximately xx% market share (2025).
- M&A Activity: Average of xx deals per year (2019-2024).
- Key Regulatory Factors: Environmental regulations, safety standards.
- Substitute Products: Aluminum, steel, other composite materials.
- End-User Trends: Growing demand from aerospace, automotive, and renewable energy sectors.
Carbon Composites Industry Industry Insights & Trends
The carbon composites market is experiencing robust growth, driven by several key factors. The market size is estimated at $XX Million in 2025 and is projected to reach $XX Million by 2033, exhibiting a CAGR of xx%. Technological advancements, particularly in the development of high-performance materials and efficient manufacturing processes, are fueling market expansion. The increasing adoption of carbon composites in lightweight applications, coupled with rising demand for fuel-efficient vehicles and aircraft, is a major growth driver. Evolving consumer preferences towards sustainable and high-performance products further contribute to market growth. However, challenges remain, including the high cost of carbon fiber and the complexity of manufacturing processes. The industry is also witnessing increased competition from substitute materials. Despite these challenges, the long-term outlook for the carbon composites market remains positive, driven by continuous innovation and expanding applications.
Key Markets & Segments Leading Carbon Composites Industry
The aerospace segment dominates the carbon composites market, driven by the increasing demand for lightweight and high-strength materials in aircraft manufacturing. The automotive sector also represents a significant market, with the adoption of carbon composites in vehicle bodies and components steadily growing. Geographically, North America and Europe are currently the leading regions, with strong demand from both aerospace and automotive industries. However, the Asia-Pacific region is witnessing rapid growth, fueled by investments in infrastructure development and the expanding automotive and renewable energy sectors.
- Dominant Region: North America, Europe (2025).
- Fastest-Growing Region: Asia-Pacific.
- Key Segments: Aerospace, Automotive, Wind Energy.
- Growth Drivers:
- Aerospace: Demand for fuel-efficient aircraft.
- Automotive: Lightweighting initiatives, increased fuel efficiency standards.
- Wind Energy: Growth of renewable energy sector.
Carbon Composites Industry Product Developments
Recent product innovations focus on enhancing material properties, improving manufacturing processes, and broadening applications. Advancements in fiber technology, such as the development of high-strength, high-modulus carbon fibers, are improving the performance of carbon composite materials. New resin systems are being developed to enhance durability, reduce weight, and improve processing efficiency. The industry is witnessing a growing adoption of additive manufacturing techniques for customized applications. These developments are enabling the use of carbon composites in a wider range of industries, improving performance and cost-effectiveness.
Challenges in the Carbon Composites Industry Market
The carbon composites industry faces several significant challenges. High raw material costs, particularly for carbon fiber, represent a major barrier to market penetration. Supply chain complexities and long lead times can hinder production efficiency. Intense competition from established and emerging players adds pressure on pricing and profitability. Strict environmental regulations related to manufacturing processes also pose challenges. The overall impact of these challenges is a potential constraint on market growth, requiring innovative solutions and strategic adaptation by industry players.
Forces Driving Carbon Composites Industry Growth
Several factors are driving growth in the carbon composites industry. Technological advancements, including the development of advanced materials and manufacturing techniques, enhance the performance and cost-effectiveness of carbon composites. Strong demand from various sectors, such as aerospace, automotive, and renewable energy, is boosting market growth. Government initiatives and policies promoting the use of lightweight materials for fuel efficiency further contribute to market expansion. The growing awareness of sustainability issues is driving the adoption of eco-friendly manufacturing processes and materials, contributing to positive growth.
Long-Term Growth Catalysts in the Carbon Composites Industry
Long-term growth in the carbon composites industry will be driven by continued innovation in materials science and manufacturing processes, leading to more affordable and higher-performance products. Strategic partnerships and collaborations among industry players will accelerate the development and adoption of new technologies and expand market reach. Expansion into new applications and sectors will open up significant opportunities for growth. Government investments in research and development, as well as supportive regulatory frameworks, are essential for long-term industry growth.
Emerging Opportunities in Carbon Composites Industry
Emerging opportunities lie in exploring new applications for carbon composites in high-growth sectors such as electric vehicles, drones, and advanced robotics. The development of sustainable and recycled carbon fiber materials represents a significant opportunity for environmentally conscious companies. 3D printing and additive manufacturing techniques are revolutionizing the manufacturing process, enabling customized and complex designs, thus presenting a great opportunity for market expansion. Focusing on enhancing the lifecycle and recyclability of carbon composites will be a key factor in future growth.
Leading Players in the Carbon Composites Industry Sector
- Carbon Composites Inc
- China Composites Group Corporation Ltd
- Epsilon Composite
- Hexcel Corporation
- Mitsubishi Chemical Corporation
- Nippon Carbon Co Ltd
- Plasan
- Rockman
- SGL Carbon
- Solvay
- Teijin Limited
- Toray Industries Inc
- List Not Exhaustive
Key Milestones in Carbon Composites Industry Industry
- September 2023: Teijin Limited sold its investment in GH Craft Co. Ltd to TIP Composite Co. Ltd, impacting its downstream composites strategy.
- April 2023: Solvay and GKN Aerospace extended their collaboration on thermoplastic composites (TPC) for aircraft structures, signifying a commitment to innovation in this key segment.
Strategic Outlook for Carbon Composites Industry Market
The future of the carbon composites market is bright, with significant growth potential driven by continued innovation, expanding applications, and increasing demand from diverse sectors. Companies focusing on sustainability, cost reduction, and developing advanced manufacturing techniques will be well-positioned to capture market share. Strategic partnerships and collaborations will be key to accelerating innovation and expanding market reach. The long-term outlook suggests a sustained period of growth, making this sector attractive for investment and strategic engagement.
Carbon Composites Industry Segmentation
-
1. Matrix
- 1.1. Hybrid
- 1.2. Metal
- 1.3. Ceramics
- 1.4. Carbon
-
1.5. Polymer
- 1.5.1. Thermosetting
- 1.5.2. Thermoplastic
-
2. Process
- 2.1. Prepeg Layup Process
- 2.2. Pultrusion and Winding
- 2.3. Wet Lamination and Infusion Process
- 2.4. Press and Injection Processes
- 2.5. Other Processes
-
3. Application
- 3.1. Aerospace and Defense
- 3.2. Automotive
- 3.3. Wind Turbines
- 3.4. Sport and Leisure
- 3.5. Civil Engineering
- 3.6. Marine Applications
- 3.7. Other Applications
Carbon Composites Industry Segmentation By Geography
-
1. Asia Pacific
- 1.1. China
- 1.2. India
- 1.3. Japan
- 1.4. South Korea
- 1.5. ASEAN Countries
- 1.6. Rest of Asia Pacific
-
2. North America
- 2.1. United States
- 2.2. Canada
- 2.3. Mexico
-
3. Europe
- 3.1. Germany
- 3.2. United Kingdom
- 3.3. France
- 3.4. Italy
- 3.5. Rest of Europe
-
4. South America
- 4.1. Brazil
- 4.2. Argentina
- 4.3. Rest of South America
-
5. Middle East and Africa
- 5.1. Saudi Arabia
- 5.2. South Africa
- 5.3. Rest of Middle East and Africa
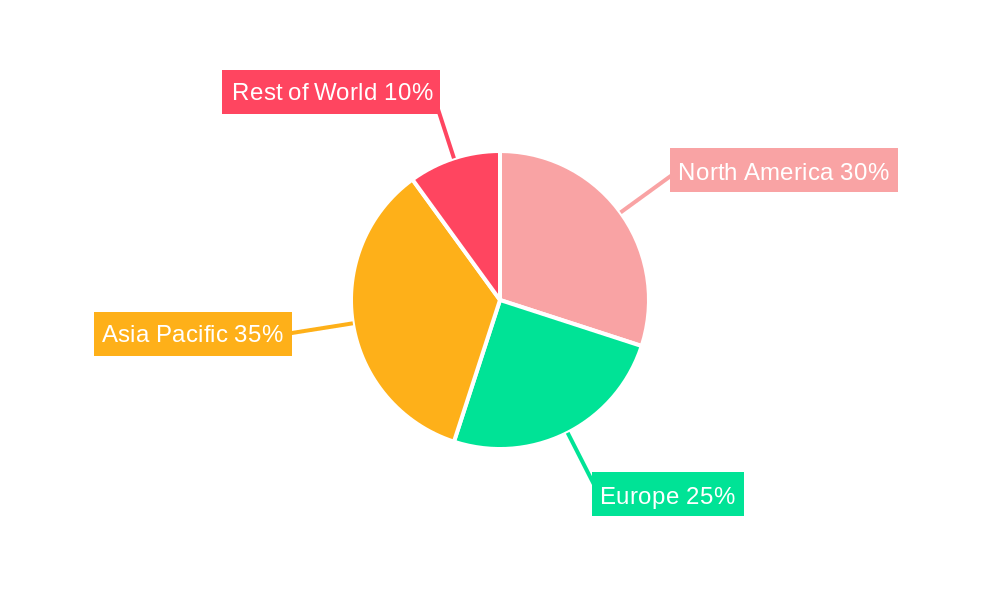
Carbon Composites Industry Regional Market Share
Geographic Coverage of Carbon Composites Industry
Carbon Composites Industry REPORT HIGHLIGHTS
| Aspects | Details |
|---|---|
| Study Period | 2020-2034 |
| Base Year | 2025 |
| Estimated Year | 2026 |
| Forecast Period | 2026-2034 |
| Historical Period | 2020-2025 |
| Growth Rate | CAGR of 7.68% from 2020-2034 |
| Segmentation |
|
Table of Contents
- 1. Introduction
- 1.1. Research Scope
- 1.2. Market Segmentation
- 1.3. Research Objective
- 1.4. Definitions and Assumptions
- 2. Executive Summary
- 2.1. Market Snapshot
- 3. Market Dynamics
- 3.1. Market Drivers
- 3.2. Market Restrains
- 3.3. Market Trends
- 3.4. Market Opportunities
- 4. Market Factor Analysis
- 4.1. Porters Five Forces
- 4.1.1. Bargaining Power of Suppliers
- 4.1.2. Bargaining Power of Buyers
- 4.1.3. Threat of New Entrants
- 4.1.4. Threat of Substitutes
- 4.1.5. Competitive Rivalry
- 4.2. PESTEL analysis
- 4.3. BCG Analysis
- 4.3.1. Stars (High Growth, High Market Share)
- 4.3.2. Cash Cows (Low Growth, High Market Share)
- 4.3.3. Question Mark (High Growth, Low Market Share)
- 4.3.4. Dogs (Low Growth, Low Market Share)
- 4.4. Ansoff Matrix Analysis
- 4.5. Supply Chain Analysis
- 4.6. Regulatory Landscape
- 4.7. Current Market Potential and Opportunity Assessment (TAM–SAM–SOM Framework)
- 4.8. MSR Analyst Note
- 4.1. Porters Five Forces
- 5. Market Analysis, Insights and Forecast 2021-2033
- 5.1. Market Analysis, Insights and Forecast - by Matrix
- 5.1.1. Hybrid
- 5.1.2. Metal
- 5.1.3. Ceramics
- 5.1.4. Carbon
- 5.1.5. Polymer
- 5.1.5.1. Thermosetting
- 5.1.5.2. Thermoplastic
- 5.2. Market Analysis, Insights and Forecast - by Process
- 5.2.1. Prepeg Layup Process
- 5.2.2. Pultrusion and Winding
- 5.2.3. Wet Lamination and Infusion Process
- 5.2.4. Press and Injection Processes
- 5.2.5. Other Processes
- 5.3. Market Analysis, Insights and Forecast - by Application
- 5.3.1. Aerospace and Defense
- 5.3.2. Automotive
- 5.3.3. Wind Turbines
- 5.3.4. Sport and Leisure
- 5.3.5. Civil Engineering
- 5.3.6. Marine Applications
- 5.3.7. Other Applications
- 5.4. Market Analysis, Insights and Forecast - by Region
- 5.4.1. Asia Pacific
- 5.4.2. North America
- 5.4.3. Europe
- 5.4.4. South America
- 5.4.5. Middle East and Africa
- 5.1. Market Analysis, Insights and Forecast - by Matrix
- 6. Global Carbon Composites Industry Analysis, Insights and Forecast, 2021-2033
- 6.1. Market Analysis, Insights and Forecast - by Matrix
- 6.1.1. Hybrid
- 6.1.2. Metal
- 6.1.3. Ceramics
- 6.1.4. Carbon
- 6.1.5. Polymer
- 6.1.5.1. Thermosetting
- 6.1.5.2. Thermoplastic
- 6.2. Market Analysis, Insights and Forecast - by Process
- 6.2.1. Prepeg Layup Process
- 6.2.2. Pultrusion and Winding
- 6.2.3. Wet Lamination and Infusion Process
- 6.2.4. Press and Injection Processes
- 6.2.5. Other Processes
- 6.3. Market Analysis, Insights and Forecast - by Application
- 6.3.1. Aerospace and Defense
- 6.3.2. Automotive
- 6.3.3. Wind Turbines
- 6.3.4. Sport and Leisure
- 6.3.5. Civil Engineering
- 6.3.6. Marine Applications
- 6.3.7. Other Applications
- 6.1. Market Analysis, Insights and Forecast - by Matrix
- 7. Asia Pacific Carbon Composites Industry Analysis, Insights and Forecast, 2020-2032
- 7.1. Market Analysis, Insights and Forecast - by Matrix
- 7.1.1. Hybrid
- 7.1.2. Metal
- 7.1.3. Ceramics
- 7.1.4. Carbon
- 7.1.5. Polymer
- 7.1.5.1. Thermosetting
- 7.1.5.2. Thermoplastic
- 7.2. Market Analysis, Insights and Forecast - by Process
- 7.2.1. Prepeg Layup Process
- 7.2.2. Pultrusion and Winding
- 7.2.3. Wet Lamination and Infusion Process
- 7.2.4. Press and Injection Processes
- 7.2.5. Other Processes
- 7.3. Market Analysis, Insights and Forecast - by Application
- 7.3.1. Aerospace and Defense
- 7.3.2. Automotive
- 7.3.3. Wind Turbines
- 7.3.4. Sport and Leisure
- 7.3.5. Civil Engineering
- 7.3.6. Marine Applications
- 7.3.7. Other Applications
- 7.1. Market Analysis, Insights and Forecast - by Matrix
- 8. North America Carbon Composites Industry Analysis, Insights and Forecast, 2020-2032
- 8.1. Market Analysis, Insights and Forecast - by Matrix
- 8.1.1. Hybrid
- 8.1.2. Metal
- 8.1.3. Ceramics
- 8.1.4. Carbon
- 8.1.5. Polymer
- 8.1.5.1. Thermosetting
- 8.1.5.2. Thermoplastic
- 8.2. Market Analysis, Insights and Forecast - by Process
- 8.2.1. Prepeg Layup Process
- 8.2.2. Pultrusion and Winding
- 8.2.3. Wet Lamination and Infusion Process
- 8.2.4. Press and Injection Processes
- 8.2.5. Other Processes
- 8.3. Market Analysis, Insights and Forecast - by Application
- 8.3.1. Aerospace and Defense
- 8.3.2. Automotive
- 8.3.3. Wind Turbines
- 8.3.4. Sport and Leisure
- 8.3.5. Civil Engineering
- 8.3.6. Marine Applications
- 8.3.7. Other Applications
- 8.1. Market Analysis, Insights and Forecast - by Matrix
- 9. Europe Carbon Composites Industry Analysis, Insights and Forecast, 2020-2032
- 9.1. Market Analysis, Insights and Forecast - by Matrix
- 9.1.1. Hybrid
- 9.1.2. Metal
- 9.1.3. Ceramics
- 9.1.4. Carbon
- 9.1.5. Polymer
- 9.1.5.1. Thermosetting
- 9.1.5.2. Thermoplastic
- 9.2. Market Analysis, Insights and Forecast - by Process
- 9.2.1. Prepeg Layup Process
- 9.2.2. Pultrusion and Winding
- 9.2.3. Wet Lamination and Infusion Process
- 9.2.4. Press and Injection Processes
- 9.2.5. Other Processes
- 9.3. Market Analysis, Insights and Forecast - by Application
- 9.3.1. Aerospace and Defense
- 9.3.2. Automotive
- 9.3.3. Wind Turbines
- 9.3.4. Sport and Leisure
- 9.3.5. Civil Engineering
- 9.3.6. Marine Applications
- 9.3.7. Other Applications
- 9.1. Market Analysis, Insights and Forecast - by Matrix
- 10. South America Carbon Composites Industry Analysis, Insights and Forecast, 2020-2032
- 10.1. Market Analysis, Insights and Forecast - by Matrix
- 10.1.1. Hybrid
- 10.1.2. Metal
- 10.1.3. Ceramics
- 10.1.4. Carbon
- 10.1.5. Polymer
- 10.1.5.1. Thermosetting
- 10.1.5.2. Thermoplastic
- 10.2. Market Analysis, Insights and Forecast - by Process
- 10.2.1. Prepeg Layup Process
- 10.2.2. Pultrusion and Winding
- 10.2.3. Wet Lamination and Infusion Process
- 10.2.4. Press and Injection Processes
- 10.2.5. Other Processes
- 10.3. Market Analysis, Insights and Forecast - by Application
- 10.3.1. Aerospace and Defense
- 10.3.2. Automotive
- 10.3.3. Wind Turbines
- 10.3.4. Sport and Leisure
- 10.3.5. Civil Engineering
- 10.3.6. Marine Applications
- 10.3.7. Other Applications
- 10.1. Market Analysis, Insights and Forecast - by Matrix
- 11. Middle East and Africa Carbon Composites Industry Analysis, Insights and Forecast, 2020-2032
- 11.1. Market Analysis, Insights and Forecast - by Matrix
- 11.1.1. Hybrid
- 11.1.2. Metal
- 11.1.3. Ceramics
- 11.1.4. Carbon
- 11.1.5. Polymer
- 11.1.5.1. Thermosetting
- 11.1.5.2. Thermoplastic
- 11.2. Market Analysis, Insights and Forecast - by Process
- 11.2.1. Prepeg Layup Process
- 11.2.2. Pultrusion and Winding
- 11.2.3. Wet Lamination and Infusion Process
- 11.2.4. Press and Injection Processes
- 11.2.5. Other Processes
- 11.3. Market Analysis, Insights and Forecast - by Application
- 11.3.1. Aerospace and Defense
- 11.3.2. Automotive
- 11.3.3. Wind Turbines
- 11.3.4. Sport and Leisure
- 11.3.5. Civil Engineering
- 11.3.6. Marine Applications
- 11.3.7. Other Applications
- 11.1. Market Analysis, Insights and Forecast - by Matrix
- 12. Competitive Analysis
- 12.1. Company Profiles
- 12.1.1 Carbon Composites Inc
- 12.1.1.1. Company Overview
- 12.1.1.2. Products
- 12.1.1.3. Company Financials
- 12.1.1.4. SWOT Analysis
- 12.1.2 China Composites Group Corporation Ltd
- 12.1.2.1. Company Overview
- 12.1.2.2. Products
- 12.1.2.3. Company Financials
- 12.1.2.4. SWOT Analysis
- 12.1.3 Epsilon Composite
- 12.1.3.1. Company Overview
- 12.1.3.2. Products
- 12.1.3.3. Company Financials
- 12.1.3.4. SWOT Analysis
- 12.1.4 Hexcel Corporation
- 12.1.4.1. Company Overview
- 12.1.4.2. Products
- 12.1.4.3. Company Financials
- 12.1.4.4. SWOT Analysis
- 12.1.5 Mitsubishi Chemical Corporation
- 12.1.5.1. Company Overview
- 12.1.5.2. Products
- 12.1.5.3. Company Financials
- 12.1.5.4. SWOT Analysis
- 12.1.6 Nippon Carbon Co Ltd
- 12.1.6.1. Company Overview
- 12.1.6.2. Products
- 12.1.6.3. Company Financials
- 12.1.6.4. SWOT Analysis
- 12.1.7 Plasan
- 12.1.7.1. Company Overview
- 12.1.7.2. Products
- 12.1.7.3. Company Financials
- 12.1.7.4. SWOT Analysis
- 12.1.8 Rockman
- 12.1.8.1. Company Overview
- 12.1.8.2. Products
- 12.1.8.3. Company Financials
- 12.1.8.4. SWOT Analysis
- 12.1.9 SGL Carbon
- 12.1.9.1. Company Overview
- 12.1.9.2. Products
- 12.1.9.3. Company Financials
- 12.1.9.4. SWOT Analysis
- 12.1.10 Solvay
- 12.1.10.1. Company Overview
- 12.1.10.2. Products
- 12.1.10.3. Company Financials
- 12.1.10.4. SWOT Analysis
- 12.1.11 Teijin Limited
- 12.1.11.1. Company Overview
- 12.1.11.2. Products
- 12.1.11.3. Company Financials
- 12.1.11.4. SWOT Analysis
- 12.1.12 Toray Industries Inc *List Not Exhaustive
- 12.1.12.1. Company Overview
- 12.1.12.2. Products
- 12.1.12.3. Company Financials
- 12.1.12.4. SWOT Analysis
- 12.1.1 Carbon Composites Inc
- 12.2. Market Entropy
- 12.2.1 Company's Key Areas Served
- 12.2.2 Recent Developments
- 12.3. Company Market Share Analysis 2025
- 12.3.1 Top 5 Companies Market Share Analysis
- 12.3.2 Top 3 Companies Market Share Analysis
- 12.4. List of Potential Customers
- 13. Research Methodology
List of Figures
- Figure 1: Global Carbon Composites Industry Revenue Breakdown (Million, %) by Region 2025 & 2033
- Figure 2: Asia Pacific Carbon Composites Industry Revenue (Million), by Matrix 2025 & 2033
- Figure 3: Asia Pacific Carbon Composites Industry Revenue Share (%), by Matrix 2025 & 2033
- Figure 4: Asia Pacific Carbon Composites Industry Revenue (Million), by Process 2025 & 2033
- Figure 5: Asia Pacific Carbon Composites Industry Revenue Share (%), by Process 2025 & 2033
- Figure 6: Asia Pacific Carbon Composites Industry Revenue (Million), by Application 2025 & 2033
- Figure 7: Asia Pacific Carbon Composites Industry Revenue Share (%), by Application 2025 & 2033
- Figure 8: Asia Pacific Carbon Composites Industry Revenue (Million), by Country 2025 & 2033
- Figure 9: Asia Pacific Carbon Composites Industry Revenue Share (%), by Country 2025 & 2033
- Figure 10: North America Carbon Composites Industry Revenue (Million), by Matrix 2025 & 2033
- Figure 11: North America Carbon Composites Industry Revenue Share (%), by Matrix 2025 & 2033
- Figure 12: North America Carbon Composites Industry Revenue (Million), by Process 2025 & 2033
- Figure 13: North America Carbon Composites Industry Revenue Share (%), by Process 2025 & 2033
- Figure 14: North America Carbon Composites Industry Revenue (Million), by Application 2025 & 2033
- Figure 15: North America Carbon Composites Industry Revenue Share (%), by Application 2025 & 2033
- Figure 16: North America Carbon Composites Industry Revenue (Million), by Country 2025 & 2033
- Figure 17: North America Carbon Composites Industry Revenue Share (%), by Country 2025 & 2033
- Figure 18: Europe Carbon Composites Industry Revenue (Million), by Matrix 2025 & 2033
- Figure 19: Europe Carbon Composites Industry Revenue Share (%), by Matrix 2025 & 2033
- Figure 20: Europe Carbon Composites Industry Revenue (Million), by Process 2025 & 2033
- Figure 21: Europe Carbon Composites Industry Revenue Share (%), by Process 2025 & 2033
- Figure 22: Europe Carbon Composites Industry Revenue (Million), by Application 2025 & 2033
- Figure 23: Europe Carbon Composites Industry Revenue Share (%), by Application 2025 & 2033
- Figure 24: Europe Carbon Composites Industry Revenue (Million), by Country 2025 & 2033
- Figure 25: Europe Carbon Composites Industry Revenue Share (%), by Country 2025 & 2033
- Figure 26: South America Carbon Composites Industry Revenue (Million), by Matrix 2025 & 2033
- Figure 27: South America Carbon Composites Industry Revenue Share (%), by Matrix 2025 & 2033
- Figure 28: South America Carbon Composites Industry Revenue (Million), by Process 2025 & 2033
- Figure 29: South America Carbon Composites Industry Revenue Share (%), by Process 2025 & 2033
- Figure 30: South America Carbon Composites Industry Revenue (Million), by Application 2025 & 2033
- Figure 31: South America Carbon Composites Industry Revenue Share (%), by Application 2025 & 2033
- Figure 32: South America Carbon Composites Industry Revenue (Million), by Country 2025 & 2033
- Figure 33: South America Carbon Composites Industry Revenue Share (%), by Country 2025 & 2033
- Figure 34: Middle East and Africa Carbon Composites Industry Revenue (Million), by Matrix 2025 & 2033
- Figure 35: Middle East and Africa Carbon Composites Industry Revenue Share (%), by Matrix 2025 & 2033
- Figure 36: Middle East and Africa Carbon Composites Industry Revenue (Million), by Process 2025 & 2033
- Figure 37: Middle East and Africa Carbon Composites Industry Revenue Share (%), by Process 2025 & 2033
- Figure 38: Middle East and Africa Carbon Composites Industry Revenue (Million), by Application 2025 & 2033
- Figure 39: Middle East and Africa Carbon Composites Industry Revenue Share (%), by Application 2025 & 2033
- Figure 40: Middle East and Africa Carbon Composites Industry Revenue (Million), by Country 2025 & 2033
- Figure 41: Middle East and Africa Carbon Composites Industry Revenue Share (%), by Country 2025 & 2033
List of Tables
- Table 1: Global Carbon Composites Industry Revenue Million Forecast, by Matrix 2020 & 2033
- Table 2: Global Carbon Composites Industry Revenue Million Forecast, by Process 2020 & 2033
- Table 3: Global Carbon Composites Industry Revenue Million Forecast, by Application 2020 & 2033
- Table 4: Global Carbon Composites Industry Revenue Million Forecast, by Region 2020 & 2033
- Table 5: Global Carbon Composites Industry Revenue Million Forecast, by Matrix 2020 & 2033
- Table 6: Global Carbon Composites Industry Revenue Million Forecast, by Process 2020 & 2033
- Table 7: Global Carbon Composites Industry Revenue Million Forecast, by Application 2020 & 2033
- Table 8: Global Carbon Composites Industry Revenue Million Forecast, by Country 2020 & 2033
- Table 9: China Carbon Composites Industry Revenue (Million) Forecast, by Application 2020 & 2033
- Table 10: India Carbon Composites Industry Revenue (Million) Forecast, by Application 2020 & 2033
- Table 11: Japan Carbon Composites Industry Revenue (Million) Forecast, by Application 2020 & 2033
- Table 12: South Korea Carbon Composites Industry Revenue (Million) Forecast, by Application 2020 & 2033
- Table 13: ASEAN Countries Carbon Composites Industry Revenue (Million) Forecast, by Application 2020 & 2033
- Table 14: Rest of Asia Pacific Carbon Composites Industry Revenue (Million) Forecast, by Application 2020 & 2033
- Table 15: Global Carbon Composites Industry Revenue Million Forecast, by Matrix 2020 & 2033
- Table 16: Global Carbon Composites Industry Revenue Million Forecast, by Process 2020 & 2033
- Table 17: Global Carbon Composites Industry Revenue Million Forecast, by Application 2020 & 2033
- Table 18: Global Carbon Composites Industry Revenue Million Forecast, by Country 2020 & 2033
- Table 19: United States Carbon Composites Industry Revenue (Million) Forecast, by Application 2020 & 2033
- Table 20: Canada Carbon Composites Industry Revenue (Million) Forecast, by Application 2020 & 2033
- Table 21: Mexico Carbon Composites Industry Revenue (Million) Forecast, by Application 2020 & 2033
- Table 22: Global Carbon Composites Industry Revenue Million Forecast, by Matrix 2020 & 2033
- Table 23: Global Carbon Composites Industry Revenue Million Forecast, by Process 2020 & 2033
- Table 24: Global Carbon Composites Industry Revenue Million Forecast, by Application 2020 & 2033
- Table 25: Global Carbon Composites Industry Revenue Million Forecast, by Country 2020 & 2033
- Table 26: Germany Carbon Composites Industry Revenue (Million) Forecast, by Application 2020 & 2033
- Table 27: United Kingdom Carbon Composites Industry Revenue (Million) Forecast, by Application 2020 & 2033
- Table 28: France Carbon Composites Industry Revenue (Million) Forecast, by Application 2020 & 2033
- Table 29: Italy Carbon Composites Industry Revenue (Million) Forecast, by Application 2020 & 2033
- Table 30: Rest of Europe Carbon Composites Industry Revenue (Million) Forecast, by Application 2020 & 2033
- Table 31: Global Carbon Composites Industry Revenue Million Forecast, by Matrix 2020 & 2033
- Table 32: Global Carbon Composites Industry Revenue Million Forecast, by Process 2020 & 2033
- Table 33: Global Carbon Composites Industry Revenue Million Forecast, by Application 2020 & 2033
- Table 34: Global Carbon Composites Industry Revenue Million Forecast, by Country 2020 & 2033
- Table 35: Brazil Carbon Composites Industry Revenue (Million) Forecast, by Application 2020 & 2033
- Table 36: Argentina Carbon Composites Industry Revenue (Million) Forecast, by Application 2020 & 2033
- Table 37: Rest of South America Carbon Composites Industry Revenue (Million) Forecast, by Application 2020 & 2033
- Table 38: Global Carbon Composites Industry Revenue Million Forecast, by Matrix 2020 & 2033
- Table 39: Global Carbon Composites Industry Revenue Million Forecast, by Process 2020 & 2033
- Table 40: Global Carbon Composites Industry Revenue Million Forecast, by Application 2020 & 2033
- Table 41: Global Carbon Composites Industry Revenue Million Forecast, by Country 2020 & 2033
- Table 42: Saudi Arabia Carbon Composites Industry Revenue (Million) Forecast, by Application 2020 & 2033
- Table 43: South Africa Carbon Composites Industry Revenue (Million) Forecast, by Application 2020 & 2033
- Table 44: Rest of Middle East and Africa Carbon Composites Industry Revenue (Million) Forecast, by Application 2020 & 2033
Frequently Asked Questions
1. What is the projected Compound Annual Growth Rate (CAGR) of the Carbon Composites Industry?
The projected CAGR is approximately 7.68%.
2. Which companies are prominent players in the Carbon Composites Industry?
Key companies in the market include Carbon Composites Inc, China Composites Group Corporation Ltd, Epsilon Composite, Hexcel Corporation, Mitsubishi Chemical Corporation, Nippon Carbon Co Ltd, Plasan, Rockman, SGL Carbon, Solvay, Teijin Limited, Toray Industries Inc *List Not Exhaustive.
3. What are the main segments of the Carbon Composites Industry?
The market segments include Matrix, Process, Application.
4. Can you provide details about the market size?
The market size is estimated to be USD XX Million as of 2022.
5. What are some drivers contributing to market growth?
Increasing Demand from the Aerospace and Defense Industry; Increasing Demand from the Wind Energy Sector.
6. What are the notable trends driving market growth?
Aerospace and defense applications to dominate the market.
7. Are there any restraints impacting market growth?
Increasing Demand from the Aerospace and Defense Industry; Increasing Demand from the Wind Energy Sector.
8. Can you provide examples of recent developments in the market?
September 2023: Teijin Limited agreed to sell its entire investment in GH Craft Co. Ltd, an equity-method subsidiary of Teijin's composites business in Japan, to TIP Composite Co. Ltd (Tokyo). Teijin acquired GH Craft as part of its downstream strategy in July 2008.
9. What pricing options are available for accessing the report?
Pricing options include single-user, multi-user, and enterprise licenses priced at USD 4750, USD 5250, and USD 8750 respectively.
10. Is the market size provided in terms of value or volume?
The market size is provided in terms of value, measured in Million.
11. Are there any specific market keywords associated with the report?
Yes, the market keyword associated with the report is "Carbon Composites Industry," which aids in identifying and referencing the specific market segment covered.
12. How do I determine which pricing option suits my needs best?
The pricing options vary based on user requirements and access needs. Individual users may opt for single-user licenses, while businesses requiring broader access may choose multi-user or enterprise licenses for cost-effective access to the report.
13. Are there any additional resources or data provided in the Carbon Composites Industry report?
While the report offers comprehensive insights, it's advisable to review the specific contents or supplementary materials provided to ascertain if additional resources or data are available.
14. How can I stay updated on further developments or reports in the Carbon Composites Industry?
To stay informed about further developments, trends, and reports in the Carbon Composites Industry, consider subscribing to industry newsletters, following relevant companies and organizations, or regularly checking reputable industry news sources and publications.
Methodology
Step 1 - Identification of Relevant Samples Size from Population Database


Step 2 - Approaches for Defining Global Market Size (Value, Volume* & Price*)

Note*: In applicable scenarios
Step 3 - Data Sources
Primary Research
- Web Analytics
- Survey Reports
- Research Institute
- Latest Research Reports
- Opinion Leaders
Secondary Research
- Annual Reports
- White Paper
- Latest Press Release
- Industry Association
- Paid Database
- Investor Presentations

Step 4 - Data Triangulation
Involves using different sources of information in order to increase the validity of a study
These sources are likely to be stakeholders in a program - participants, other researchers, program staff, other community members, and so on.
Then we put all data in single framework & apply various statistical tools to find out the dynamic on the market.
During the analysis stage, feedback from the stakeholder groups would be compared to determine areas of agreement as well as areas of divergence