

Key Insights
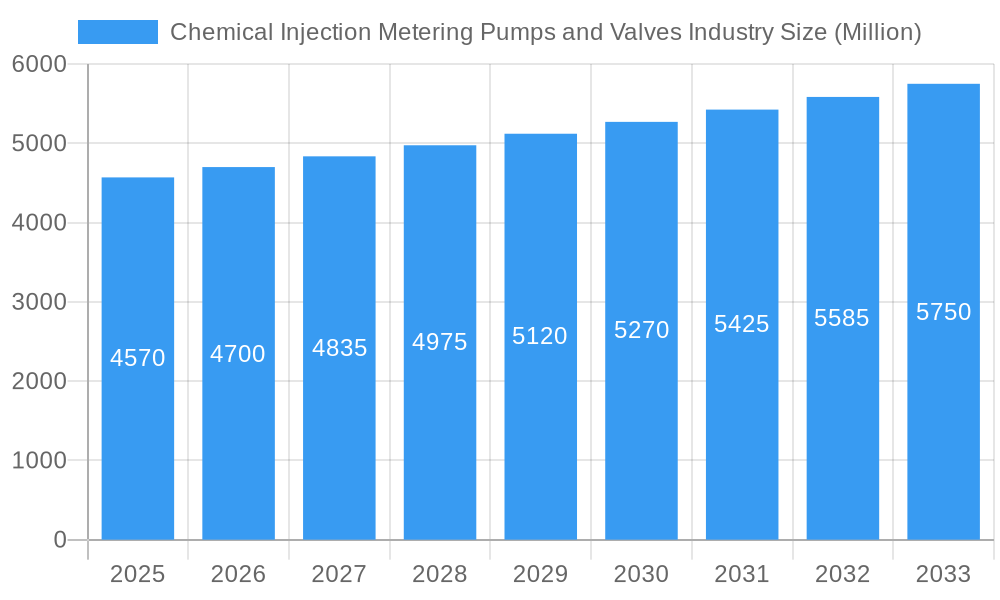
The Chemical Injection Metering Pumps and Valves market is experiencing steady growth, projected to reach a value of $4.57 billion in 2025 and maintain a Compound Annual Growth Rate (CAGR) of 2.79% from 2025 to 2033. This growth is driven by increasing demand across various industries, including oil and gas, water treatment, and chemical processing. Automation in industrial processes, coupled with stricter environmental regulations demanding precise chemical injection, are key factors fueling market expansion. Furthermore, advancements in pump technology, such as the development of more efficient and durable materials, contribute to market growth. The market is segmented by pump type (e.g., positive displacement, diaphragm, peristaltic), valve type (e.g., ball valves, butterfly valves, control valves), and end-use industry. Competitive landscape analysis reveals a mix of established players like Schlumberger (Cameron), Hunting PLC, and SPX FLOW, alongside specialized manufacturers like Lewa GmbH and Seepex GmbH. The market's expansion is expected to continue, driven by ongoing industrialization and the need for precise chemical handling across various sectors.
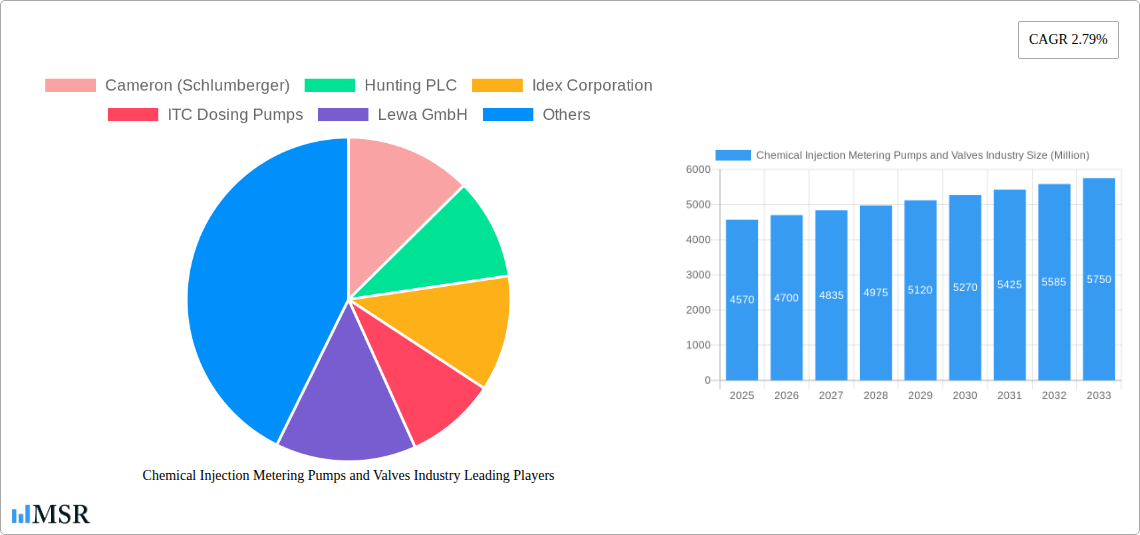
Chemical Injection Metering Pumps and Valves Industry Market Size (In Billion)
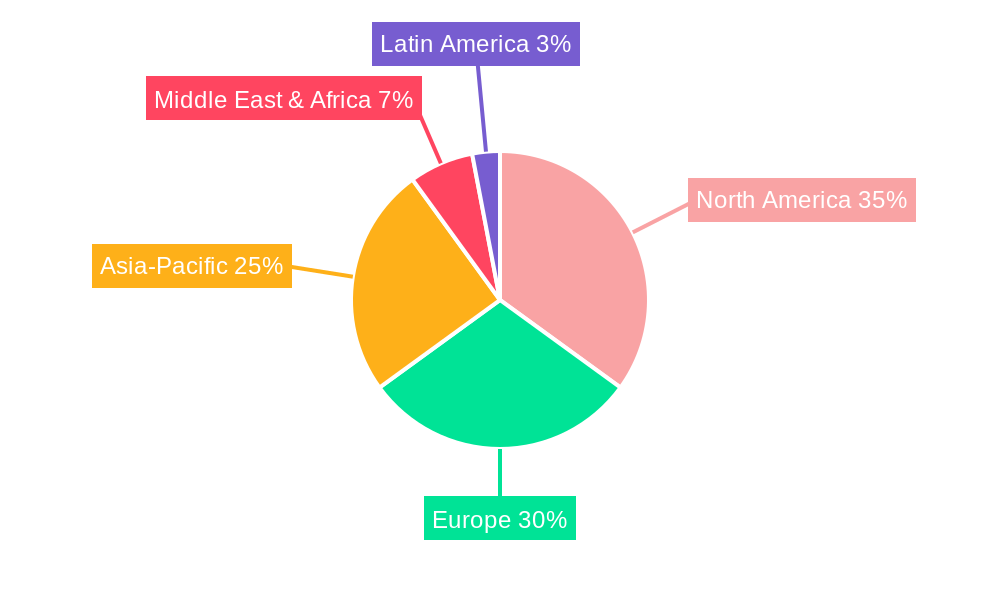
The historical period (2019-2024) exhibited moderate growth, laying the foundation for the projected expansion. While specific regional data is unavailable, it’s reasonable to assume that North America and Europe constitute significant market shares, given the concentration of industrial activity and technological advancements in these regions. However, emerging economies in Asia-Pacific and the Middle East are poised for significant growth, driven by infrastructure development and industrialization. Continued innovation in pump and valve design, focusing on improved accuracy, reliability, and energy efficiency, will shape the market's future trajectory. The industry faces challenges related to raw material costs and potential supply chain disruptions; however, ongoing technological development and increased demand are expected to mitigate these challenges.
Chemical Injection Metering Pumps and Valves Industry Company Market Share
Chemical Injection Metering Pumps and Valves Industry: A Comprehensive Market Report (2019-2033)
This comprehensive report provides a detailed analysis of the global Chemical Injection Metering Pumps and Valves industry, offering actionable insights for stakeholders across the value chain. The study period covers 2019-2033, with 2025 as the base and estimated year, and a forecast period of 2025-2033. The report leverages extensive primary and secondary research to deliver a nuanced understanding of market dynamics, key players, and future growth trajectories. The market is projected to reach $XX Million by 2033, exhibiting a CAGR of XX% during the forecast period.
Chemical Injection Metering Pumps and Valves Industry Market Concentration & Dynamics
The Chemical Injection Metering Pumps and Valves industry exhibits a moderately concentrated market structure, with several major players holding significant market share. Cameron (Schlumberger), Hunting PLC, Idex Corporation, and SPX FLOW Inc. are among the leading companies, collectively accounting for an estimated XX% of the global market in 2025. The market is characterized by a dynamic innovation ecosystem, with companies continuously investing in R&D to develop advanced metering technologies and improve efficiency. Stringent regulatory frameworks, particularly concerning environmental protection and safety, significantly influence industry practices. Substitute products, such as alternative chemical delivery systems, pose a moderate competitive threat. End-user trends towards automation and digitalization are driving demand for sophisticated metering solutions. Mergers and acquisitions (M&A) activity has been moderate in recent years, with approximately XX M&A deals recorded between 2019 and 2024. This activity is expected to increase as companies seek to expand their market reach and consolidate their positions.
- Market Share: Leading players hold approximately XX% of the market share.
- M&A Activity: Approximately XX M&A deals were recorded between 2019 and 2024.
- Regulatory Landscape: Stringent environmental regulations drive innovation and market shifts.
- Innovation Ecosystem: Continuous development of advanced metering technologies.
Chemical Injection Metering Pumps and Valves Industry Industry Insights & Trends
The global Chemical Injection Metering Pumps and Valves market is experiencing robust growth, driven by several key factors. Increasing demand from the oil & gas, water treatment, and chemical processing industries is a primary growth catalyst. The market size reached $XX Million in 2024 and is projected to reach $XX Million by 2033. Technological advancements, such as the adoption of smart metering systems and improved materials for enhanced durability and corrosion resistance, are further fueling market expansion. Evolving consumer behavior, particularly a greater focus on operational efficiency and reduced environmental impact, is driving demand for energy-efficient and sustainable metering solutions. The increasing adoption of precision chemical injection in various applications is also a significant growth driver. Furthermore, governmental initiatives promoting sustainable industrial practices are encouraging market growth. This growth is expected to continue throughout the forecast period, driven by technological advancements and expanding applications.
Key Markets & Segments Leading Chemical Injection Metering Pumps and Valves Industry
The oil and gas industry represents the largest segment in the Chemical Injection Metering Pumps and Valves market, accounting for approximately XX% of the global market in 2025. This dominance stems from the critical role of precise chemical injection in various oil and gas operations such as enhanced oil recovery (EOR), pipeline protection, and water treatment. North America and Europe are currently the leading regions, driven by robust industrial activity and stringent environmental regulations.
Drivers for Dominant Regions:
- North America: Strong Oil & Gas sector, robust industrial infrastructure, and stringent environmental regulations.
- Europe: High adoption of advanced technologies, focus on sustainable industrial practices, and well-established chemical processing sector.
- Asia Pacific: Rapid industrialization, growing demand from the oil & gas and water treatment sectors.
Chemical Injection Metering Pumps and Valves Industry Product Developments
Recent product innovations focus on enhancing accuracy, reliability, and efficiency. Manufacturers are developing smart metering pumps with advanced control systems and integrated diagnostics. The integration of IoT capabilities allows for real-time monitoring and predictive maintenance, improving operational efficiency and minimizing downtime. New materials are being employed to enhance durability and corrosion resistance, extending the lifespan of pumps and valves in harsh operating conditions. These advancements provide significant competitive advantages, enhancing product value propositions.
Challenges in the Chemical Injection Metering Pumps and Valves Industry Market
The industry faces several challenges, including fluctuating raw material prices, which impact production costs. Supply chain disruptions can lead to delays and increased costs. Intense competition from both established players and new entrants puts pressure on profit margins. Stringent regulatory compliance requirements necessitate significant investments in meeting safety and environmental standards. These factors collectively impact market growth and profitability.
Forces Driving Chemical Injection Metering Pumps and Valves Industry Growth
Several factors are driving market growth. Increasing demand from diverse end-user industries, particularly oil & gas, water treatment, and chemical processing, is a major catalyst. Technological advancements, including the adoption of smart metering and improved materials, enhance efficiency and reliability. Government regulations promoting sustainable practices further stimulate market expansion. The rising need for precise chemical injection in various industrial processes fuels demand for advanced solutions.
Long-Term Growth Catalysts in the Chemical Injection Metering Pumps and Valves Industry
Long-term growth will be driven by continuous technological innovation, resulting in more efficient and sustainable products. Strategic partnerships and collaborations will accelerate product development and market expansion. Growing demand from emerging economies will open new market opportunities. Focus on digitalization and data analytics will lead to better process optimization and enhanced customer value.
Emerging Opportunities in Chemical Injection Metering Pumps and Valves Industry
Emerging opportunities exist in the development of environmentally friendly materials and processes. The integration of advanced analytics and AI for predictive maintenance holds significant potential. Expanding into new markets, particularly in developing economies, will provide significant growth avenues. The increasing demand for customized solutions catering to specific industry requirements presents lucrative opportunities.
Leading Players in the Chemical Injection Metering Pumps and Valves Industry Sector
- Cameron (Schlumberger)
- Hunting PLC
- Idex Corporation
- ITC Dosing Pumps
- Lewa GmbH
- McFarland-Tritan LLC
- Milton Roy
- ProMinent
- Seepex GmbH
- Seko SpA
- SkoFlo Industries Inc
- SPX FLOW Inc
- Swelore Engineering Pvt Ltd
- List Not Exhaustive
Key Milestones in Chemical Injection Metering Pumps and Valves Industry Industry
- 2020: Introduction of a new generation of smart metering pumps by Idex Corporation.
- 2021: Strategic partnership between Lewa GmbH and a major chemical producer for customized solutions.
- 2022: Acquisition of a smaller metering pump manufacturer by SPX FLOW Inc.
- 2023: Launch of a new line of energy-efficient pumps by ProMinent.
- 2024: Significant increase in demand due to a surge in the Oil & Gas Industry
Strategic Outlook for Chemical Injection Metering Pumps and Valves Industry Market
The Chemical Injection Metering Pumps and Valves market holds significant future potential, fueled by continuous technological advancements and the growing demand from diverse industries. Strategic opportunities exist in developing innovative solutions that cater to the evolving needs of end-users. Focus on sustainability, digitalization, and service offerings will be key to achieving long-term growth and profitability. Companies that can effectively adapt to changing market dynamics and invest in R&D will be well-positioned to capture significant market share.
Chemical Injection Metering Pumps and Valves Industry Segmentation
-
1. Pump Type
- 1.1. Diaphragm
- 1.2. Piston/Plunger
- 1.3. Other Pump Types
-
2. End-user Industry
- 2.1. Energy, Power, and Chemicals
- 2.2. Oil and Gas
- 2.3. Water and Wastewater Treatment
- 2.4. Food and Beverage
- 2.5. Pharmaceutical
Chemical Injection Metering Pumps and Valves Industry Segmentation By Geography
-
1. Asia Pacific
- 1.1. China
- 1.2. India
- 1.3. Japan
- 1.4. South Korea
- 1.5. ASEAN Countries
- 1.6. Australia and New Zealand
- 1.7. Rest of Asia Pacific
-
2. North America
- 2.1. United States
- 2.2. Canada
- 2.3. Mexico
-
3. Europe
- 3.1. Germany
- 3.2. United Kingdom
- 3.3. Italy
- 3.4. France
- 3.5. Russia
- 3.6. Spain
- 3.7. Rest of Europe
-
4. South America
- 4.1. Brazil
- 4.2. Argentina
- 4.3. Rest of South America
-
5. Middle East and Africa
- 5.1. Saudi Arabia
- 5.2. South Africa
- 5.3. Rest of Middle East and Africa
Chemical Injection Metering Pumps and Valves Industry Regional Market Share
Geographic Coverage of Chemical Injection Metering Pumps and Valves Industry
Chemical Injection Metering Pumps and Valves Industry REPORT HIGHLIGHTS
| Aspects | Details |
|---|---|
| Study Period | 2020-2034 |
| Base Year | 2025 |
| Estimated Year | 2026 |
| Forecast Period | 2026-2034 |
| Historical Period | 2020-2025 |
| Growth Rate | CAGR of 2.79% from 2020-2034 |
| Segmentation |
|
Table of Contents
- 1. Introduction
- 1.1. Research Scope
- 1.2. Market Segmentation
- 1.3. Research Objective
- 1.4. Definitions and Assumptions
- 2. Executive Summary
- 2.1. Market Snapshot
- 3. Market Dynamics
- 3.1. Market Drivers
- 3.2. Market Restrains
- 3.3. Market Trends
- 3.4. Market Opportunities
- 4. Market Factor Analysis
- 4.1. Porters Five Forces
- 4.1.1. Bargaining Power of Suppliers
- 4.1.2. Bargaining Power of Buyers
- 4.1.3. Threat of New Entrants
- 4.1.4. Threat of Substitutes
- 4.1.5. Competitive Rivalry
- 4.2. PESTEL analysis
- 4.3. BCG Analysis
- 4.3.1. Stars (High Growth, High Market Share)
- 4.3.2. Cash Cows (Low Growth, High Market Share)
- 4.3.3. Question Mark (High Growth, Low Market Share)
- 4.3.4. Dogs (Low Growth, Low Market Share)
- 4.4. Ansoff Matrix Analysis
- 4.5. Supply Chain Analysis
- 4.6. Regulatory Landscape
- 4.7. Current Market Potential and Opportunity Assessment (TAM–SAM–SOM Framework)
- 4.8. MSR Analyst Note
- 4.1. Porters Five Forces
- 5. Market Analysis, Insights and Forecast 2021-2033
- 5.1. Market Analysis, Insights and Forecast - by Pump Type
- 5.1.1. Diaphragm
- 5.1.2. Piston/Plunger
- 5.1.3. Other Pump Types
- 5.2. Market Analysis, Insights and Forecast - by End-user Industry
- 5.2.1. Energy, Power, and Chemicals
- 5.2.2. Oil and Gas
- 5.2.3. Water and Wastewater Treatment
- 5.2.4. Food and Beverage
- 5.2.5. Pharmaceutical
- 5.3. Market Analysis, Insights and Forecast - by Region
- 5.3.1. Asia Pacific
- 5.3.2. North America
- 5.3.3. Europe
- 5.3.4. South America
- 5.3.5. Middle East and Africa
- 5.1. Market Analysis, Insights and Forecast - by Pump Type
- 6. Global Chemical Injection Metering Pumps and Valves Industry Analysis, Insights and Forecast, 2021-2033
- 6.1. Market Analysis, Insights and Forecast - by Pump Type
- 6.1.1. Diaphragm
- 6.1.2. Piston/Plunger
- 6.1.3. Other Pump Types
- 6.2. Market Analysis, Insights and Forecast - by End-user Industry
- 6.2.1. Energy, Power, and Chemicals
- 6.2.2. Oil and Gas
- 6.2.3. Water and Wastewater Treatment
- 6.2.4. Food and Beverage
- 6.2.5. Pharmaceutical
- 6.1. Market Analysis, Insights and Forecast - by Pump Type
- 7. Asia Pacific Chemical Injection Metering Pumps and Valves Industry Analysis, Insights and Forecast, 2020-2032
- 7.1. Market Analysis, Insights and Forecast - by Pump Type
- 7.1.1. Diaphragm
- 7.1.2. Piston/Plunger
- 7.1.3. Other Pump Types
- 7.2. Market Analysis, Insights and Forecast - by End-user Industry
- 7.2.1. Energy, Power, and Chemicals
- 7.2.2. Oil and Gas
- 7.2.3. Water and Wastewater Treatment
- 7.2.4. Food and Beverage
- 7.2.5. Pharmaceutical
- 7.1. Market Analysis, Insights and Forecast - by Pump Type
- 8. North America Chemical Injection Metering Pumps and Valves Industry Analysis, Insights and Forecast, 2020-2032
- 8.1. Market Analysis, Insights and Forecast - by Pump Type
- 8.1.1. Diaphragm
- 8.1.2. Piston/Plunger
- 8.1.3. Other Pump Types
- 8.2. Market Analysis, Insights and Forecast - by End-user Industry
- 8.2.1. Energy, Power, and Chemicals
- 8.2.2. Oil and Gas
- 8.2.3. Water and Wastewater Treatment
- 8.2.4. Food and Beverage
- 8.2.5. Pharmaceutical
- 8.1. Market Analysis, Insights and Forecast - by Pump Type
- 9. Europe Chemical Injection Metering Pumps and Valves Industry Analysis, Insights and Forecast, 2020-2032
- 9.1. Market Analysis, Insights and Forecast - by Pump Type
- 9.1.1. Diaphragm
- 9.1.2. Piston/Plunger
- 9.1.3. Other Pump Types
- 9.2. Market Analysis, Insights and Forecast - by End-user Industry
- 9.2.1. Energy, Power, and Chemicals
- 9.2.2. Oil and Gas
- 9.2.3. Water and Wastewater Treatment
- 9.2.4. Food and Beverage
- 9.2.5. Pharmaceutical
- 9.1. Market Analysis, Insights and Forecast - by Pump Type
- 10. South America Chemical Injection Metering Pumps and Valves Industry Analysis, Insights and Forecast, 2020-2032
- 10.1. Market Analysis, Insights and Forecast - by Pump Type
- 10.1.1. Diaphragm
- 10.1.2. Piston/Plunger
- 10.1.3. Other Pump Types
- 10.2. Market Analysis, Insights and Forecast - by End-user Industry
- 10.2.1. Energy, Power, and Chemicals
- 10.2.2. Oil and Gas
- 10.2.3. Water and Wastewater Treatment
- 10.2.4. Food and Beverage
- 10.2.5. Pharmaceutical
- 10.1. Market Analysis, Insights and Forecast - by Pump Type
- 11. Middle East and Africa Chemical Injection Metering Pumps and Valves Industry Analysis, Insights and Forecast, 2020-2032
- 11.1. Market Analysis, Insights and Forecast - by Pump Type
- 11.1.1. Diaphragm
- 11.1.2. Piston/Plunger
- 11.1.3. Other Pump Types
- 11.2. Market Analysis, Insights and Forecast - by End-user Industry
- 11.2.1. Energy, Power, and Chemicals
- 11.2.2. Oil and Gas
- 11.2.3. Water and Wastewater Treatment
- 11.2.4. Food and Beverage
- 11.2.5. Pharmaceutical
- 11.1. Market Analysis, Insights and Forecast - by Pump Type
- 12. Competitive Analysis
- 12.1. Company Profiles
- 12.1.1 Cameron (Schlumberger)
- 12.1.1.1. Company Overview
- 12.1.1.2. Products
- 12.1.1.3. Company Financials
- 12.1.1.4. SWOT Analysis
- 12.1.2 Hunting PLC
- 12.1.2.1. Company Overview
- 12.1.2.2. Products
- 12.1.2.3. Company Financials
- 12.1.2.4. SWOT Analysis
- 12.1.3 Idex Corporation
- 12.1.3.1. Company Overview
- 12.1.3.2. Products
- 12.1.3.3. Company Financials
- 12.1.3.4. SWOT Analysis
- 12.1.4 ITC Dosing Pumps
- 12.1.4.1. Company Overview
- 12.1.4.2. Products
- 12.1.4.3. Company Financials
- 12.1.4.4. SWOT Analysis
- 12.1.5 Lewa GmbH
- 12.1.5.1. Company Overview
- 12.1.5.2. Products
- 12.1.5.3. Company Financials
- 12.1.5.4. SWOT Analysis
- 12.1.6 McFarland-Tritan LLC
- 12.1.6.1. Company Overview
- 12.1.6.2. Products
- 12.1.6.3. Company Financials
- 12.1.6.4. SWOT Analysis
- 12.1.7 Milton Roy
- 12.1.7.1. Company Overview
- 12.1.7.2. Products
- 12.1.7.3. Company Financials
- 12.1.7.4. SWOT Analysis
- 12.1.8 ProMinent
- 12.1.8.1. Company Overview
- 12.1.8.2. Products
- 12.1.8.3. Company Financials
- 12.1.8.4. SWOT Analysis
- 12.1.9 Seepex GmbH
- 12.1.9.1. Company Overview
- 12.1.9.2. Products
- 12.1.9.3. Company Financials
- 12.1.9.4. SWOT Analysis
- 12.1.10 Seko SpA
- 12.1.10.1. Company Overview
- 12.1.10.2. Products
- 12.1.10.3. Company Financials
- 12.1.10.4. SWOT Analysis
- 12.1.11 SkoFlo Industries Inc
- 12.1.11.1. Company Overview
- 12.1.11.2. Products
- 12.1.11.3. Company Financials
- 12.1.11.4. SWOT Analysis
- 12.1.12 SPX FLOW Inc
- 12.1.12.1. Company Overview
- 12.1.12.2. Products
- 12.1.12.3. Company Financials
- 12.1.12.4. SWOT Analysis
- 12.1.13 Swelore Engineering Pvt Ltd *List Not Exhaustive
- 12.1.13.1. Company Overview
- 12.1.13.2. Products
- 12.1.13.3. Company Financials
- 12.1.13.4. SWOT Analysis
- 12.1.1 Cameron (Schlumberger)
- 12.2. Market Entropy
- 12.2.1 Company's Key Areas Served
- 12.2.2 Recent Developments
- 12.3. Company Market Share Analysis 2025
- 12.3.1 Top 5 Companies Market Share Analysis
- 12.3.2 Top 3 Companies Market Share Analysis
- 12.4. List of Potential Customers
- 13. Research Methodology
List of Figures
- Figure 1: Global Chemical Injection Metering Pumps and Valves Industry Revenue Breakdown (Million, %) by Region 2025 & 2033
- Figure 2: Global Chemical Injection Metering Pumps and Valves Industry Volume Breakdown (Billion, %) by Region 2025 & 2033
- Figure 3: Asia Pacific Chemical Injection Metering Pumps and Valves Industry Revenue (Million), by Pump Type 2025 & 2033
- Figure 4: Asia Pacific Chemical Injection Metering Pumps and Valves Industry Volume (Billion), by Pump Type 2025 & 2033
- Figure 5: Asia Pacific Chemical Injection Metering Pumps and Valves Industry Revenue Share (%), by Pump Type 2025 & 2033
- Figure 6: Asia Pacific Chemical Injection Metering Pumps and Valves Industry Volume Share (%), by Pump Type 2025 & 2033
- Figure 7: Asia Pacific Chemical Injection Metering Pumps and Valves Industry Revenue (Million), by End-user Industry 2025 & 2033
- Figure 8: Asia Pacific Chemical Injection Metering Pumps and Valves Industry Volume (Billion), by End-user Industry 2025 & 2033
- Figure 9: Asia Pacific Chemical Injection Metering Pumps and Valves Industry Revenue Share (%), by End-user Industry 2025 & 2033
- Figure 10: Asia Pacific Chemical Injection Metering Pumps and Valves Industry Volume Share (%), by End-user Industry 2025 & 2033
- Figure 11: Asia Pacific Chemical Injection Metering Pumps and Valves Industry Revenue (Million), by Country 2025 & 2033
- Figure 12: Asia Pacific Chemical Injection Metering Pumps and Valves Industry Volume (Billion), by Country 2025 & 2033
- Figure 13: Asia Pacific Chemical Injection Metering Pumps and Valves Industry Revenue Share (%), by Country 2025 & 2033
- Figure 14: Asia Pacific Chemical Injection Metering Pumps and Valves Industry Volume Share (%), by Country 2025 & 2033
- Figure 15: North America Chemical Injection Metering Pumps and Valves Industry Revenue (Million), by Pump Type 2025 & 2033
- Figure 16: North America Chemical Injection Metering Pumps and Valves Industry Volume (Billion), by Pump Type 2025 & 2033
- Figure 17: North America Chemical Injection Metering Pumps and Valves Industry Revenue Share (%), by Pump Type 2025 & 2033
- Figure 18: North America Chemical Injection Metering Pumps and Valves Industry Volume Share (%), by Pump Type 2025 & 2033
- Figure 19: North America Chemical Injection Metering Pumps and Valves Industry Revenue (Million), by End-user Industry 2025 & 2033
- Figure 20: North America Chemical Injection Metering Pumps and Valves Industry Volume (Billion), by End-user Industry 2025 & 2033
- Figure 21: North America Chemical Injection Metering Pumps and Valves Industry Revenue Share (%), by End-user Industry 2025 & 2033
- Figure 22: North America Chemical Injection Metering Pumps and Valves Industry Volume Share (%), by End-user Industry 2025 & 2033
- Figure 23: North America Chemical Injection Metering Pumps and Valves Industry Revenue (Million), by Country 2025 & 2033
- Figure 24: North America Chemical Injection Metering Pumps and Valves Industry Volume (Billion), by Country 2025 & 2033
- Figure 25: North America Chemical Injection Metering Pumps and Valves Industry Revenue Share (%), by Country 2025 & 2033
- Figure 26: North America Chemical Injection Metering Pumps and Valves Industry Volume Share (%), by Country 2025 & 2033
- Figure 27: Europe Chemical Injection Metering Pumps and Valves Industry Revenue (Million), by Pump Type 2025 & 2033
- Figure 28: Europe Chemical Injection Metering Pumps and Valves Industry Volume (Billion), by Pump Type 2025 & 2033
- Figure 29: Europe Chemical Injection Metering Pumps and Valves Industry Revenue Share (%), by Pump Type 2025 & 2033
- Figure 30: Europe Chemical Injection Metering Pumps and Valves Industry Volume Share (%), by Pump Type 2025 & 2033
- Figure 31: Europe Chemical Injection Metering Pumps and Valves Industry Revenue (Million), by End-user Industry 2025 & 2033
- Figure 32: Europe Chemical Injection Metering Pumps and Valves Industry Volume (Billion), by End-user Industry 2025 & 2033
- Figure 33: Europe Chemical Injection Metering Pumps and Valves Industry Revenue Share (%), by End-user Industry 2025 & 2033
- Figure 34: Europe Chemical Injection Metering Pumps and Valves Industry Volume Share (%), by End-user Industry 2025 & 2033
- Figure 35: Europe Chemical Injection Metering Pumps and Valves Industry Revenue (Million), by Country 2025 & 2033
- Figure 36: Europe Chemical Injection Metering Pumps and Valves Industry Volume (Billion), by Country 2025 & 2033
- Figure 37: Europe Chemical Injection Metering Pumps and Valves Industry Revenue Share (%), by Country 2025 & 2033
- Figure 38: Europe Chemical Injection Metering Pumps and Valves Industry Volume Share (%), by Country 2025 & 2033
- Figure 39: South America Chemical Injection Metering Pumps and Valves Industry Revenue (Million), by Pump Type 2025 & 2033
- Figure 40: South America Chemical Injection Metering Pumps and Valves Industry Volume (Billion), by Pump Type 2025 & 2033
- Figure 41: South America Chemical Injection Metering Pumps and Valves Industry Revenue Share (%), by Pump Type 2025 & 2033
- Figure 42: South America Chemical Injection Metering Pumps and Valves Industry Volume Share (%), by Pump Type 2025 & 2033
- Figure 43: South America Chemical Injection Metering Pumps and Valves Industry Revenue (Million), by End-user Industry 2025 & 2033
- Figure 44: South America Chemical Injection Metering Pumps and Valves Industry Volume (Billion), by End-user Industry 2025 & 2033
- Figure 45: South America Chemical Injection Metering Pumps and Valves Industry Revenue Share (%), by End-user Industry 2025 & 2033
- Figure 46: South America Chemical Injection Metering Pumps and Valves Industry Volume Share (%), by End-user Industry 2025 & 2033
- Figure 47: South America Chemical Injection Metering Pumps and Valves Industry Revenue (Million), by Country 2025 & 2033
- Figure 48: South America Chemical Injection Metering Pumps and Valves Industry Volume (Billion), by Country 2025 & 2033
- Figure 49: South America Chemical Injection Metering Pumps and Valves Industry Revenue Share (%), by Country 2025 & 2033
- Figure 50: South America Chemical Injection Metering Pumps and Valves Industry Volume Share (%), by Country 2025 & 2033
- Figure 51: Middle East and Africa Chemical Injection Metering Pumps and Valves Industry Revenue (Million), by Pump Type 2025 & 2033
- Figure 52: Middle East and Africa Chemical Injection Metering Pumps and Valves Industry Volume (Billion), by Pump Type 2025 & 2033
- Figure 53: Middle East and Africa Chemical Injection Metering Pumps and Valves Industry Revenue Share (%), by Pump Type 2025 & 2033
- Figure 54: Middle East and Africa Chemical Injection Metering Pumps and Valves Industry Volume Share (%), by Pump Type 2025 & 2033
- Figure 55: Middle East and Africa Chemical Injection Metering Pumps and Valves Industry Revenue (Million), by End-user Industry 2025 & 2033
- Figure 56: Middle East and Africa Chemical Injection Metering Pumps and Valves Industry Volume (Billion), by End-user Industry 2025 & 2033
- Figure 57: Middle East and Africa Chemical Injection Metering Pumps and Valves Industry Revenue Share (%), by End-user Industry 2025 & 2033
- Figure 58: Middle East and Africa Chemical Injection Metering Pumps and Valves Industry Volume Share (%), by End-user Industry 2025 & 2033
- Figure 59: Middle East and Africa Chemical Injection Metering Pumps and Valves Industry Revenue (Million), by Country 2025 & 2033
- Figure 60: Middle East and Africa Chemical Injection Metering Pumps and Valves Industry Volume (Billion), by Country 2025 & 2033
- Figure 61: Middle East and Africa Chemical Injection Metering Pumps and Valves Industry Revenue Share (%), by Country 2025 & 2033
- Figure 62: Middle East and Africa Chemical Injection Metering Pumps and Valves Industry Volume Share (%), by Country 2025 & 2033
List of Tables
- Table 1: Global Chemical Injection Metering Pumps and Valves Industry Revenue Million Forecast, by Pump Type 2020 & 2033
- Table 2: Global Chemical Injection Metering Pumps and Valves Industry Volume Billion Forecast, by Pump Type 2020 & 2033
- Table 3: Global Chemical Injection Metering Pumps and Valves Industry Revenue Million Forecast, by End-user Industry 2020 & 2033
- Table 4: Global Chemical Injection Metering Pumps and Valves Industry Volume Billion Forecast, by End-user Industry 2020 & 2033
- Table 5: Global Chemical Injection Metering Pumps and Valves Industry Revenue Million Forecast, by Region 2020 & 2033
- Table 6: Global Chemical Injection Metering Pumps and Valves Industry Volume Billion Forecast, by Region 2020 & 2033
- Table 7: Global Chemical Injection Metering Pumps and Valves Industry Revenue Million Forecast, by Pump Type 2020 & 2033
- Table 8: Global Chemical Injection Metering Pumps and Valves Industry Volume Billion Forecast, by Pump Type 2020 & 2033
- Table 9: Global Chemical Injection Metering Pumps and Valves Industry Revenue Million Forecast, by End-user Industry 2020 & 2033
- Table 10: Global Chemical Injection Metering Pumps and Valves Industry Volume Billion Forecast, by End-user Industry 2020 & 2033
- Table 11: Global Chemical Injection Metering Pumps and Valves Industry Revenue Million Forecast, by Country 2020 & 2033
- Table 12: Global Chemical Injection Metering Pumps and Valves Industry Volume Billion Forecast, by Country 2020 & 2033
- Table 13: China Chemical Injection Metering Pumps and Valves Industry Revenue (Million) Forecast, by Application 2020 & 2033
- Table 14: China Chemical Injection Metering Pumps and Valves Industry Volume (Billion) Forecast, by Application 2020 & 2033
- Table 15: India Chemical Injection Metering Pumps and Valves Industry Revenue (Million) Forecast, by Application 2020 & 2033
- Table 16: India Chemical Injection Metering Pumps and Valves Industry Volume (Billion) Forecast, by Application 2020 & 2033
- Table 17: Japan Chemical Injection Metering Pumps and Valves Industry Revenue (Million) Forecast, by Application 2020 & 2033
- Table 18: Japan Chemical Injection Metering Pumps and Valves Industry Volume (Billion) Forecast, by Application 2020 & 2033
- Table 19: South Korea Chemical Injection Metering Pumps and Valves Industry Revenue (Million) Forecast, by Application 2020 & 2033
- Table 20: South Korea Chemical Injection Metering Pumps and Valves Industry Volume (Billion) Forecast, by Application 2020 & 2033
- Table 21: ASEAN Countries Chemical Injection Metering Pumps and Valves Industry Revenue (Million) Forecast, by Application 2020 & 2033
- Table 22: ASEAN Countries Chemical Injection Metering Pumps and Valves Industry Volume (Billion) Forecast, by Application 2020 & 2033
- Table 23: Australia and New Zealand Chemical Injection Metering Pumps and Valves Industry Revenue (Million) Forecast, by Application 2020 & 2033
- Table 24: Australia and New Zealand Chemical Injection Metering Pumps and Valves Industry Volume (Billion) Forecast, by Application 2020 & 2033
- Table 25: Rest of Asia Pacific Chemical Injection Metering Pumps and Valves Industry Revenue (Million) Forecast, by Application 2020 & 2033
- Table 26: Rest of Asia Pacific Chemical Injection Metering Pumps and Valves Industry Volume (Billion) Forecast, by Application 2020 & 2033
- Table 27: Global Chemical Injection Metering Pumps and Valves Industry Revenue Million Forecast, by Pump Type 2020 & 2033
- Table 28: Global Chemical Injection Metering Pumps and Valves Industry Volume Billion Forecast, by Pump Type 2020 & 2033
- Table 29: Global Chemical Injection Metering Pumps and Valves Industry Revenue Million Forecast, by End-user Industry 2020 & 2033
- Table 30: Global Chemical Injection Metering Pumps and Valves Industry Volume Billion Forecast, by End-user Industry 2020 & 2033
- Table 31: Global Chemical Injection Metering Pumps and Valves Industry Revenue Million Forecast, by Country 2020 & 2033
- Table 32: Global Chemical Injection Metering Pumps and Valves Industry Volume Billion Forecast, by Country 2020 & 2033
- Table 33: United States Chemical Injection Metering Pumps and Valves Industry Revenue (Million) Forecast, by Application 2020 & 2033
- Table 34: United States Chemical Injection Metering Pumps and Valves Industry Volume (Billion) Forecast, by Application 2020 & 2033
- Table 35: Canada Chemical Injection Metering Pumps and Valves Industry Revenue (Million) Forecast, by Application 2020 & 2033
- Table 36: Canada Chemical Injection Metering Pumps and Valves Industry Volume (Billion) Forecast, by Application 2020 & 2033
- Table 37: Mexico Chemical Injection Metering Pumps and Valves Industry Revenue (Million) Forecast, by Application 2020 & 2033
- Table 38: Mexico Chemical Injection Metering Pumps and Valves Industry Volume (Billion) Forecast, by Application 2020 & 2033
- Table 39: Global Chemical Injection Metering Pumps and Valves Industry Revenue Million Forecast, by Pump Type 2020 & 2033
- Table 40: Global Chemical Injection Metering Pumps and Valves Industry Volume Billion Forecast, by Pump Type 2020 & 2033
- Table 41: Global Chemical Injection Metering Pumps and Valves Industry Revenue Million Forecast, by End-user Industry 2020 & 2033
- Table 42: Global Chemical Injection Metering Pumps and Valves Industry Volume Billion Forecast, by End-user Industry 2020 & 2033
- Table 43: Global Chemical Injection Metering Pumps and Valves Industry Revenue Million Forecast, by Country 2020 & 2033
- Table 44: Global Chemical Injection Metering Pumps and Valves Industry Volume Billion Forecast, by Country 2020 & 2033
- Table 45: Germany Chemical Injection Metering Pumps and Valves Industry Revenue (Million) Forecast, by Application 2020 & 2033
- Table 46: Germany Chemical Injection Metering Pumps and Valves Industry Volume (Billion) Forecast, by Application 2020 & 2033
- Table 47: United Kingdom Chemical Injection Metering Pumps and Valves Industry Revenue (Million) Forecast, by Application 2020 & 2033
- Table 48: United Kingdom Chemical Injection Metering Pumps and Valves Industry Volume (Billion) Forecast, by Application 2020 & 2033
- Table 49: Italy Chemical Injection Metering Pumps and Valves Industry Revenue (Million) Forecast, by Application 2020 & 2033
- Table 50: Italy Chemical Injection Metering Pumps and Valves Industry Volume (Billion) Forecast, by Application 2020 & 2033
- Table 51: France Chemical Injection Metering Pumps and Valves Industry Revenue (Million) Forecast, by Application 2020 & 2033
- Table 52: France Chemical Injection Metering Pumps and Valves Industry Volume (Billion) Forecast, by Application 2020 & 2033
- Table 53: Russia Chemical Injection Metering Pumps and Valves Industry Revenue (Million) Forecast, by Application 2020 & 2033
- Table 54: Russia Chemical Injection Metering Pumps and Valves Industry Volume (Billion) Forecast, by Application 2020 & 2033
- Table 55: Spain Chemical Injection Metering Pumps and Valves Industry Revenue (Million) Forecast, by Application 2020 & 2033
- Table 56: Spain Chemical Injection Metering Pumps and Valves Industry Volume (Billion) Forecast, by Application 2020 & 2033
- Table 57: Rest of Europe Chemical Injection Metering Pumps and Valves Industry Revenue (Million) Forecast, by Application 2020 & 2033
- Table 58: Rest of Europe Chemical Injection Metering Pumps and Valves Industry Volume (Billion) Forecast, by Application 2020 & 2033
- Table 59: Global Chemical Injection Metering Pumps and Valves Industry Revenue Million Forecast, by Pump Type 2020 & 2033
- Table 60: Global Chemical Injection Metering Pumps and Valves Industry Volume Billion Forecast, by Pump Type 2020 & 2033
- Table 61: Global Chemical Injection Metering Pumps and Valves Industry Revenue Million Forecast, by End-user Industry 2020 & 2033
- Table 62: Global Chemical Injection Metering Pumps and Valves Industry Volume Billion Forecast, by End-user Industry 2020 & 2033
- Table 63: Global Chemical Injection Metering Pumps and Valves Industry Revenue Million Forecast, by Country 2020 & 2033
- Table 64: Global Chemical Injection Metering Pumps and Valves Industry Volume Billion Forecast, by Country 2020 & 2033
- Table 65: Brazil Chemical Injection Metering Pumps and Valves Industry Revenue (Million) Forecast, by Application 2020 & 2033
- Table 66: Brazil Chemical Injection Metering Pumps and Valves Industry Volume (Billion) Forecast, by Application 2020 & 2033
- Table 67: Argentina Chemical Injection Metering Pumps and Valves Industry Revenue (Million) Forecast, by Application 2020 & 2033
- Table 68: Argentina Chemical Injection Metering Pumps and Valves Industry Volume (Billion) Forecast, by Application 2020 & 2033
- Table 69: Rest of South America Chemical Injection Metering Pumps and Valves Industry Revenue (Million) Forecast, by Application 2020 & 2033
- Table 70: Rest of South America Chemical Injection Metering Pumps and Valves Industry Volume (Billion) Forecast, by Application 2020 & 2033
- Table 71: Global Chemical Injection Metering Pumps and Valves Industry Revenue Million Forecast, by Pump Type 2020 & 2033
- Table 72: Global Chemical Injection Metering Pumps and Valves Industry Volume Billion Forecast, by Pump Type 2020 & 2033
- Table 73: Global Chemical Injection Metering Pumps and Valves Industry Revenue Million Forecast, by End-user Industry 2020 & 2033
- Table 74: Global Chemical Injection Metering Pumps and Valves Industry Volume Billion Forecast, by End-user Industry 2020 & 2033
- Table 75: Global Chemical Injection Metering Pumps and Valves Industry Revenue Million Forecast, by Country 2020 & 2033
- Table 76: Global Chemical Injection Metering Pumps and Valves Industry Volume Billion Forecast, by Country 2020 & 2033
- Table 77: Saudi Arabia Chemical Injection Metering Pumps and Valves Industry Revenue (Million) Forecast, by Application 2020 & 2033
- Table 78: Saudi Arabia Chemical Injection Metering Pumps and Valves Industry Volume (Billion) Forecast, by Application 2020 & 2033
- Table 79: South Africa Chemical Injection Metering Pumps and Valves Industry Revenue (Million) Forecast, by Application 2020 & 2033
- Table 80: South Africa Chemical Injection Metering Pumps and Valves Industry Volume (Billion) Forecast, by Application 2020 & 2033
- Table 81: Rest of Middle East and Africa Chemical Injection Metering Pumps and Valves Industry Revenue (Million) Forecast, by Application 2020 & 2033
- Table 82: Rest of Middle East and Africa Chemical Injection Metering Pumps and Valves Industry Volume (Billion) Forecast, by Application 2020 & 2033
Frequently Asked Questions
1. What is the projected Compound Annual Growth Rate (CAGR) of the Chemical Injection Metering Pumps and Valves Industry?
The projected CAGR is approximately 2.79%.
2. Which companies are prominent players in the Chemical Injection Metering Pumps and Valves Industry?
Key companies in the market include Cameron (Schlumberger), Hunting PLC, Idex Corporation, ITC Dosing Pumps, Lewa GmbH, McFarland-Tritan LLC, Milton Roy, ProMinent, Seepex GmbH, Seko SpA, SkoFlo Industries Inc, SPX FLOW Inc, Swelore Engineering Pvt Ltd *List Not Exhaustive.
3. What are the main segments of the Chemical Injection Metering Pumps and Valves Industry?
The market segments include Pump Type, End-user Industry.
4. Can you provide details about the market size?
The market size is estimated to be USD 4.57 Million as of 2022.
5. What are some drivers contributing to market growth?
Accelerating Demand from Wastewater Treatment Applications; Robust Operational Procedures for Regulating Environmental Concerns; Other Drivers.
6. What are the notable trends driving market growth?
Energy. Power. and Chemicals to Dominate the Market.
7. Are there any restraints impacting market growth?
Accelerating Demand from Wastewater Treatment Applications; Robust Operational Procedures for Regulating Environmental Concerns; Other Drivers.
8. Can you provide examples of recent developments in the market?
9. What pricing options are available for accessing the report?
Pricing options include single-user, multi-user, and enterprise licenses priced at USD 4750, USD 5250, and USD 8750 respectively.
10. Is the market size provided in terms of value or volume?
The market size is provided in terms of value, measured in Million and volume, measured in Billion.
11. Are there any specific market keywords associated with the report?
Yes, the market keyword associated with the report is "Chemical Injection Metering Pumps and Valves Industry," which aids in identifying and referencing the specific market segment covered.
12. How do I determine which pricing option suits my needs best?
The pricing options vary based on user requirements and access needs. Individual users may opt for single-user licenses, while businesses requiring broader access may choose multi-user or enterprise licenses for cost-effective access to the report.
13. Are there any additional resources or data provided in the Chemical Injection Metering Pumps and Valves Industry report?
While the report offers comprehensive insights, it's advisable to review the specific contents or supplementary materials provided to ascertain if additional resources or data are available.
14. How can I stay updated on further developments or reports in the Chemical Injection Metering Pumps and Valves Industry?
To stay informed about further developments, trends, and reports in the Chemical Injection Metering Pumps and Valves Industry, consider subscribing to industry newsletters, following relevant companies and organizations, or regularly checking reputable industry news sources and publications.
Methodology
Step 1 - Identification of Relevant Samples Size from Population Database


Step 2 - Approaches for Defining Global Market Size (Value, Volume* & Price*)

Note*: In applicable scenarios
Step 3 - Data Sources
Primary Research
- Web Analytics
- Survey Reports
- Research Institute
- Latest Research Reports
- Opinion Leaders
Secondary Research
- Annual Reports
- White Paper
- Latest Press Release
- Industry Association
- Paid Database
- Investor Presentations

Step 4 - Data Triangulation
Involves using different sources of information in order to increase the validity of a study
These sources are likely to be stakeholders in a program - participants, other researchers, program staff, other community members, and so on.
Then we put all data in single framework & apply various statistical tools to find out the dynamic on the market.
During the analysis stage, feedback from the stakeholder groups would be compared to determine areas of agreement as well as areas of divergence