

Key Insights
The Clear Brine Fluids market, valued at 820 million in 2019, is projected to grow at a Compound Annual Growth Rate (CAGR) of 3.3% from 2019 to 2025. Key growth drivers include the increasing demand for enhanced oil recovery (EOR) and the rising adoption of hydraulic fracturing and unconventional drilling methods in the oil and gas sector. Environmental considerations and the development of sustainable fluid formulations also contribute to market expansion. Major product types include calcium chloride, sodium chloride, and specialized formulations such as zinc calcium bromides and cesium formate. Geographically, North America and the Asia-Pacific region are expected to lead market share due to extensive oil and gas activities. However, stringent environmental regulations and raw material price volatility present potential market challenges.
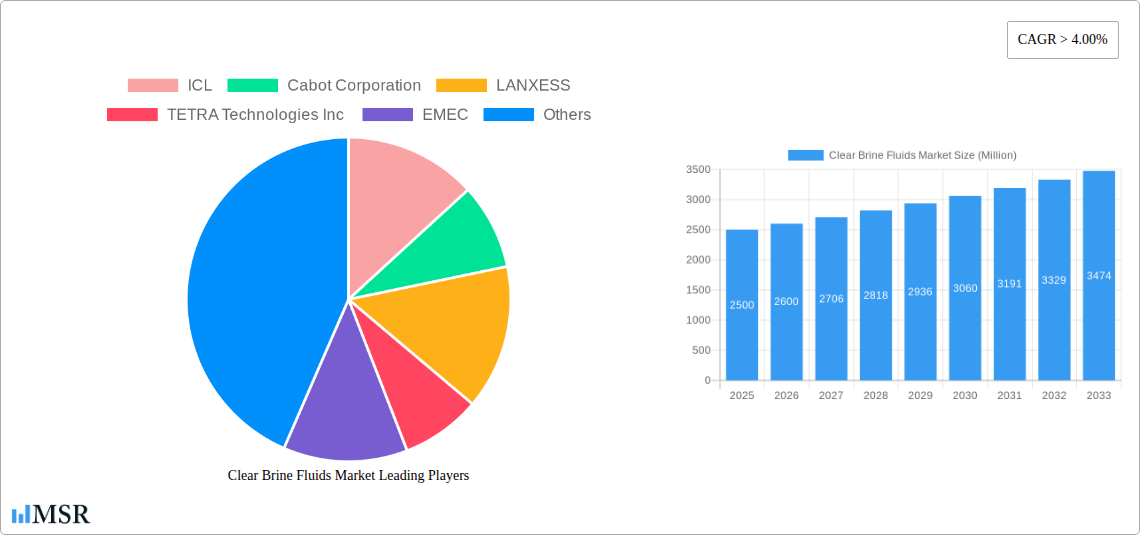
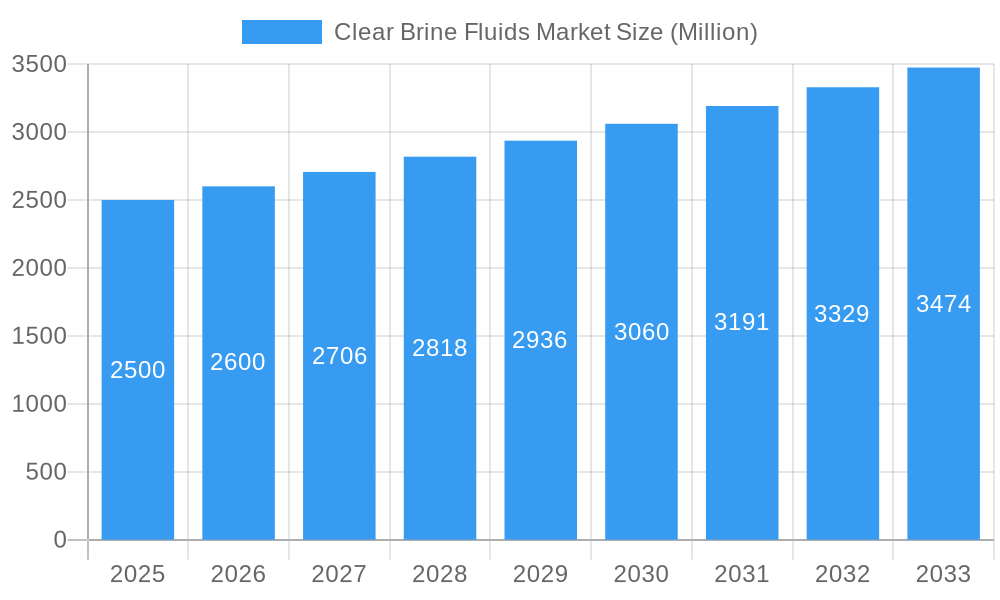
Clear Brine Fluids Market Market Size (In Million)
The competitive landscape features established players and specialized fluid service providers, including ICL, Cabot Corporation, LANXESS, TETRA Technologies Inc, EMEC, Baker Hughes Company, Halliburton, Schlumberger Limited, Clements Fluids, and Albemarle Corporation. Strategic initiatives focused on innovation, technological advancement, and high-performance fluid development are key market differentiators. Market consolidation is anticipated, with larger entities acquiring smaller competitors to enhance market presence and product offerings, thereby intensifying competition and fostering innovation. Emerging economies and a growing emphasis on sustainable practices will significantly influence the future direction of the clear brine fluids market.
Clear Brine Fluids Market Company Market Share
Clear Brine Fluids Market: A Comprehensive Report (2019-2033)
This comprehensive report provides an in-depth analysis of the Clear Brine Fluids market, offering invaluable insights for industry stakeholders, investors, and strategic decision-makers. Covering the period from 2019 to 2033, with a base year of 2025 and a forecast period of 2025-2033, this report unveils the market's dynamics, growth drivers, and future potential. The market is segmented by product type (Calcium Chloride, Sodium Chloride, Zinc Calcium bromides, Cesium Formate, Potassium Chloride, Other Product Types) and application (Oil and Gas Exploration, Enhanced Oil Recovery), with a focus on key players like ICL, Cabot Corporation, LANXESS, TETRA Technologies Inc., EMEC, Baker Hughes Company, Halliburton, Schlumberger Limited, Clements Fluids, and Albemarle Corporation. The report's value surpasses XX Million USD, showcasing a robust CAGR.
Clear Brine Fluids Market Concentration & Dynamics
The Clear Brine Fluids market exhibits a moderately concentrated landscape, with a few major players holding significant market share. Market concentration is influenced by factors such as economies of scale, technological advancements, and access to raw materials. The market is characterized by ongoing innovation, with companies constantly striving to develop enhanced brine fluids with improved performance characteristics. Regulatory frameworks, particularly concerning environmental regulations and safety standards, play a crucial role in shaping market dynamics. Substitute products, such as alternative drilling fluids, exert competitive pressure. End-user trends, primarily driven by the oil and gas industry, significantly impact market demand. Mergers and acquisitions (M&A) activities are relatively frequent, reflecting the industry's consolidation trend.
- Market Share: Top 5 players hold approximately xx% of the market share in 2025.
- M&A Activity: An estimated xx M&A deals occurred between 2019 and 2024.
- Innovation Ecosystem: Strong R&D investment drives innovation in fluid formulations and applications.
- Regulatory Landscape: Stringent environmental regulations influence product development and adoption.
Clear Brine Fluids Market Industry Insights & Trends
The Clear Brine Fluids market is projected to experience substantial growth during the forecast period (2025-2033), driven by the increasing demand for oil and gas exploration and enhanced oil recovery (EOR) techniques. The market size is estimated to be xx Million USD in 2025, demonstrating a robust Compound Annual Growth Rate (CAGR) of xx% from 2025 to 2033. Technological disruptions, such as the development of novel fluid formulations with improved efficiency and environmental friendliness, are reshaping the market landscape. Evolving consumer behavior, characterized by a greater emphasis on sustainability and environmental responsibility, is influencing the demand for eco-friendly brine fluids. Furthermore, the increasing adoption of advanced drilling techniques, such as hydraulic fracturing, is fueling market growth.
Key Markets & Segments Leading Clear Brine Fluids Market
The North American region is currently the dominant market for clear brine fluids, driven by robust oil and gas exploration and production activities. Within product types, Calcium Chloride and Sodium Chloride dominate due to their cost-effectiveness and widespread applicability. Enhanced Oil Recovery (EOR) applications are also witnessing substantial growth, fueled by the need to maximize oil and gas extraction from mature fields.
Key Drivers:
- Oil and Gas Exploration: Growing investments in oil and gas exploration and production.
- Enhanced Oil Recovery (EOR): Increasing demand for efficient EOR techniques to maximize oil recovery.
- Economic Growth: Expansion in the global economy fuels demand for energy resources.
- Infrastructure Development: Investments in oil and gas infrastructure create demand for brine fluids.
Dominance Analysis:
Calcium Chloride and Sodium Chloride dominate the product type segment due to cost advantages and established applications. North America and the Middle East hold the largest market share due to their strong oil and gas sectors. The Enhanced Oil Recovery (EOR) application segment experiences robust growth due to its contribution to increased oil production in mature fields.
Clear Brine Fluids Market Product Developments
Significant advancements in clear brine fluid technology have led to the development of environmentally friendly and high-performance formulations. These innovations focus on reducing environmental impact, improving drilling efficiency, and enhancing oil recovery. The introduction of advanced polymers and additives has resulted in fluids with better rheological properties, reducing friction and improving flow characteristics. This enhances drilling operations and increases the effectiveness of EOR techniques. Competition is primarily driven by innovation and the ability to provide cost-effective solutions while meeting stringent environmental standards.
Challenges in the Clear Brine Fluids Market Market
The Clear Brine Fluids market faces several challenges, including fluctuating oil prices, stringent environmental regulations, and supply chain disruptions. These factors influence both the cost and availability of raw materials, directly impacting production costs and market stability. Intense competition among established players and emerging companies also creates pressure on profit margins. Regulatory hurdles and compliance costs associated with environmental regulations add to the operational expenses of businesses in this sector.
Forces Driving Clear Brine Fluids Market Growth
The market's growth is propelled by several factors, including rising global energy demand, expanding oil and gas exploration activities, technological advancements in drilling and EOR techniques, and governmental incentives for enhanced oil recovery projects. The increasing adoption of hydraulic fracturing, which necessitates large volumes of brine fluids, further boosts market expansion. Growing investments in the oil and gas sector provide sustained demand and underpin market growth.
Long-Term Growth Catalysts in the Clear Brine Fluids Market
Long-term growth will be driven by continued innovation in fluid formulations, strategic partnerships between chemical manufacturers and oilfield service companies, and expansion into emerging markets with significant oil and gas reserves. The development of sustainable and biodegradable brine fluids will be a key driver, addressing increasing environmental concerns. Further integration across the value chain, including enhanced collaborations among manufacturers and end users, will shape the market landscape.
Emerging Opportunities in Clear Brine Fluids Market
Emerging opportunities lie in the development of specialized brine fluids for unconventional oil and gas reservoirs and the exploration of innovative applications beyond traditional oil and gas extraction. The growing interest in carbon capture, utilization, and storage (CCUS) technologies presents potential new applications for clear brine fluids. Furthermore, advancements in nanotechnology offer avenues for developing enhanced fluid formulations with superior performance characteristics.
Leading Players in the Clear Brine Fluids Market Sector
Key Milestones in Clear Brine Fluids Market Industry
- July 2018: TETRA Technologies Inc. and Halliburton formed a joint marketing and development agreement for completion fluids. This significantly expanded the market reach of TETRA's proprietary fluids.
- May 2019: Baker Hughes launched DELTA-TEQ, a low-pressure-impact drilling fluid, showcasing innovation in reducing hydraulic impact during drilling operations. This launch highlighted a shift towards environmentally friendlier and more efficient formulations.
Strategic Outlook for Clear Brine Fluids Market Market
The Clear Brine Fluids market presents significant growth opportunities, driven by sustained demand from the oil and gas industry and technological advancements leading to more efficient and eco-friendly formulations. Strategic partnerships, focused on research and development, and expansion into emerging markets will be crucial for sustained growth. Companies with a strong focus on innovation, sustainability, and efficient supply chains are well-positioned to capitalize on the market's future potential.
Clear Brine Fluids Market Segmentation
-
1. Product Type
- 1.1. Calcium Chloride
- 1.2. Sodium Chloride
- 1.3. Zinc Calcium bromides
- 1.4. Cesium Formate
- 1.5. Potassium Chloride
- 1.6. Other Product Types
-
2. Application
- 2.1. Oil and Gas Exploration
- 2.2. Enhanced Oil Recovery
Clear Brine Fluids Market Segmentation By Geography
-
1. Asia Pacific
- 1.1. China
- 1.2. India
- 1.3. Japan
- 1.4. Rest of Asia Pacific
-
2. North America
- 2.1. United States
- 2.2. Canada
- 2.3. Rest of North America
-
3. Europe
- 3.1. Germany
- 3.2. United Kingdom
- 3.3. France
- 3.4. Russia
- 3.5. Rest of Europe
-
4. South America
- 4.1. Brazil
- 4.2. Argentina
- 4.3. Rest of South America
-
5. Middle East and Africa
- 5.1. Saudi Arabia
- 5.2. Qatar
- 5.3. United Arab Emirates
- 5.4. Rest of Middle East and Africa
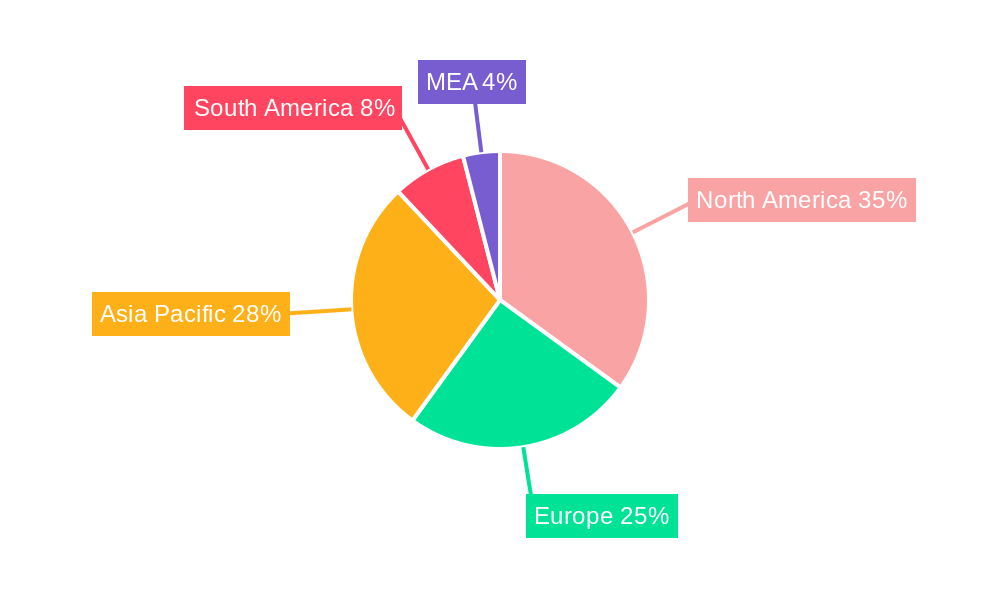
Clear Brine Fluids Market Regional Market Share
Geographic Coverage of Clear Brine Fluids Market
Clear Brine Fluids Market REPORT HIGHLIGHTS
| Aspects | Details |
|---|---|
| Study Period | 2020-2034 |
| Base Year | 2025 |
| Estimated Year | 2026 |
| Forecast Period | 2026-2034 |
| Historical Period | 2020-2025 |
| Growth Rate | CAGR of 3.3% from 2020-2034 |
| Segmentation |
|
Table of Contents
- 1. Introduction
- 1.1. Research Scope
- 1.2. Market Segmentation
- 1.3. Research Methodology
- 1.4. Definitions and Assumptions
- 2. Executive Summary
- 2.1. Introduction
- 3. Market Dynamics
- 3.1. Introduction
- 3.2. Market Drivers
- 3.2.1. Rising Global Hydrocarbon Exploration and Production; Increasing Enhanced Oil Recovery Activities
- 3.3. Market Restrains
- 3.3.1. Fluctuations in Crude Oil Prices; Impact of COVID-19 Outbreak
- 3.4. Market Trends
- 3.4.1. Increasing Demand from the Oil and Gas Exploration Activity
- 4. Market Factor Analysis
- 4.1. Porters Five Forces
- 4.2. Supply/Value Chain
- 4.3. PESTEL analysis
- 4.4. Market Entropy
- 4.5. Patent/Trademark Analysis
- 5. Global Clear Brine Fluids Market Analysis, Insights and Forecast, 2020-2032
- 5.1. Market Analysis, Insights and Forecast - by Product Type
- 5.1.1. Calcium Chloride
- 5.1.2. Sodium Chloride
- 5.1.3. Zinc Calcium bromides
- 5.1.4. Cesium Formate
- 5.1.5. Potassium Chloride
- 5.1.6. Other Product Types
- 5.2. Market Analysis, Insights and Forecast - by Application
- 5.2.1. Oil and Gas Exploration
- 5.2.2. Enhanced Oil Recovery
- 5.3. Market Analysis, Insights and Forecast - by Region
- 5.3.1. Asia Pacific
- 5.3.2. North America
- 5.3.3. Europe
- 5.3.4. South America
- 5.3.5. Middle East and Africa
- 5.1. Market Analysis, Insights and Forecast - by Product Type
- 6. Asia Pacific Clear Brine Fluids Market Analysis, Insights and Forecast, 2020-2032
- 6.1. Market Analysis, Insights and Forecast - by Product Type
- 6.1.1. Calcium Chloride
- 6.1.2. Sodium Chloride
- 6.1.3. Zinc Calcium bromides
- 6.1.4. Cesium Formate
- 6.1.5. Potassium Chloride
- 6.1.6. Other Product Types
- 6.2. Market Analysis, Insights and Forecast - by Application
- 6.2.1. Oil and Gas Exploration
- 6.2.2. Enhanced Oil Recovery
- 6.1. Market Analysis, Insights and Forecast - by Product Type
- 7. North America Clear Brine Fluids Market Analysis, Insights and Forecast, 2020-2032
- 7.1. Market Analysis, Insights and Forecast - by Product Type
- 7.1.1. Calcium Chloride
- 7.1.2. Sodium Chloride
- 7.1.3. Zinc Calcium bromides
- 7.1.4. Cesium Formate
- 7.1.5. Potassium Chloride
- 7.1.6. Other Product Types
- 7.2. Market Analysis, Insights and Forecast - by Application
- 7.2.1. Oil and Gas Exploration
- 7.2.2. Enhanced Oil Recovery
- 7.1. Market Analysis, Insights and Forecast - by Product Type
- 8. Europe Clear Brine Fluids Market Analysis, Insights and Forecast, 2020-2032
- 8.1. Market Analysis, Insights and Forecast - by Product Type
- 8.1.1. Calcium Chloride
- 8.1.2. Sodium Chloride
- 8.1.3. Zinc Calcium bromides
- 8.1.4. Cesium Formate
- 8.1.5. Potassium Chloride
- 8.1.6. Other Product Types
- 8.2. Market Analysis, Insights and Forecast - by Application
- 8.2.1. Oil and Gas Exploration
- 8.2.2. Enhanced Oil Recovery
- 8.1. Market Analysis, Insights and Forecast - by Product Type
- 9. South America Clear Brine Fluids Market Analysis, Insights and Forecast, 2020-2032
- 9.1. Market Analysis, Insights and Forecast - by Product Type
- 9.1.1. Calcium Chloride
- 9.1.2. Sodium Chloride
- 9.1.3. Zinc Calcium bromides
- 9.1.4. Cesium Formate
- 9.1.5. Potassium Chloride
- 9.1.6. Other Product Types
- 9.2. Market Analysis, Insights and Forecast - by Application
- 9.2.1. Oil and Gas Exploration
- 9.2.2. Enhanced Oil Recovery
- 9.1. Market Analysis, Insights and Forecast - by Product Type
- 10. Middle East and Africa Clear Brine Fluids Market Analysis, Insights and Forecast, 2020-2032
- 10.1. Market Analysis, Insights and Forecast - by Product Type
- 10.1.1. Calcium Chloride
- 10.1.2. Sodium Chloride
- 10.1.3. Zinc Calcium bromides
- 10.1.4. Cesium Formate
- 10.1.5. Potassium Chloride
- 10.1.6. Other Product Types
- 10.2. Market Analysis, Insights and Forecast - by Application
- 10.2.1. Oil and Gas Exploration
- 10.2.2. Enhanced Oil Recovery
- 10.1. Market Analysis, Insights and Forecast - by Product Type
- 11. Competitive Analysis
- 11.1. Global Market Share Analysis 2025
- 11.2. Company Profiles
- 11.2.1 ICL
- 11.2.1.1. Overview
- 11.2.1.2. Products
- 11.2.1.3. SWOT Analysis
- 11.2.1.4. Recent Developments
- 11.2.1.5. Financials (Based on Availability)
- 11.2.2 Cabot Corporation
- 11.2.2.1. Overview
- 11.2.2.2. Products
- 11.2.2.3. SWOT Analysis
- 11.2.2.4. Recent Developments
- 11.2.2.5. Financials (Based on Availability)
- 11.2.3 LANXESS
- 11.2.3.1. Overview
- 11.2.3.2. Products
- 11.2.3.3. SWOT Analysis
- 11.2.3.4. Recent Developments
- 11.2.3.5. Financials (Based on Availability)
- 11.2.4 TETRA Technologies Inc
- 11.2.4.1. Overview
- 11.2.4.2. Products
- 11.2.4.3. SWOT Analysis
- 11.2.4.4. Recent Developments
- 11.2.4.5. Financials (Based on Availability)
- 11.2.5 EMEC
- 11.2.5.1. Overview
- 11.2.5.2. Products
- 11.2.5.3. SWOT Analysis
- 11.2.5.4. Recent Developments
- 11.2.5.5. Financials (Based on Availability)
- 11.2.6 Baker Hughes Company
- 11.2.6.1. Overview
- 11.2.6.2. Products
- 11.2.6.3. SWOT Analysis
- 11.2.6.4. Recent Developments
- 11.2.6.5. Financials (Based on Availability)
- 11.2.7 Halliburton
- 11.2.7.1. Overview
- 11.2.7.2. Products
- 11.2.7.3. SWOT Analysis
- 11.2.7.4. Recent Developments
- 11.2.7.5. Financials (Based on Availability)
- 11.2.8 Schlumberger Limited
- 11.2.8.1. Overview
- 11.2.8.2. Products
- 11.2.8.3. SWOT Analysis
- 11.2.8.4. Recent Developments
- 11.2.8.5. Financials (Based on Availability)
- 11.2.9 Clements Fluids
- 11.2.9.1. Overview
- 11.2.9.2. Products
- 11.2.9.3. SWOT Analysis
- 11.2.9.4. Recent Developments
- 11.2.9.5. Financials (Based on Availability)
- 11.2.10 Albemarle Corporation
- 11.2.10.1. Overview
- 11.2.10.2. Products
- 11.2.10.3. SWOT Analysis
- 11.2.10.4. Recent Developments
- 11.2.10.5. Financials (Based on Availability)
- 11.2.1 ICL
List of Figures
- Figure 1: Global Clear Brine Fluids Market Revenue Breakdown (million, %) by Region 2025 & 2033
- Figure 2: Global Clear Brine Fluids Market Volume Breakdown (K Tons, %) by Region 2025 & 2033
- Figure 3: Asia Pacific Clear Brine Fluids Market Revenue (million), by Product Type 2025 & 2033
- Figure 4: Asia Pacific Clear Brine Fluids Market Volume (K Tons), by Product Type 2025 & 2033
- Figure 5: Asia Pacific Clear Brine Fluids Market Revenue Share (%), by Product Type 2025 & 2033
- Figure 6: Asia Pacific Clear Brine Fluids Market Volume Share (%), by Product Type 2025 & 2033
- Figure 7: Asia Pacific Clear Brine Fluids Market Revenue (million), by Application 2025 & 2033
- Figure 8: Asia Pacific Clear Brine Fluids Market Volume (K Tons), by Application 2025 & 2033
- Figure 9: Asia Pacific Clear Brine Fluids Market Revenue Share (%), by Application 2025 & 2033
- Figure 10: Asia Pacific Clear Brine Fluids Market Volume Share (%), by Application 2025 & 2033
- Figure 11: Asia Pacific Clear Brine Fluids Market Revenue (million), by Country 2025 & 2033
- Figure 12: Asia Pacific Clear Brine Fluids Market Volume (K Tons), by Country 2025 & 2033
- Figure 13: Asia Pacific Clear Brine Fluids Market Revenue Share (%), by Country 2025 & 2033
- Figure 14: Asia Pacific Clear Brine Fluids Market Volume Share (%), by Country 2025 & 2033
- Figure 15: North America Clear Brine Fluids Market Revenue (million), by Product Type 2025 & 2033
- Figure 16: North America Clear Brine Fluids Market Volume (K Tons), by Product Type 2025 & 2033
- Figure 17: North America Clear Brine Fluids Market Revenue Share (%), by Product Type 2025 & 2033
- Figure 18: North America Clear Brine Fluids Market Volume Share (%), by Product Type 2025 & 2033
- Figure 19: North America Clear Brine Fluids Market Revenue (million), by Application 2025 & 2033
- Figure 20: North America Clear Brine Fluids Market Volume (K Tons), by Application 2025 & 2033
- Figure 21: North America Clear Brine Fluids Market Revenue Share (%), by Application 2025 & 2033
- Figure 22: North America Clear Brine Fluids Market Volume Share (%), by Application 2025 & 2033
- Figure 23: North America Clear Brine Fluids Market Revenue (million), by Country 2025 & 2033
- Figure 24: North America Clear Brine Fluids Market Volume (K Tons), by Country 2025 & 2033
- Figure 25: North America Clear Brine Fluids Market Revenue Share (%), by Country 2025 & 2033
- Figure 26: North America Clear Brine Fluids Market Volume Share (%), by Country 2025 & 2033
- Figure 27: Europe Clear Brine Fluids Market Revenue (million), by Product Type 2025 & 2033
- Figure 28: Europe Clear Brine Fluids Market Volume (K Tons), by Product Type 2025 & 2033
- Figure 29: Europe Clear Brine Fluids Market Revenue Share (%), by Product Type 2025 & 2033
- Figure 30: Europe Clear Brine Fluids Market Volume Share (%), by Product Type 2025 & 2033
- Figure 31: Europe Clear Brine Fluids Market Revenue (million), by Application 2025 & 2033
- Figure 32: Europe Clear Brine Fluids Market Volume (K Tons), by Application 2025 & 2033
- Figure 33: Europe Clear Brine Fluids Market Revenue Share (%), by Application 2025 & 2033
- Figure 34: Europe Clear Brine Fluids Market Volume Share (%), by Application 2025 & 2033
- Figure 35: Europe Clear Brine Fluids Market Revenue (million), by Country 2025 & 2033
- Figure 36: Europe Clear Brine Fluids Market Volume (K Tons), by Country 2025 & 2033
- Figure 37: Europe Clear Brine Fluids Market Revenue Share (%), by Country 2025 & 2033
- Figure 38: Europe Clear Brine Fluids Market Volume Share (%), by Country 2025 & 2033
- Figure 39: South America Clear Brine Fluids Market Revenue (million), by Product Type 2025 & 2033
- Figure 40: South America Clear Brine Fluids Market Volume (K Tons), by Product Type 2025 & 2033
- Figure 41: South America Clear Brine Fluids Market Revenue Share (%), by Product Type 2025 & 2033
- Figure 42: South America Clear Brine Fluids Market Volume Share (%), by Product Type 2025 & 2033
- Figure 43: South America Clear Brine Fluids Market Revenue (million), by Application 2025 & 2033
- Figure 44: South America Clear Brine Fluids Market Volume (K Tons), by Application 2025 & 2033
- Figure 45: South America Clear Brine Fluids Market Revenue Share (%), by Application 2025 & 2033
- Figure 46: South America Clear Brine Fluids Market Volume Share (%), by Application 2025 & 2033
- Figure 47: South America Clear Brine Fluids Market Revenue (million), by Country 2025 & 2033
- Figure 48: South America Clear Brine Fluids Market Volume (K Tons), by Country 2025 & 2033
- Figure 49: South America Clear Brine Fluids Market Revenue Share (%), by Country 2025 & 2033
- Figure 50: South America Clear Brine Fluids Market Volume Share (%), by Country 2025 & 2033
- Figure 51: Middle East and Africa Clear Brine Fluids Market Revenue (million), by Product Type 2025 & 2033
- Figure 52: Middle East and Africa Clear Brine Fluids Market Volume (K Tons), by Product Type 2025 & 2033
- Figure 53: Middle East and Africa Clear Brine Fluids Market Revenue Share (%), by Product Type 2025 & 2033
- Figure 54: Middle East and Africa Clear Brine Fluids Market Volume Share (%), by Product Type 2025 & 2033
- Figure 55: Middle East and Africa Clear Brine Fluids Market Revenue (million), by Application 2025 & 2033
- Figure 56: Middle East and Africa Clear Brine Fluids Market Volume (K Tons), by Application 2025 & 2033
- Figure 57: Middle East and Africa Clear Brine Fluids Market Revenue Share (%), by Application 2025 & 2033
- Figure 58: Middle East and Africa Clear Brine Fluids Market Volume Share (%), by Application 2025 & 2033
- Figure 59: Middle East and Africa Clear Brine Fluids Market Revenue (million), by Country 2025 & 2033
- Figure 60: Middle East and Africa Clear Brine Fluids Market Volume (K Tons), by Country 2025 & 2033
- Figure 61: Middle East and Africa Clear Brine Fluids Market Revenue Share (%), by Country 2025 & 2033
- Figure 62: Middle East and Africa Clear Brine Fluids Market Volume Share (%), by Country 2025 & 2033
List of Tables
- Table 1: Global Clear Brine Fluids Market Revenue million Forecast, by Product Type 2020 & 2033
- Table 2: Global Clear Brine Fluids Market Volume K Tons Forecast, by Product Type 2020 & 2033
- Table 3: Global Clear Brine Fluids Market Revenue million Forecast, by Application 2020 & 2033
- Table 4: Global Clear Brine Fluids Market Volume K Tons Forecast, by Application 2020 & 2033
- Table 5: Global Clear Brine Fluids Market Revenue million Forecast, by Region 2020 & 2033
- Table 6: Global Clear Brine Fluids Market Volume K Tons Forecast, by Region 2020 & 2033
- Table 7: Global Clear Brine Fluids Market Revenue million Forecast, by Product Type 2020 & 2033
- Table 8: Global Clear Brine Fluids Market Volume K Tons Forecast, by Product Type 2020 & 2033
- Table 9: Global Clear Brine Fluids Market Revenue million Forecast, by Application 2020 & 2033
- Table 10: Global Clear Brine Fluids Market Volume K Tons Forecast, by Application 2020 & 2033
- Table 11: Global Clear Brine Fluids Market Revenue million Forecast, by Country 2020 & 2033
- Table 12: Global Clear Brine Fluids Market Volume K Tons Forecast, by Country 2020 & 2033
- Table 13: China Clear Brine Fluids Market Revenue (million) Forecast, by Application 2020 & 2033
- Table 14: China Clear Brine Fluids Market Volume (K Tons) Forecast, by Application 2020 & 2033
- Table 15: India Clear Brine Fluids Market Revenue (million) Forecast, by Application 2020 & 2033
- Table 16: India Clear Brine Fluids Market Volume (K Tons) Forecast, by Application 2020 & 2033
- Table 17: Japan Clear Brine Fluids Market Revenue (million) Forecast, by Application 2020 & 2033
- Table 18: Japan Clear Brine Fluids Market Volume (K Tons) Forecast, by Application 2020 & 2033
- Table 19: Rest of Asia Pacific Clear Brine Fluids Market Revenue (million) Forecast, by Application 2020 & 2033
- Table 20: Rest of Asia Pacific Clear Brine Fluids Market Volume (K Tons) Forecast, by Application 2020 & 2033
- Table 21: Global Clear Brine Fluids Market Revenue million Forecast, by Product Type 2020 & 2033
- Table 22: Global Clear Brine Fluids Market Volume K Tons Forecast, by Product Type 2020 & 2033
- Table 23: Global Clear Brine Fluids Market Revenue million Forecast, by Application 2020 & 2033
- Table 24: Global Clear Brine Fluids Market Volume K Tons Forecast, by Application 2020 & 2033
- Table 25: Global Clear Brine Fluids Market Revenue million Forecast, by Country 2020 & 2033
- Table 26: Global Clear Brine Fluids Market Volume K Tons Forecast, by Country 2020 & 2033
- Table 27: United States Clear Brine Fluids Market Revenue (million) Forecast, by Application 2020 & 2033
- Table 28: United States Clear Brine Fluids Market Volume (K Tons) Forecast, by Application 2020 & 2033
- Table 29: Canada Clear Brine Fluids Market Revenue (million) Forecast, by Application 2020 & 2033
- Table 30: Canada Clear Brine Fluids Market Volume (K Tons) Forecast, by Application 2020 & 2033
- Table 31: Rest of North America Clear Brine Fluids Market Revenue (million) Forecast, by Application 2020 & 2033
- Table 32: Rest of North America Clear Brine Fluids Market Volume (K Tons) Forecast, by Application 2020 & 2033
- Table 33: Global Clear Brine Fluids Market Revenue million Forecast, by Product Type 2020 & 2033
- Table 34: Global Clear Brine Fluids Market Volume K Tons Forecast, by Product Type 2020 & 2033
- Table 35: Global Clear Brine Fluids Market Revenue million Forecast, by Application 2020 & 2033
- Table 36: Global Clear Brine Fluids Market Volume K Tons Forecast, by Application 2020 & 2033
- Table 37: Global Clear Brine Fluids Market Revenue million Forecast, by Country 2020 & 2033
- Table 38: Global Clear Brine Fluids Market Volume K Tons Forecast, by Country 2020 & 2033
- Table 39: Germany Clear Brine Fluids Market Revenue (million) Forecast, by Application 2020 & 2033
- Table 40: Germany Clear Brine Fluids Market Volume (K Tons) Forecast, by Application 2020 & 2033
- Table 41: United Kingdom Clear Brine Fluids Market Revenue (million) Forecast, by Application 2020 & 2033
- Table 42: United Kingdom Clear Brine Fluids Market Volume (K Tons) Forecast, by Application 2020 & 2033
- Table 43: France Clear Brine Fluids Market Revenue (million) Forecast, by Application 2020 & 2033
- Table 44: France Clear Brine Fluids Market Volume (K Tons) Forecast, by Application 2020 & 2033
- Table 45: Russia Clear Brine Fluids Market Revenue (million) Forecast, by Application 2020 & 2033
- Table 46: Russia Clear Brine Fluids Market Volume (K Tons) Forecast, by Application 2020 & 2033
- Table 47: Rest of Europe Clear Brine Fluids Market Revenue (million) Forecast, by Application 2020 & 2033
- Table 48: Rest of Europe Clear Brine Fluids Market Volume (K Tons) Forecast, by Application 2020 & 2033
- Table 49: Global Clear Brine Fluids Market Revenue million Forecast, by Product Type 2020 & 2033
- Table 50: Global Clear Brine Fluids Market Volume K Tons Forecast, by Product Type 2020 & 2033
- Table 51: Global Clear Brine Fluids Market Revenue million Forecast, by Application 2020 & 2033
- Table 52: Global Clear Brine Fluids Market Volume K Tons Forecast, by Application 2020 & 2033
- Table 53: Global Clear Brine Fluids Market Revenue million Forecast, by Country 2020 & 2033
- Table 54: Global Clear Brine Fluids Market Volume K Tons Forecast, by Country 2020 & 2033
- Table 55: Brazil Clear Brine Fluids Market Revenue (million) Forecast, by Application 2020 & 2033
- Table 56: Brazil Clear Brine Fluids Market Volume (K Tons) Forecast, by Application 2020 & 2033
- Table 57: Argentina Clear Brine Fluids Market Revenue (million) Forecast, by Application 2020 & 2033
- Table 58: Argentina Clear Brine Fluids Market Volume (K Tons) Forecast, by Application 2020 & 2033
- Table 59: Rest of South America Clear Brine Fluids Market Revenue (million) Forecast, by Application 2020 & 2033
- Table 60: Rest of South America Clear Brine Fluids Market Volume (K Tons) Forecast, by Application 2020 & 2033
- Table 61: Global Clear Brine Fluids Market Revenue million Forecast, by Product Type 2020 & 2033
- Table 62: Global Clear Brine Fluids Market Volume K Tons Forecast, by Product Type 2020 & 2033
- Table 63: Global Clear Brine Fluids Market Revenue million Forecast, by Application 2020 & 2033
- Table 64: Global Clear Brine Fluids Market Volume K Tons Forecast, by Application 2020 & 2033
- Table 65: Global Clear Brine Fluids Market Revenue million Forecast, by Country 2020 & 2033
- Table 66: Global Clear Brine Fluids Market Volume K Tons Forecast, by Country 2020 & 2033
- Table 67: Saudi Arabia Clear Brine Fluids Market Revenue (million) Forecast, by Application 2020 & 2033
- Table 68: Saudi Arabia Clear Brine Fluids Market Volume (K Tons) Forecast, by Application 2020 & 2033
- Table 69: Qatar Clear Brine Fluids Market Revenue (million) Forecast, by Application 2020 & 2033
- Table 70: Qatar Clear Brine Fluids Market Volume (K Tons) Forecast, by Application 2020 & 2033
- Table 71: United Arab Emirates Clear Brine Fluids Market Revenue (million) Forecast, by Application 2020 & 2033
- Table 72: United Arab Emirates Clear Brine Fluids Market Volume (K Tons) Forecast, by Application 2020 & 2033
- Table 73: Rest of Middle East and Africa Clear Brine Fluids Market Revenue (million) Forecast, by Application 2020 & 2033
- Table 74: Rest of Middle East and Africa Clear Brine Fluids Market Volume (K Tons) Forecast, by Application 2020 & 2033
Frequently Asked Questions
1. What is the projected Compound Annual Growth Rate (CAGR) of the Clear Brine Fluids Market?
The projected CAGR is approximately 3.3%.
2. Which companies are prominent players in the Clear Brine Fluids Market?
Key companies in the market include ICL, Cabot Corporation, LANXESS, TETRA Technologies Inc , EMEC, Baker Hughes Company, Halliburton, Schlumberger Limited, Clements Fluids, Albemarle Corporation.
3. What are the main segments of the Clear Brine Fluids Market?
The market segments include Product Type, Application.
4. Can you provide details about the market size?
The market size is estimated to be USD 820 million as of 2022.
5. What are some drivers contributing to market growth?
Rising Global Hydrocarbon Exploration and Production; Increasing Enhanced Oil Recovery Activities.
6. What are the notable trends driving market growth?
Increasing Demand from the Oil and Gas Exploration Activity.
7. Are there any restraints impacting market growth?
Fluctuations in Crude Oil Prices; Impact of COVID-19 Outbreak.
8. Can you provide examples of recent developments in the market?
In May 2019, Baker Hughes, a GE company, announced the introduction of its DELTA-TEQ low-pressure-impact drilling fluid, a non-aqueous formulation that reduces the hydraulic impact with an advanced formulation of specialized clay and polymers.
9. What pricing options are available for accessing the report?
Pricing options include single-user, multi-user, and enterprise licenses priced at USD 3,950, USD 4,950, and USD 6,950 respectively.
10. Is the market size provided in terms of value or volume?
The market size is provided in terms of value, measured in million and volume, measured in K Tons.
11. Are there any specific market keywords associated with the report?
Yes, the market keyword associated with the report is "Clear Brine Fluids Market," which aids in identifying and referencing the specific market segment covered.
12. How do I determine which pricing option suits my needs best?
The pricing options vary based on user requirements and access needs. Individual users may opt for single-user licenses, while businesses requiring broader access may choose multi-user or enterprise licenses for cost-effective access to the report.
13. Are there any additional resources or data provided in the Clear Brine Fluids Market report?
While the report offers comprehensive insights, it's advisable to review the specific contents or supplementary materials provided to ascertain if additional resources or data are available.
14. How can I stay updated on further developments or reports in the Clear Brine Fluids Market?
To stay informed about further developments, trends, and reports in the Clear Brine Fluids Market, consider subscribing to industry newsletters, following relevant companies and organizations, or regularly checking reputable industry news sources and publications.
Methodology
Step 1 - Identification of Relevant Samples Size from Population Database


Step 2 - Approaches for Defining Global Market Size (Value, Volume* & Price*)

Note*: In applicable scenarios
Step 3 - Data Sources
Primary Research
- Web Analytics
- Survey Reports
- Research Institute
- Latest Research Reports
- Opinion Leaders
Secondary Research
- Annual Reports
- White Paper
- Latest Press Release
- Industry Association
- Paid Database
- Investor Presentations

Step 4 - Data Triangulation
Involves using different sources of information in order to increase the validity of a study
These sources are likely to be stakeholders in a program - participants, other researchers, program staff, other community members, and so on.
Then we put all data in single framework & apply various statistical tools to find out the dynamic on the market.
During the analysis stage, feedback from the stakeholder groups would be compared to determine areas of agreement as well as areas of divergence