

Key Insights
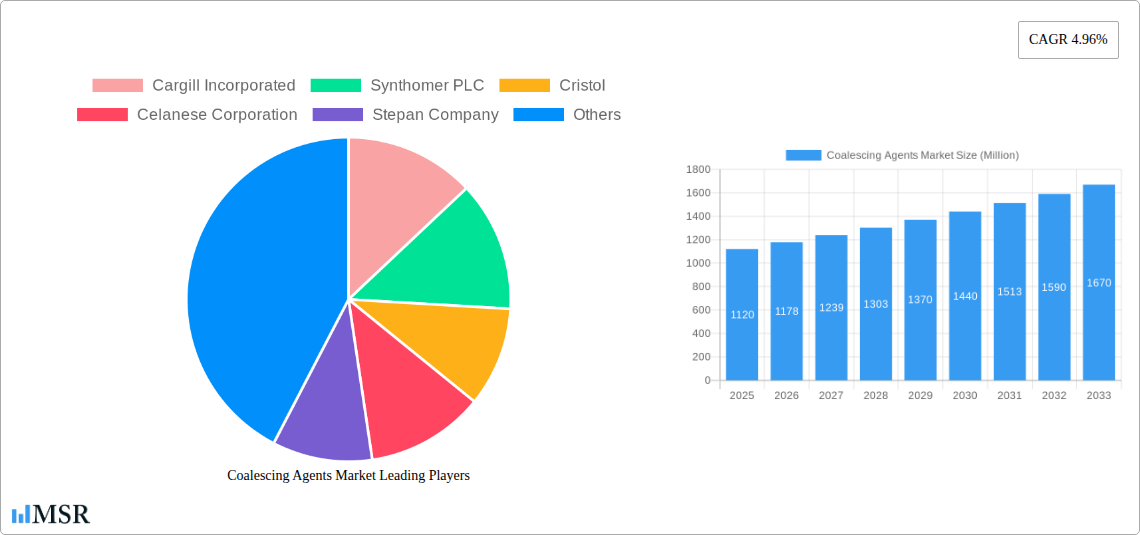
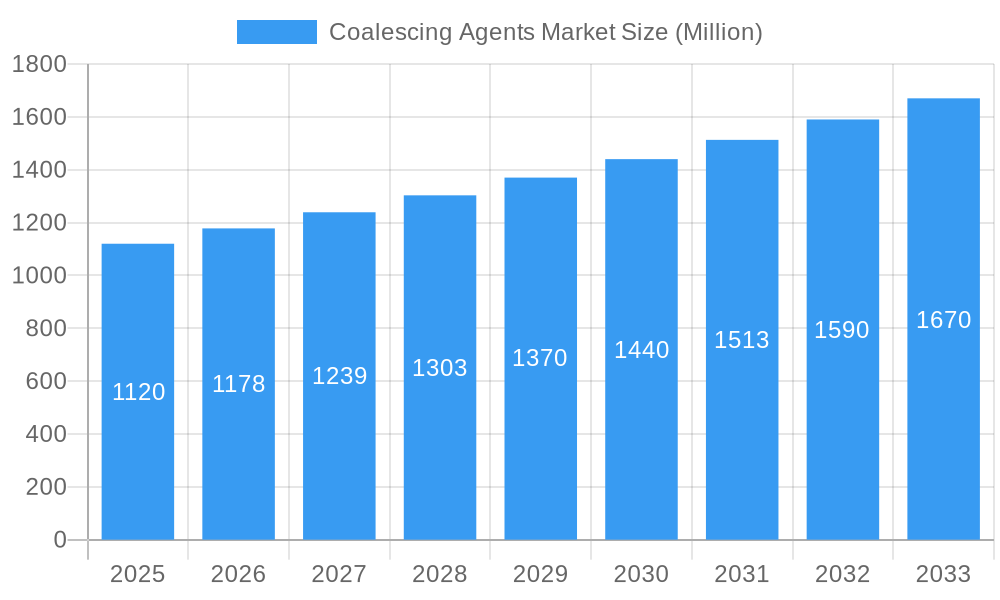
The global coalescing agents market is poised for robust growth, projected to reach an estimated USD 1.12 billion by 2025, with a steady Compound Annual Growth Rate (CAGR) of 4.96% anticipated through 2033. This sustained expansion is primarily fueled by the burgeoning demand from key end-use industries, notably paints & coatings, adhesives & sealants, and personal care products. The paints and coatings sector, in particular, acts as a significant growth engine, driven by increasing construction activities, infrastructure development projects, and a rising consumer preference for aesthetically pleasing and durable finishes. Furthermore, the personal care industry's growing demand for innovative formulations, including skincare and haircare products, where coalescing agents play a crucial role in film formation and stability, contributes to market uplift. The market is segmented into hydrophilic and hydrophobic types, with applications spanning adhesives & sealants, paints & coatings, inks, personal care, and other niche areas like decoloring and polymer manufacturing.
Coalescing Agents Market Market Size (In Billion)
While the market exhibits strong growth potential, certain factors present challenges. Stringent environmental regulations regarding Volatile Organic Compounds (VOCs) are a significant restraint, pushing manufacturers towards the development and adoption of low-VOC or VOC-free coalescing agents. This trend, however, also presents an opportunity for innovation and the introduction of eco-friendly alternatives. Geographically, the Asia Pacific region, led by China and India, is expected to dominate the market due to rapid industrialization, urbanization, and a growing middle-class population driving demand across various end-use applications. North America and Europe remain substantial markets, with a focus on high-performance and sustainable coalescing agent solutions. Key industry players like BASF SE, Dow, and Eastman Chemical Company are actively investing in research and development to offer advanced solutions that meet evolving regulatory and consumer demands.
Coalescing Agents Market Company Market Share
This in-depth report offers a definitive analysis of the global Coalescing Agents Market, providing critical insights for industry stakeholders. Delve into market dynamics, growth drivers, segmentation, key players, and future opportunities. The report covers the historical period from 2019 to 2024, with the base year and estimated year set at 2025, and projects growth through 2033. Discover the strategic imperatives for navigating this evolving landscape and capitalizing on emerging trends in coalescing agents for paints and coatings, coalescing agents for adhesives and sealants, and eco-friendly coalescing agents.
Coalescing Agents Market Market Concentration & Dynamics
The coalescing agents market exhibits a moderate to high concentration, with a significant portion of the market share held by leading chemical manufacturers. Key players like Cargill Incorporated, Synthomer PLC, Celanese Corporation, Dow, and BASF SE leverage robust R&D capabilities and extensive distribution networks to maintain their competitive edge. The innovation ecosystem is characterized by a strong focus on developing low-VOC (Volatile Organic Compound) and sustainable coalescing agents to meet stringent environmental regulations and growing consumer demand for eco-friendly products. Regulatory frameworks, particularly in North America and Europe, are increasingly pushing for safer and more environmentally responsible coalescing agent formulations. Substitute products, such as self-coalescing latex polymers, are emerging but currently face limitations in performance across a wide range of applications compared to traditional coalescing agents. End-user trends indicate a rising preference for water-borne coatings and adhesives, which directly fuels the demand for high-performance coalescing agents. Mergers and acquisitions (M&A) activities are moderate, primarily driven by companies seeking to expand their product portfolios, gain access to new technologies, or strengthen their market presence in specific geographies. For instance, recent M&A deals in the specialty chemicals sector have aimed at consolidating market share and enhancing synergistic capabilities in the coalescing agents industry.
Coalescing Agents Market Industry Insights & Trends
The global coalescing agents market is poised for significant expansion, driven by a confluence of factors including escalating demand from the construction and automotive industries, coupled with increasing urbanization worldwide. The market size was valued at approximately $X Billion in 2025, and is projected to reach an estimated $Y Billion by 2033, exhibiting a Compound Annual Growth Rate (CAGR) of Z% during the forecast period of 2025–2033. Technological disruptions are playing a pivotal role, with continuous innovation in coalescing agent formulations leading to enhanced performance characteristics such as improved film formation, scrub resistance, and adhesion in paints and coatings. The development of non-phthalate coalescing agents and biodegradable coalescing agents is a testament to the industry's commitment to sustainability. Evolving consumer behaviors, particularly the growing awareness of environmental impact and health concerns associated with VOC emissions, are compelling manufacturers to invest heavily in research and development of greener alternatives. This shift is directly impacting the demand for low-VOC and zero-VOC coalescing agents across various applications, including architectural coatings, industrial coatings, and automotive refinish coatings. The increasing adoption of water-borne systems in place of solvent-borne systems further amplifies the need for efficient coalescing agents that can facilitate the formation of continuous and durable films at ambient temperatures. The personal care segment is also witnessing a subtle but growing demand for coalescing agents in formulations requiring film formation and stability. Furthermore, the decoloring applications within the polymer industry are beginning to explore the potential of specialized coalescing agents. The consistent growth in infrastructure development globally, especially in emerging economies, is a primary engine propelling the paints and coatings market, thereby creating a robust demand for coalescing agents.
Key Markets & Segments Leading Coalescing Agents Market
The Paints & Coatings segment is the undisputed leader in the global coalescing agents market, driven by robust demand from the construction, automotive, and industrial sectors. Within this segment, architectural coatings represent the largest application due to continuous urbanization and renovation activities. Economic growth and infrastructure development in regions like Asia Pacific, particularly in countries such as China and India, are significant drivers fueling the dominance of this segment. The growing emphasis on aesthetic appeal and property protection in residential and commercial buildings necessitates the use of high-performance paints and coatings, which in turn boosts the consumption of coalescing agents.
Dominant Application Segment: Paints & Coatings
- Drivers of Dominance:
- Rapid urbanization and infrastructure development globally.
- Increasing demand for durable and aesthetically pleasing surfaces.
- Stringent performance requirements for architectural, industrial, and automotive coatings.
- Growth in the DIY (Do-It-Yourself) market for home improvement.
- Drivers of Dominance:
Geographical Dominance: Asia Pacific is the leading regional market for coalescing agents, owing to its rapidly expanding manufacturing base, significant investments in infrastructure, and a growing middle class with increasing disposable income. China, as the world's largest producer and consumer of chemicals, plays a pivotal role in this regional dominance. The region’s commitment to industrial growth and its large population contribute to sustained demand across various end-use industries.
- Drivers of Regional Dominance (Asia Pacific):
- Massive construction projects and smart city initiatives.
- Expansion of the automotive manufacturing sector.
- Favorable government policies promoting industrialization.
- Growing awareness and adoption of advanced coating technologies.
- Drivers of Regional Dominance (Asia Pacific):
Type Segmentation: While both Hydrophilic and Hydrophobic coalescing agents find applications, the demand for both is influenced by specific formulation requirements and performance needs. Hydrophobic coalescing agents are increasingly preferred in applications requiring superior water resistance and durability, such as exterior coatings. Hydrophilic coalescing agents are often used in interior coatings and applications where better compatibility with waterborne systems is crucial.
Other Significant Segments: The Adhesives & Sealants segment is also a substantial contributor to the market's growth, driven by its use in construction, automotive assembly, and packaging. The Inks segment, particularly for printing applications, is another key area of consumption, with a growing trend towards water-based inks.
Coalescing Agents Market Product Developments
Innovation in the coalescing agents market is primarily focused on developing low-VOC and environmentally friendly alternatives. Manufacturers are introducing novel coalescing agents that offer superior film formation properties, enhanced durability, and excellent compatibility with waterborne polymer systems. Product developments are also targeting specific performance enhancements, such as improved coalescent efficiency at lower temperatures, reduced odor, and better resistance to chemicals and weathering. The market relevance of these developments lies in their ability to help formulators meet increasingly stringent environmental regulations and consumer demands for sustainable products, thereby offering a competitive edge.
Challenges in the Coalescing Agents Market Market
The coalescing agents market faces several challenges that can impact its growth trajectory. Regulatory hurdles, particularly concerning VOC emissions and the classification of certain chemical substances, can lead to reformulation costs and market access limitations. Supply chain disruptions, influenced by raw material availability and geopolitical factors, can affect production costs and product availability. Intense competitive pressures from both established players and emerging niche manufacturers drive down profit margins. Furthermore, the development of innovative self-coalescing polymers presents a potential substitute that could reduce the overall demand for traditional coalescing agents in certain applications.
Forces Driving Coalescing Agents Market Growth
Several key growth drivers are propelling the coalescing agents market. The escalating demand for paints and coatings in the construction and automotive industries, fueled by global urbanization and infrastructure development, is a primary catalyst. The increasing preference for water-borne formulations over solvent-borne systems, driven by environmental regulations and health concerns, directly boosts the need for efficient coalescing agents. Technological advancements leading to the development of high-performance, low-VOC coalescing agents are also significant drivers. Economic growth in emerging economies further underpins market expansion by increasing disposable incomes and driving demand for consumer goods and infrastructure improvements.
Challenges in the Coalescing Agents Market Market
Long-term growth catalysts in the coalescing agents market are rooted in sustained innovation and strategic market expansion. The continuous development of sustainable and bio-based coalescing agents will cater to evolving environmental consciousness and regulatory landscapes. Strategic partnerships and collaborations between chemical manufacturers and end-users can foster the development of tailor-made solutions for specific application needs, thereby creating new market niches. Expansion into emerging economies with rapidly growing construction and manufacturing sectors offers significant untapped potential. Furthermore, the increasing sophistication of polymer technologies will necessitate advanced coalescing agents that can optimize performance in next-generation formulations.
Emerging Opportunities in Coalescing Agents Market
Emerging opportunities in the coalescing agents market lie in the development and adoption of advanced, high-performance coalescing agents that meet stringent environmental standards. The growing trend towards sustainable and bio-based solutions presents a significant opportunity for manufacturers to innovate and capture market share. New applications in sectors like renewable energy (e.g., coatings for solar panels) and advanced electronics are also emerging. Furthermore, the increasing demand for specialized coatings with enhanced properties, such as anti-microbial or self-healing capabilities, will create opportunities for novel coalescing agent formulations. The digitalization of supply chains and customer engagement platforms can also unlock new avenues for market penetration and operational efficiency.
Leading Players in the Coalescing Agents Market Sector
- Cargill Incorporated
- Synthomer PLC
- Cristol
- Celanese Corporation
- Stepan Company
- Runtai Chemical Co Ltd
- BASF SE
- Arkema Group
- Rudolf GmbH
- Dow
- Eastman Chemical Company
Key Milestones in Coalescing Agents Market Industry
- 2019: Increased regulatory focus on VOC reduction globally, driving research into low-VOC coalescing agents.
- 2020: Emergence of COVID-19 pandemic leads to temporary disruptions in supply chains and shifts in end-user demand.
- 2021: Significant investment in R&D for sustainable and bio-based coalescing agent alternatives.
- 2022: Growing adoption of water-borne coatings in the automotive refinish sector gains momentum.
- 2023: Introduction of novel coalescing agents with improved coalescent efficiency at lower temperatures.
- 2024: Increased M&A activities aimed at portfolio expansion and technological integration in the specialty chemicals sector.
Strategic Outlook for Coalescing Agents Market Market
The strategic outlook for the coalescing agents market is characterized by a strong emphasis on innovation, sustainability, and market diversification. Growth accelerators will include continued investment in research and development to produce high-performance, eco-friendly coalescing agents that meet evolving regulatory demands and consumer preferences. Strategic partnerships with formulators and end-users will be crucial for developing tailored solutions and expanding into niche applications. Furthermore, tapping into the growth potential of emerging economies through localized production and distribution networks will be key to capturing a larger market share and ensuring long-term market relevance and profitability.
Coalescing Agents Market Segmentation
-
1. Type
- 1.1. Hydrophilic
- 1.2. Hydrophobic
-
2. Application
- 2.1. Adhesives & Sealants
- 2.2. Paints & Coatings
- 2.3. Inks
- 2.4. Personal Care
- 2.5. Other Applications (Decoloring, Polymer, etc.)
Coalescing Agents Market Segmentation By Geography
-
1. Asia Pacific
- 1.1. China
- 1.2. India
- 1.3. Japan
- 1.4. South Korea
- 1.5. Malaysia
- 1.6. Thailand
- 1.7. Indonesia
- 1.8. Vietnam
- 1.9. Rest of Asia Pacific
-
2. North America
- 2.1. United States
- 2.2. Canada
- 2.3. Mexico
-
3. Europe
- 3.1. Germany
- 3.2. United Kingdom
- 3.3. Italy
- 3.4. France
- 3.5. Spain
- 3.6. NORDIC Countries
- 3.7. Turkey
- 3.8. Russia
- 3.9. Rest of Europe
-
4. South America
- 4.1. Brazil
- 4.2. Argentina
- 4.3. Colombia
- 4.4. Rest of South America
-
5. Middle East and Africa
- 5.1. Saudi Arabia
- 5.2. South Africa
- 5.3. Nigeria
- 5.4. Qatar
- 5.5. Egypt
- 5.6. United Arab Emirates
- 5.7. Rest of Middle East and Africa
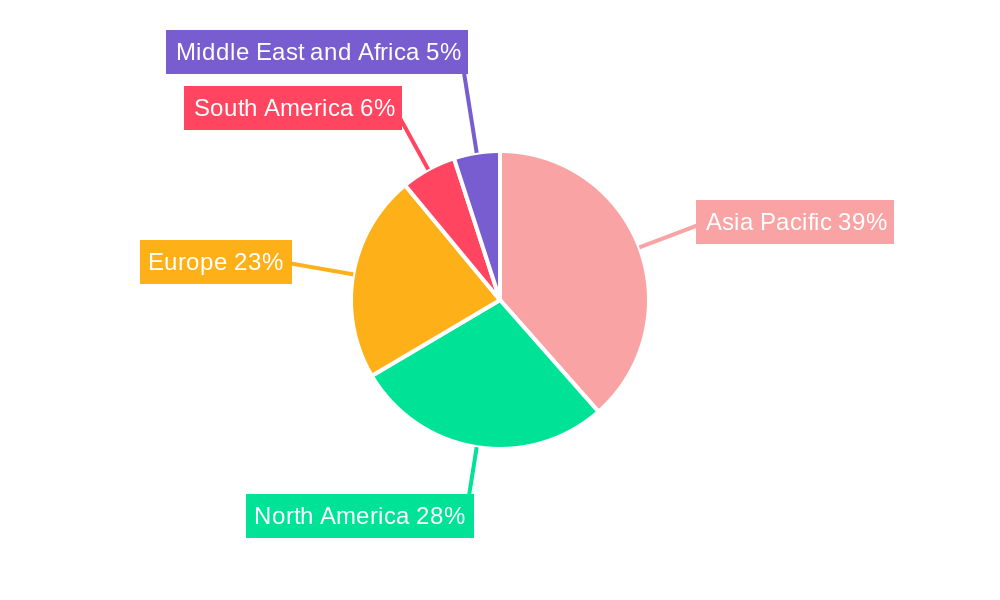
Coalescing Agents Market Regional Market Share
Geographic Coverage of Coalescing Agents Market
Coalescing Agents Market REPORT HIGHLIGHTS
| Aspects | Details |
|---|---|
| Study Period | 2020-2034 |
| Base Year | 2025 |
| Estimated Year | 2026 |
| Forecast Period | 2026-2034 |
| Historical Period | 2020-2025 |
| Growth Rate | CAGR of 4.96% from 2020-2034 |
| Segmentation |
|
Table of Contents
- 1. Introduction
- 1.1. Research Scope
- 1.2. Market Segmentation
- 1.3. Research Objective
- 1.4. Definitions and Assumptions
- 2. Executive Summary
- 2.1. Market Snapshot
- 3. Market Dynamics
- 3.1. Market Drivers
- 3.2. Market Restrains
- 3.3. Market Trends
- 3.4. Market Opportunities
- 4. Market Factor Analysis
- 4.1. Porters Five Forces
- 4.1.1. Bargaining Power of Suppliers
- 4.1.2. Bargaining Power of Buyers
- 4.1.3. Threat of New Entrants
- 4.1.4. Threat of Substitutes
- 4.1.5. Competitive Rivalry
- 4.2. PESTEL analysis
- 4.3. BCG Analysis
- 4.3.1. Stars (High Growth, High Market Share)
- 4.3.2. Cash Cows (Low Growth, High Market Share)
- 4.3.3. Question Mark (High Growth, Low Market Share)
- 4.3.4. Dogs (Low Growth, Low Market Share)
- 4.4. Ansoff Matrix Analysis
- 4.5. Supply Chain Analysis
- 4.6. Regulatory Landscape
- 4.7. Current Market Potential and Opportunity Assessment (TAM–SAM–SOM Framework)
- 4.8. MSR Analyst Note
- 4.1. Porters Five Forces
- 5. Market Analysis, Insights and Forecast 2021-2033
- 5.1. Market Analysis, Insights and Forecast - by Type
- 5.1.1. Hydrophilic
- 5.1.2. Hydrophobic
- 5.2. Market Analysis, Insights and Forecast - by Application
- 5.2.1. Adhesives & Sealants
- 5.2.2. Paints & Coatings
- 5.2.3. Inks
- 5.2.4. Personal Care
- 5.2.5. Other Applications (Decoloring, Polymer, etc.)
- 5.3. Market Analysis, Insights and Forecast - by Region
- 5.3.1. Asia Pacific
- 5.3.2. North America
- 5.3.3. Europe
- 5.3.4. South America
- 5.3.5. Middle East and Africa
- 5.1. Market Analysis, Insights and Forecast - by Type
- 6. Global Coalescing Agents Market Analysis, Insights and Forecast, 2021-2033
- 6.1. Market Analysis, Insights and Forecast - by Type
- 6.1.1. Hydrophilic
- 6.1.2. Hydrophobic
- 6.2. Market Analysis, Insights and Forecast - by Application
- 6.2.1. Adhesives & Sealants
- 6.2.2. Paints & Coatings
- 6.2.3. Inks
- 6.2.4. Personal Care
- 6.2.5. Other Applications (Decoloring, Polymer, etc.)
- 6.1. Market Analysis, Insights and Forecast - by Type
- 7. Asia Pacific Coalescing Agents Market Analysis, Insights and Forecast, 2020-2032
- 7.1. Market Analysis, Insights and Forecast - by Type
- 7.1.1. Hydrophilic
- 7.1.2. Hydrophobic
- 7.2. Market Analysis, Insights and Forecast - by Application
- 7.2.1. Adhesives & Sealants
- 7.2.2. Paints & Coatings
- 7.2.3. Inks
- 7.2.4. Personal Care
- 7.2.5. Other Applications (Decoloring, Polymer, etc.)
- 7.1. Market Analysis, Insights and Forecast - by Type
- 8. North America Coalescing Agents Market Analysis, Insights and Forecast, 2020-2032
- 8.1. Market Analysis, Insights and Forecast - by Type
- 8.1.1. Hydrophilic
- 8.1.2. Hydrophobic
- 8.2. Market Analysis, Insights and Forecast - by Application
- 8.2.1. Adhesives & Sealants
- 8.2.2. Paints & Coatings
- 8.2.3. Inks
- 8.2.4. Personal Care
- 8.2.5. Other Applications (Decoloring, Polymer, etc.)
- 8.1. Market Analysis, Insights and Forecast - by Type
- 9. Europe Coalescing Agents Market Analysis, Insights and Forecast, 2020-2032
- 9.1. Market Analysis, Insights and Forecast - by Type
- 9.1.1. Hydrophilic
- 9.1.2. Hydrophobic
- 9.2. Market Analysis, Insights and Forecast - by Application
- 9.2.1. Adhesives & Sealants
- 9.2.2. Paints & Coatings
- 9.2.3. Inks
- 9.2.4. Personal Care
- 9.2.5. Other Applications (Decoloring, Polymer, etc.)
- 9.1. Market Analysis, Insights and Forecast - by Type
- 10. South America Coalescing Agents Market Analysis, Insights and Forecast, 2020-2032
- 10.1. Market Analysis, Insights and Forecast - by Type
- 10.1.1. Hydrophilic
- 10.1.2. Hydrophobic
- 10.2. Market Analysis, Insights and Forecast - by Application
- 10.2.1. Adhesives & Sealants
- 10.2.2. Paints & Coatings
- 10.2.3. Inks
- 10.2.4. Personal Care
- 10.2.5. Other Applications (Decoloring, Polymer, etc.)
- 10.1. Market Analysis, Insights and Forecast - by Type
- 11. Middle East and Africa Coalescing Agents Market Analysis, Insights and Forecast, 2020-2032
- 11.1. Market Analysis, Insights and Forecast - by Type
- 11.1.1. Hydrophilic
- 11.1.2. Hydrophobic
- 11.2. Market Analysis, Insights and Forecast - by Application
- 11.2.1. Adhesives & Sealants
- 11.2.2. Paints & Coatings
- 11.2.3. Inks
- 11.2.4. Personal Care
- 11.2.5. Other Applications (Decoloring, Polymer, etc.)
- 11.1. Market Analysis, Insights and Forecast - by Type
- 12. Competitive Analysis
- 12.1. Company Profiles
- 12.1.1 Cargill Incorporated
- 12.1.1.1. Company Overview
- 12.1.1.2. Products
- 12.1.1.3. Company Financials
- 12.1.1.4. SWOT Analysis
- 12.1.2 Synthomer PLC
- 12.1.2.1. Company Overview
- 12.1.2.2. Products
- 12.1.2.3. Company Financials
- 12.1.2.4. SWOT Analysis
- 12.1.3 Cristol
- 12.1.3.1. Company Overview
- 12.1.3.2. Products
- 12.1.3.3. Company Financials
- 12.1.3.4. SWOT Analysis
- 12.1.4 Celanese Corporation
- 12.1.4.1. Company Overview
- 12.1.4.2. Products
- 12.1.4.3. Company Financials
- 12.1.4.4. SWOT Analysis
- 12.1.5 Stepan Company
- 12.1.5.1. Company Overview
- 12.1.5.2. Products
- 12.1.5.3. Company Financials
- 12.1.5.4. SWOT Analysis
- 12.1.6 Runtai Chemical Co Ltd
- 12.1.6.1. Company Overview
- 12.1.6.2. Products
- 12.1.6.3. Company Financials
- 12.1.6.4. SWOT Analysis
- 12.1.7 BASF SE
- 12.1.7.1. Company Overview
- 12.1.7.2. Products
- 12.1.7.3. Company Financials
- 12.1.7.4. SWOT Analysis
- 12.1.8 Arkema Group
- 12.1.8.1. Company Overview
- 12.1.8.2. Products
- 12.1.8.3. Company Financials
- 12.1.8.4. SWOT Analysis
- 12.1.9 Rudolf GmbH
- 12.1.9.1. Company Overview
- 12.1.9.2. Products
- 12.1.9.3. Company Financials
- 12.1.9.4. SWOT Analysis
- 12.1.10 Dow
- 12.1.10.1. Company Overview
- 12.1.10.2. Products
- 12.1.10.3. Company Financials
- 12.1.10.4. SWOT Analysis
- 12.1.11 Eastman Chemical Company
- 12.1.11.1. Company Overview
- 12.1.11.2. Products
- 12.1.11.3. Company Financials
- 12.1.11.4. SWOT Analysis
- 12.1.1 Cargill Incorporated
- 12.2. Market Entropy
- 12.2.1 Company's Key Areas Served
- 12.2.2 Recent Developments
- 12.3. Company Market Share Analysis 2025
- 12.3.1 Top 5 Companies Market Share Analysis
- 12.3.2 Top 3 Companies Market Share Analysis
- 12.4. List of Potential Customers
- 13. Research Methodology
List of Figures
- Figure 1: Global Coalescing Agents Market Revenue Breakdown (Million, %) by Region 2025 & 2033
- Figure 2: Global Coalescing Agents Market Volume Breakdown (K Tons, %) by Region 2025 & 2033
- Figure 3: Asia Pacific Coalescing Agents Market Revenue (Million), by Type 2025 & 2033
- Figure 4: Asia Pacific Coalescing Agents Market Volume (K Tons), by Type 2025 & 2033
- Figure 5: Asia Pacific Coalescing Agents Market Revenue Share (%), by Type 2025 & 2033
- Figure 6: Asia Pacific Coalescing Agents Market Volume Share (%), by Type 2025 & 2033
- Figure 7: Asia Pacific Coalescing Agents Market Revenue (Million), by Application 2025 & 2033
- Figure 8: Asia Pacific Coalescing Agents Market Volume (K Tons), by Application 2025 & 2033
- Figure 9: Asia Pacific Coalescing Agents Market Revenue Share (%), by Application 2025 & 2033
- Figure 10: Asia Pacific Coalescing Agents Market Volume Share (%), by Application 2025 & 2033
- Figure 11: Asia Pacific Coalescing Agents Market Revenue (Million), by Country 2025 & 2033
- Figure 12: Asia Pacific Coalescing Agents Market Volume (K Tons), by Country 2025 & 2033
- Figure 13: Asia Pacific Coalescing Agents Market Revenue Share (%), by Country 2025 & 2033
- Figure 14: Asia Pacific Coalescing Agents Market Volume Share (%), by Country 2025 & 2033
- Figure 15: North America Coalescing Agents Market Revenue (Million), by Type 2025 & 2033
- Figure 16: North America Coalescing Agents Market Volume (K Tons), by Type 2025 & 2033
- Figure 17: North America Coalescing Agents Market Revenue Share (%), by Type 2025 & 2033
- Figure 18: North America Coalescing Agents Market Volume Share (%), by Type 2025 & 2033
- Figure 19: North America Coalescing Agents Market Revenue (Million), by Application 2025 & 2033
- Figure 20: North America Coalescing Agents Market Volume (K Tons), by Application 2025 & 2033
- Figure 21: North America Coalescing Agents Market Revenue Share (%), by Application 2025 & 2033
- Figure 22: North America Coalescing Agents Market Volume Share (%), by Application 2025 & 2033
- Figure 23: North America Coalescing Agents Market Revenue (Million), by Country 2025 & 2033
- Figure 24: North America Coalescing Agents Market Volume (K Tons), by Country 2025 & 2033
- Figure 25: North America Coalescing Agents Market Revenue Share (%), by Country 2025 & 2033
- Figure 26: North America Coalescing Agents Market Volume Share (%), by Country 2025 & 2033
- Figure 27: Europe Coalescing Agents Market Revenue (Million), by Type 2025 & 2033
- Figure 28: Europe Coalescing Agents Market Volume (K Tons), by Type 2025 & 2033
- Figure 29: Europe Coalescing Agents Market Revenue Share (%), by Type 2025 & 2033
- Figure 30: Europe Coalescing Agents Market Volume Share (%), by Type 2025 & 2033
- Figure 31: Europe Coalescing Agents Market Revenue (Million), by Application 2025 & 2033
- Figure 32: Europe Coalescing Agents Market Volume (K Tons), by Application 2025 & 2033
- Figure 33: Europe Coalescing Agents Market Revenue Share (%), by Application 2025 & 2033
- Figure 34: Europe Coalescing Agents Market Volume Share (%), by Application 2025 & 2033
- Figure 35: Europe Coalescing Agents Market Revenue (Million), by Country 2025 & 2033
- Figure 36: Europe Coalescing Agents Market Volume (K Tons), by Country 2025 & 2033
- Figure 37: Europe Coalescing Agents Market Revenue Share (%), by Country 2025 & 2033
- Figure 38: Europe Coalescing Agents Market Volume Share (%), by Country 2025 & 2033
- Figure 39: South America Coalescing Agents Market Revenue (Million), by Type 2025 & 2033
- Figure 40: South America Coalescing Agents Market Volume (K Tons), by Type 2025 & 2033
- Figure 41: South America Coalescing Agents Market Revenue Share (%), by Type 2025 & 2033
- Figure 42: South America Coalescing Agents Market Volume Share (%), by Type 2025 & 2033
- Figure 43: South America Coalescing Agents Market Revenue (Million), by Application 2025 & 2033
- Figure 44: South America Coalescing Agents Market Volume (K Tons), by Application 2025 & 2033
- Figure 45: South America Coalescing Agents Market Revenue Share (%), by Application 2025 & 2033
- Figure 46: South America Coalescing Agents Market Volume Share (%), by Application 2025 & 2033
- Figure 47: South America Coalescing Agents Market Revenue (Million), by Country 2025 & 2033
- Figure 48: South America Coalescing Agents Market Volume (K Tons), by Country 2025 & 2033
- Figure 49: South America Coalescing Agents Market Revenue Share (%), by Country 2025 & 2033
- Figure 50: South America Coalescing Agents Market Volume Share (%), by Country 2025 & 2033
- Figure 51: Middle East and Africa Coalescing Agents Market Revenue (Million), by Type 2025 & 2033
- Figure 52: Middle East and Africa Coalescing Agents Market Volume (K Tons), by Type 2025 & 2033
- Figure 53: Middle East and Africa Coalescing Agents Market Revenue Share (%), by Type 2025 & 2033
- Figure 54: Middle East and Africa Coalescing Agents Market Volume Share (%), by Type 2025 & 2033
- Figure 55: Middle East and Africa Coalescing Agents Market Revenue (Million), by Application 2025 & 2033
- Figure 56: Middle East and Africa Coalescing Agents Market Volume (K Tons), by Application 2025 & 2033
- Figure 57: Middle East and Africa Coalescing Agents Market Revenue Share (%), by Application 2025 & 2033
- Figure 58: Middle East and Africa Coalescing Agents Market Volume Share (%), by Application 2025 & 2033
- Figure 59: Middle East and Africa Coalescing Agents Market Revenue (Million), by Country 2025 & 2033
- Figure 60: Middle East and Africa Coalescing Agents Market Volume (K Tons), by Country 2025 & 2033
- Figure 61: Middle East and Africa Coalescing Agents Market Revenue Share (%), by Country 2025 & 2033
- Figure 62: Middle East and Africa Coalescing Agents Market Volume Share (%), by Country 2025 & 2033
List of Tables
- Table 1: Global Coalescing Agents Market Revenue Million Forecast, by Type 2020 & 2033
- Table 2: Global Coalescing Agents Market Volume K Tons Forecast, by Type 2020 & 2033
- Table 3: Global Coalescing Agents Market Revenue Million Forecast, by Application 2020 & 2033
- Table 4: Global Coalescing Agents Market Volume K Tons Forecast, by Application 2020 & 2033
- Table 5: Global Coalescing Agents Market Revenue Million Forecast, by Region 2020 & 2033
- Table 6: Global Coalescing Agents Market Volume K Tons Forecast, by Region 2020 & 2033
- Table 7: Global Coalescing Agents Market Revenue Million Forecast, by Type 2020 & 2033
- Table 8: Global Coalescing Agents Market Volume K Tons Forecast, by Type 2020 & 2033
- Table 9: Global Coalescing Agents Market Revenue Million Forecast, by Application 2020 & 2033
- Table 10: Global Coalescing Agents Market Volume K Tons Forecast, by Application 2020 & 2033
- Table 11: Global Coalescing Agents Market Revenue Million Forecast, by Country 2020 & 2033
- Table 12: Global Coalescing Agents Market Volume K Tons Forecast, by Country 2020 & 2033
- Table 13: China Coalescing Agents Market Revenue (Million) Forecast, by Application 2020 & 2033
- Table 14: China Coalescing Agents Market Volume (K Tons) Forecast, by Application 2020 & 2033
- Table 15: India Coalescing Agents Market Revenue (Million) Forecast, by Application 2020 & 2033
- Table 16: India Coalescing Agents Market Volume (K Tons) Forecast, by Application 2020 & 2033
- Table 17: Japan Coalescing Agents Market Revenue (Million) Forecast, by Application 2020 & 2033
- Table 18: Japan Coalescing Agents Market Volume (K Tons) Forecast, by Application 2020 & 2033
- Table 19: South Korea Coalescing Agents Market Revenue (Million) Forecast, by Application 2020 & 2033
- Table 20: South Korea Coalescing Agents Market Volume (K Tons) Forecast, by Application 2020 & 2033
- Table 21: Malaysia Coalescing Agents Market Revenue (Million) Forecast, by Application 2020 & 2033
- Table 22: Malaysia Coalescing Agents Market Volume (K Tons) Forecast, by Application 2020 & 2033
- Table 23: Thailand Coalescing Agents Market Revenue (Million) Forecast, by Application 2020 & 2033
- Table 24: Thailand Coalescing Agents Market Volume (K Tons) Forecast, by Application 2020 & 2033
- Table 25: Indonesia Coalescing Agents Market Revenue (Million) Forecast, by Application 2020 & 2033
- Table 26: Indonesia Coalescing Agents Market Volume (K Tons) Forecast, by Application 2020 & 2033
- Table 27: Vietnam Coalescing Agents Market Revenue (Million) Forecast, by Application 2020 & 2033
- Table 28: Vietnam Coalescing Agents Market Volume (K Tons) Forecast, by Application 2020 & 2033
- Table 29: Rest of Asia Pacific Coalescing Agents Market Revenue (Million) Forecast, by Application 2020 & 2033
- Table 30: Rest of Asia Pacific Coalescing Agents Market Volume (K Tons) Forecast, by Application 2020 & 2033
- Table 31: Global Coalescing Agents Market Revenue Million Forecast, by Type 2020 & 2033
- Table 32: Global Coalescing Agents Market Volume K Tons Forecast, by Type 2020 & 2033
- Table 33: Global Coalescing Agents Market Revenue Million Forecast, by Application 2020 & 2033
- Table 34: Global Coalescing Agents Market Volume K Tons Forecast, by Application 2020 & 2033
- Table 35: Global Coalescing Agents Market Revenue Million Forecast, by Country 2020 & 2033
- Table 36: Global Coalescing Agents Market Volume K Tons Forecast, by Country 2020 & 2033
- Table 37: United States Coalescing Agents Market Revenue (Million) Forecast, by Application 2020 & 2033
- Table 38: United States Coalescing Agents Market Volume (K Tons) Forecast, by Application 2020 & 2033
- Table 39: Canada Coalescing Agents Market Revenue (Million) Forecast, by Application 2020 & 2033
- Table 40: Canada Coalescing Agents Market Volume (K Tons) Forecast, by Application 2020 & 2033
- Table 41: Mexico Coalescing Agents Market Revenue (Million) Forecast, by Application 2020 & 2033
- Table 42: Mexico Coalescing Agents Market Volume (K Tons) Forecast, by Application 2020 & 2033
- Table 43: Global Coalescing Agents Market Revenue Million Forecast, by Type 2020 & 2033
- Table 44: Global Coalescing Agents Market Volume K Tons Forecast, by Type 2020 & 2033
- Table 45: Global Coalescing Agents Market Revenue Million Forecast, by Application 2020 & 2033
- Table 46: Global Coalescing Agents Market Volume K Tons Forecast, by Application 2020 & 2033
- Table 47: Global Coalescing Agents Market Revenue Million Forecast, by Country 2020 & 2033
- Table 48: Global Coalescing Agents Market Volume K Tons Forecast, by Country 2020 & 2033
- Table 49: Germany Coalescing Agents Market Revenue (Million) Forecast, by Application 2020 & 2033
- Table 50: Germany Coalescing Agents Market Volume (K Tons) Forecast, by Application 2020 & 2033
- Table 51: United Kingdom Coalescing Agents Market Revenue (Million) Forecast, by Application 2020 & 2033
- Table 52: United Kingdom Coalescing Agents Market Volume (K Tons) Forecast, by Application 2020 & 2033
- Table 53: Italy Coalescing Agents Market Revenue (Million) Forecast, by Application 2020 & 2033
- Table 54: Italy Coalescing Agents Market Volume (K Tons) Forecast, by Application 2020 & 2033
- Table 55: France Coalescing Agents Market Revenue (Million) Forecast, by Application 2020 & 2033
- Table 56: France Coalescing Agents Market Volume (K Tons) Forecast, by Application 2020 & 2033
- Table 57: Spain Coalescing Agents Market Revenue (Million) Forecast, by Application 2020 & 2033
- Table 58: Spain Coalescing Agents Market Volume (K Tons) Forecast, by Application 2020 & 2033
- Table 59: NORDIC Countries Coalescing Agents Market Revenue (Million) Forecast, by Application 2020 & 2033
- Table 60: NORDIC Countries Coalescing Agents Market Volume (K Tons) Forecast, by Application 2020 & 2033
- Table 61: Turkey Coalescing Agents Market Revenue (Million) Forecast, by Application 2020 & 2033
- Table 62: Turkey Coalescing Agents Market Volume (K Tons) Forecast, by Application 2020 & 2033
- Table 63: Russia Coalescing Agents Market Revenue (Million) Forecast, by Application 2020 & 2033
- Table 64: Russia Coalescing Agents Market Volume (K Tons) Forecast, by Application 2020 & 2033
- Table 65: Rest of Europe Coalescing Agents Market Revenue (Million) Forecast, by Application 2020 & 2033
- Table 66: Rest of Europe Coalescing Agents Market Volume (K Tons) Forecast, by Application 2020 & 2033
- Table 67: Global Coalescing Agents Market Revenue Million Forecast, by Type 2020 & 2033
- Table 68: Global Coalescing Agents Market Volume K Tons Forecast, by Type 2020 & 2033
- Table 69: Global Coalescing Agents Market Revenue Million Forecast, by Application 2020 & 2033
- Table 70: Global Coalescing Agents Market Volume K Tons Forecast, by Application 2020 & 2033
- Table 71: Global Coalescing Agents Market Revenue Million Forecast, by Country 2020 & 2033
- Table 72: Global Coalescing Agents Market Volume K Tons Forecast, by Country 2020 & 2033
- Table 73: Brazil Coalescing Agents Market Revenue (Million) Forecast, by Application 2020 & 2033
- Table 74: Brazil Coalescing Agents Market Volume (K Tons) Forecast, by Application 2020 & 2033
- Table 75: Argentina Coalescing Agents Market Revenue (Million) Forecast, by Application 2020 & 2033
- Table 76: Argentina Coalescing Agents Market Volume (K Tons) Forecast, by Application 2020 & 2033
- Table 77: Colombia Coalescing Agents Market Revenue (Million) Forecast, by Application 2020 & 2033
- Table 78: Colombia Coalescing Agents Market Volume (K Tons) Forecast, by Application 2020 & 2033
- Table 79: Rest of South America Coalescing Agents Market Revenue (Million) Forecast, by Application 2020 & 2033
- Table 80: Rest of South America Coalescing Agents Market Volume (K Tons) Forecast, by Application 2020 & 2033
- Table 81: Global Coalescing Agents Market Revenue Million Forecast, by Type 2020 & 2033
- Table 82: Global Coalescing Agents Market Volume K Tons Forecast, by Type 2020 & 2033
- Table 83: Global Coalescing Agents Market Revenue Million Forecast, by Application 2020 & 2033
- Table 84: Global Coalescing Agents Market Volume K Tons Forecast, by Application 2020 & 2033
- Table 85: Global Coalescing Agents Market Revenue Million Forecast, by Country 2020 & 2033
- Table 86: Global Coalescing Agents Market Volume K Tons Forecast, by Country 2020 & 2033
- Table 87: Saudi Arabia Coalescing Agents Market Revenue (Million) Forecast, by Application 2020 & 2033
- Table 88: Saudi Arabia Coalescing Agents Market Volume (K Tons) Forecast, by Application 2020 & 2033
- Table 89: South Africa Coalescing Agents Market Revenue (Million) Forecast, by Application 2020 & 2033
- Table 90: South Africa Coalescing Agents Market Volume (K Tons) Forecast, by Application 2020 & 2033
- Table 91: Nigeria Coalescing Agents Market Revenue (Million) Forecast, by Application 2020 & 2033
- Table 92: Nigeria Coalescing Agents Market Volume (K Tons) Forecast, by Application 2020 & 2033
- Table 93: Qatar Coalescing Agents Market Revenue (Million) Forecast, by Application 2020 & 2033
- Table 94: Qatar Coalescing Agents Market Volume (K Tons) Forecast, by Application 2020 & 2033
- Table 95: Egypt Coalescing Agents Market Revenue (Million) Forecast, by Application 2020 & 2033
- Table 96: Egypt Coalescing Agents Market Volume (K Tons) Forecast, by Application 2020 & 2033
- Table 97: United Arab Emirates Coalescing Agents Market Revenue (Million) Forecast, by Application 2020 & 2033
- Table 98: United Arab Emirates Coalescing Agents Market Volume (K Tons) Forecast, by Application 2020 & 2033
- Table 99: Rest of Middle East and Africa Coalescing Agents Market Revenue (Million) Forecast, by Application 2020 & 2033
- Table 100: Rest of Middle East and Africa Coalescing Agents Market Volume (K Tons) Forecast, by Application 2020 & 2033
Frequently Asked Questions
1. What is the projected Compound Annual Growth Rate (CAGR) of the Coalescing Agents Market?
The projected CAGR is approximately 4.96%.
2. Which companies are prominent players in the Coalescing Agents Market?
Key companies in the market include Cargill Incorporated, Synthomer PLC, Cristol, Celanese Corporation, Stepan Company, Runtai Chemical Co Ltd, BASF SE, Arkema Group, Rudolf GmbH, Dow, Eastman Chemical Company.
3. What are the main segments of the Coalescing Agents Market?
The market segments include Type, Application.
4. Can you provide details about the market size?
The market size is estimated to be USD 1.12 Million as of 2022.
5. What are some drivers contributing to market growth?
Increasing Usage in Personal Care Items; Rising Demand for Architectural and Industrial Coatings in Asia; Other Drivers.
6. What are the notable trends driving market growth?
Increasing Demand from Paints and Coatings Segment.
7. Are there any restraints impacting market growth?
Stringent Environmemtal Regulations; Other Restraints.
8. Can you provide examples of recent developments in the market?
N/A
9. What pricing options are available for accessing the report?
Pricing options include single-user, multi-user, and enterprise licenses priced at USD 4750, USD 5250, and USD 8750 respectively.
10. Is the market size provided in terms of value or volume?
The market size is provided in terms of value, measured in Million and volume, measured in K Tons.
11. Are there any specific market keywords associated with the report?
Yes, the market keyword associated with the report is "Coalescing Agents Market," which aids in identifying and referencing the specific market segment covered.
12. How do I determine which pricing option suits my needs best?
The pricing options vary based on user requirements and access needs. Individual users may opt for single-user licenses, while businesses requiring broader access may choose multi-user or enterprise licenses for cost-effective access to the report.
13. Are there any additional resources or data provided in the Coalescing Agents Market report?
While the report offers comprehensive insights, it's advisable to review the specific contents or supplementary materials provided to ascertain if additional resources or data are available.
14. How can I stay updated on further developments or reports in the Coalescing Agents Market?
To stay informed about further developments, trends, and reports in the Coalescing Agents Market, consider subscribing to industry newsletters, following relevant companies and organizations, or regularly checking reputable industry news sources and publications.
Methodology
Step 1 - Identification of Relevant Samples Size from Population Database


Step 2 - Approaches for Defining Global Market Size (Value, Volume* & Price*)

Note*: In applicable scenarios
Step 3 - Data Sources
Primary Research
- Web Analytics
- Survey Reports
- Research Institute
- Latest Research Reports
- Opinion Leaders
Secondary Research
- Annual Reports
- White Paper
- Latest Press Release
- Industry Association
- Paid Database
- Investor Presentations

Step 4 - Data Triangulation
Involves using different sources of information in order to increase the validity of a study
These sources are likely to be stakeholders in a program - participants, other researchers, program staff, other community members, and so on.
Then we put all data in single framework & apply various statistical tools to find out the dynamic on the market.
During the analysis stage, feedback from the stakeholder groups would be compared to determine areas of agreement as well as areas of divergence