

Key Insights
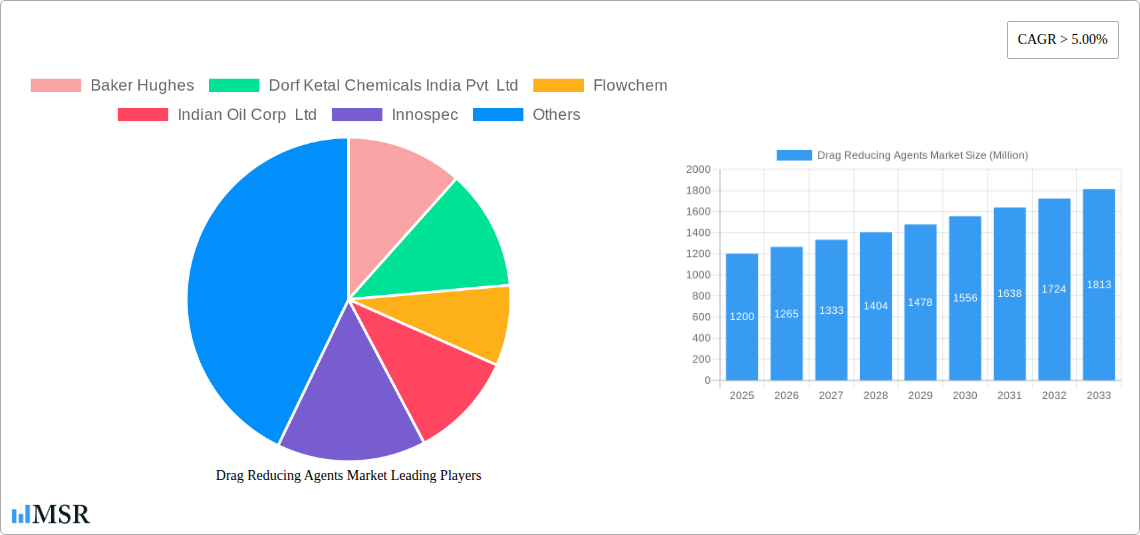
Drag Reducing Agents Market Market Size (In Million)
Drag Reducing Agents Market Market Concentration & Dynamics
The global drag reducing agents market exhibits a moderate level of concentration, characterized by a blend of established multinational corporations and emerging regional players. Innovation ecosystems are robust, with significant investments in research and development focused on enhancing DRA efficacy and environmental sustainability. Regulatory frameworks, while evolving, are largely supportive of DRA adoption due to their proven ability to improve pipeline safety and operational efficiency, especially within the oil and gas industry. Substitute products are limited, with mechanical solutions often proving less cost-effective and more disruptive. End-user trends highlight a growing demand for increased pipeline throughput, reduced operational costs, and compliance with stringent environmental standards. Mergers and acquisition (M&A) activities are observed as companies seek to expand their product portfolios, geographical reach, and technological capabilities. For instance, the acquisition of Quest Integrity by Baker Hughes underscores the industry's focus on integrated asset management solutions. The market anticipates approximately 15-20 strategic M&A deals within the forecast period, indicating a consolidation trend. While precise market share data varies by segment and region, leading players are estimated to hold significant portions of their respective niches.
- Key Drivers of Market Dynamics:
- Increasing demand for crude oil and refined products.
- Growing need for pipeline infrastructure expansion and optimization.
- Focus on reducing energy consumption and operational costs.
- Stringent environmental regulations promoting efficient fluid transport.
Drag Reducing Agents Market Industry Insights & Trends
The drag reducing agents market is experiencing substantial growth, driven by the imperative to enhance the efficiency of fluid transportation across various industries, most notably oil and gas. The estimated market size for 2025 is projected to be around USD 950 Million, with a compelling Compound Annual Growth Rate (CAGR) of approximately 5.8% projected from 2025 to 2033. This upward trajectory is fueled by the ever-increasing global demand for energy resources and the subsequent expansion and optimization of pipeline networks. Technological disruptions are at the forefront, with continuous innovation in polymer science leading to the development of more effective and environmentally friendly DRA formulations. These advancements are crucial for handling increasingly challenging fluid compositions, such as heavy crudes and multiphase fluids, which traditionally present significant flow assurance issues. Evolving consumer behaviors, particularly in the industrial sector, are leaning towards sustainable and cost-efficient solutions. Companies are actively seeking DRA that not only boost flow rates but also minimize energy expenditure during pumping and reduce the need for costly pipeline infrastructure upgrades. The historical period (2019-2024) has laid the groundwork for this accelerated growth, marked by consistent advancements in application technologies and a deepening understanding of fluid dynamics within pipeline systems. The ability of DRA to significantly reduce frictional pressure drops, thereby increasing throughput without compromising pipeline integrity, makes them indispensable tools for modern fluid logistics.
Key Markets & Segments Leading Drag Reducing Agents Market
The drag reducing agents market is significantly influenced by the performance of its key application segments and geographical regions. The Low- and Medium-phase Crude Oil segment is a dominant force, directly correlating with the substantial global production and transportation of these essential energy commodities. The growing reliance on crude oil, coupled with the need to transport it efficiently over long distances, makes this segment a primary consumer of drag reducing agents.
- Dominant Application Segments & Drivers:
- Low- and Medium-phase Crude Oil: This segment benefits from the sheer volume of crude oil transported globally. Economic growth in developing nations and established energy markets drives demand for efficient crude oil delivery. The expansion of existing pipeline networks and the development of new ones further bolster this segment's importance.
- Heavy/Asphaltic Crude: With the increasing exploration and production of heavier crude grades, the demand for specialized DRA capable of handling viscous fluids is on the rise. Countries with significant heavy oil reserves are key markets.
- Multiphase Fluid: The efficient transportation of multiphase fluids, which contain a mixture of oil, gas, and water, presents complex flow challenges. DRA plays a crucial role in mitigating slugging and improving flow stability, making this a growing application area, particularly in offshore oil and gas production.
- Refined Products: The transportation of refined fuels like gasoline, diesel, and jet fuel also benefits from DRA. Optimizing delivery to meet demand and reducing transit times are key drivers. The expanding logistics networks for refined products contribute to market growth.
- Other Applications: This broad category can include industrial chemicals, water, and even wastewater transport, where flow efficiency is paramount. While smaller in volume, these niche applications contribute to market diversification.
Geographically, North America and the Middle East remain pivotal markets due to their extensive oil and gas infrastructure and production capabilities. However, Asia Pacific is emerging as a high-growth region, fueled by increasing energy demand, infrastructure development, and a growing focus on optimizing existing pipelines. The Middle East's substantial crude oil production and export volumes, coupled with ongoing efforts to enhance pipeline efficiency, position it as a cornerstone of the global DRA market. North America's mature yet continuously evolving oil and gas sector, with a significant reliance on pipeline transportation for both conventional and unconventional resources, solidifies its leading position.
Drag Reducing Agents Market Product Developments
Product development in the drag reducing agents market is characterized by a relentless pursuit of enhanced performance and environmental compatibility. Manufacturers are focusing on creating DRA formulations with higher efficacy at lower concentrations, leading to greater cost-effectiveness for end-users. Innovations include advanced polymer chemistries that offer superior shear stability, extended operational life, and better compatibility with a wider range of fluid types, including challenging heavy crudes and multiphase mixtures. Furthermore, there's a growing emphasis on developing biodegradable and low-toxicity DRA solutions to meet increasingly stringent environmental regulations and corporate sustainability goals.
Challenges in the Drag Reducing Agents Market Market
Despite its robust growth, the drag reducing agents market faces several challenges. Regulatory hurdles related to the environmental impact and safe handling of chemical additives can sometimes slow down adoption, particularly in regions with stricter chemical control laws. Supply chain complexities, especially for specialized polymer precursors, can lead to price volatility and potential disruptions. The high initial cost of DRA implementation and the need for specialized injection equipment can also be a barrier for smaller operators. Furthermore, competition from alternative flow assurance methods, though often less effective, requires continuous demonstration of DRA's superior economic and operational benefits.
- Key Challenges:
- Environmental regulations and compliance.
- Supply chain volatility and raw material costs.
- Perceived high initial investment for DRA systems.
- Competition from alternative, albeit less efficient, solutions.
Forces Driving Drag Reducing Agents Market Growth
The drag reducing agents market is propelled by a confluence of powerful forces. The relentless global demand for energy, particularly crude oil and its derivatives, necessitates efficient and cost-effective transportation solutions. As existing pipelines age and new ones are developed, optimizing throughput and reducing energy consumption in pumping becomes paramount. Technological advancements in polymer science have led to the creation of more potent and versatile DRA, capable of handling a wider array of fluid types and operating conditions. Furthermore, increasing environmental awareness and stricter regulations are pushing industries to adopt solutions that minimize their carbon footprint and operational impact, with DRA offering a significant advantage in reducing energy usage and associated emissions.
- Key Growth Drivers:
- Surging global energy demand.
- Need for pipeline optimization and cost reduction.
- Technological innovations in DRA formulations.
- Increasing environmental consciousness and regulations.
Challenges in the Drag Reducing Agents Market Market
The long-term growth of the drag reducing agents market hinges on overcoming certain inherent challenges and capitalizing on emerging opportunities. While the benefits of DRA are well-established, continuous innovation is required to address the evolving complexities of fluid transport, such as the increasing extraction of unconventional and challenging crude oil grades. Developing DRA solutions that are highly effective across an even wider range of temperatures, pressures, and fluid compositions will be crucial. Furthermore, enhancing the cost-effectiveness and ease of application of DRA systems, particularly for smaller-scale operations or remote locations, will broaden market penetration. Strategic partnerships and collaborations between DRA manufacturers, pipeline operators, and research institutions will foster accelerated development and adoption of next-generation flow assurance technologies.
Emerging Opportunities in Drag Reducing Agents Market
Emerging opportunities within the drag reducing agents market are diverse and promising. The expanding use of DRA in non-oil and gas sectors, such as industrial water transport, wastewater management, and even food and beverage processing, presents a significant untapped market. The development of novel, bio-based, and highly biodegradable DRA is another key opportunity, driven by increasing demand for sustainable chemical solutions. Furthermore, the integration of DRA with advanced digital monitoring and control systems offers the potential for real-time optimization of pipeline performance, creating value-added services for operators. The growing focus on offshore oil and gas production, with its unique flow assurance challenges, also presents a substantial growth avenue for specialized subsea DRA applications.
- Key Emerging Opportunities:
- Expansion into non-oil and gas industrial fluid transport.
- Development of bio-based and sustainable DRA.
- Integration with digital monitoring and control systems.
- Growing demand for subsea DRA applications.
Leading Players in the Drag Reducing Agents Market Sector
- Baker Hughes
- Dorf Ketal Chemicals India Pvt Ltd
- Flowchem
- Indian Oil Corp Ltd
- Innospec
- Jiangyin Huaheng Auxiliary Co Ltd
- LiquidPower Specialty Products Inc
- NuGenTec
- Oil Flux Americas
- The Zoranoc Oilfield Chemical
Key Milestones in Drag Reducing Agents Market Industry
- August 2022: Baker Hughes announced an agreement to acquire Quest Integrity, a subsidiary of Team, Inc. This strategic move enhances Baker Hughes' capabilities in technology-enabled asset inspection and reliability management solutions for the pipeline, refinery, petrochemical, and power generation industries, indirectly supporting the application and optimization of drag reducers by ensuring pipeline integrity and identifying areas where DRA can maximize efficiency.
- October 2021: LiquidPower Specialty Products Inc. (LSPI) formed a strategic partnership with Safe Marine Transfer, LLC (SMT). This collaboration focuses on supplying LSPI's market-leading drag-reducing agents (DRA) subsea using SMT's innovative all-electric dual barrier subsea storage and injection unit. The installation of DRA at underwater well/drill centers has the potential to significantly boost output and cost-effectiveness by increasing flow rates in existing subsea production, collection, and trunk lines.
Strategic Outlook for Drag Reducing Agents Market Market
The strategic outlook for the drag reducing agents market is exceptionally positive, driven by a clear and sustained demand for enhanced efficiency in fluid transportation. Future growth will be shaped by continued innovation in DRA formulation, focusing on environmental sustainability, higher efficacy at lower concentrations, and adaptability to increasingly complex fluid compositions. Strategic collaborations between DRA providers, end-users, and technology developers will be crucial for accelerating the adoption of advanced flow assurance solutions. Expansion into new geographical markets and non-traditional application sectors, such as industrial water and wastewater management, will unlock significant growth potential. The integration of digital technologies for real-time performance monitoring and optimization will further solidify DRA's value proposition, positioning the market for continued expansion and technological advancement in the coming years.
Drag Reducing Agents Market Segmentation
-
1. Application
- 1.1. Low- and Medium-phase Crude Oil
- 1.2. Heavy/Asphaltic Crude
- 1.3. Multiphase Fluid
- 1.4. Refined Products
- 1.5. Other Applications
Drag Reducing Agents Market Segmentation By Geography
-
1. Asia Pacific
- 1.1. China
- 1.2. India
- 1.3. Japan
- 1.4. South Korea
- 1.5. Rest of Asia Pacific
-
2. North America
- 2.1. United States
- 2.2. Canada
- 2.3. Mexico
-
3. Europe
- 3.1. Germany
- 3.2. United Kingdom
- 3.3. France
- 3.4. Italy
- 3.5. Rest of Europe
-
4. South America
- 4.1. Brazil
- 4.2. Argentina
- 4.3. Rest of South America
-
5. Middle East and Africa
- 5.1. South Africa
- 5.2. Saudi Arabia
- 5.3. Rest of Middle East and Africa
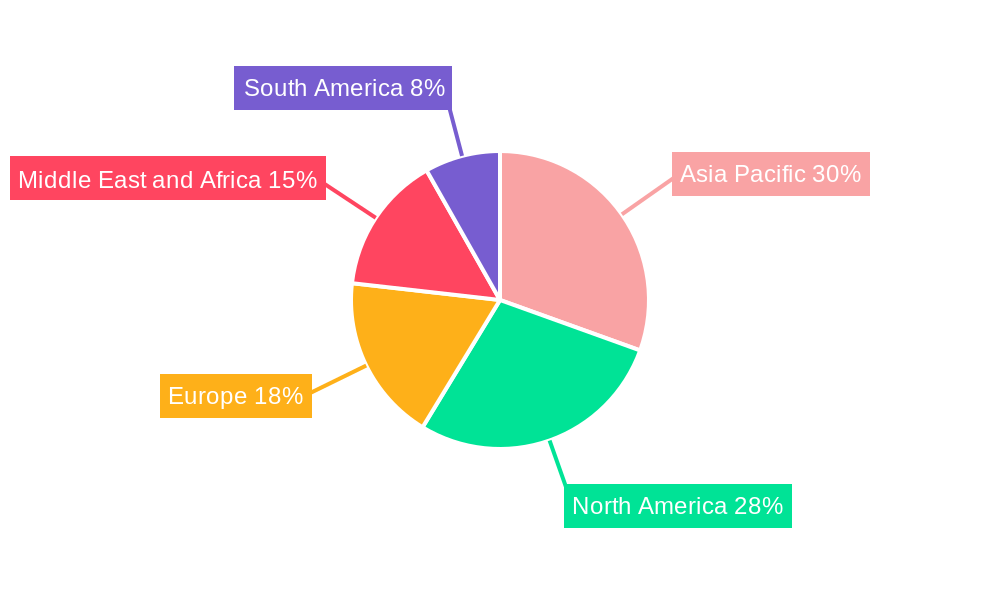
Drag Reducing Agents Market Regional Market Share
Geographic Coverage of Drag Reducing Agents Market
Drag Reducing Agents Market REPORT HIGHLIGHTS
| Aspects | Details |
|---|---|
| Study Period | 2020-2034 |
| Base Year | 2025 |
| Estimated Year | 2026 |
| Forecast Period | 2026-2034 |
| Historical Period | 2020-2025 |
| Growth Rate | CAGR of 5.7% from 2020-2034 |
| Segmentation |
|
Table of Contents
- 1. Introduction
- 1.1. Research Scope
- 1.2. Market Segmentation
- 1.3. Research Objective
- 1.4. Definitions and Assumptions
- 2. Executive Summary
- 2.1. Market Snapshot
- 3. Market Dynamics
- 3.1. Market Drivers
- 3.2. Market Restrains
- 3.3. Market Trends
- 3.4. Market Opportunities
- 4. Market Factor Analysis
- 4.1. Porters Five Forces
- 4.1.1. Bargaining Power of Suppliers
- 4.1.2. Bargaining Power of Buyers
- 4.1.3. Threat of New Entrants
- 4.1.4. Threat of Substitutes
- 4.1.5. Competitive Rivalry
- 4.2. PESTEL analysis
- 4.3. BCG Analysis
- 4.3.1. Stars (High Growth, High Market Share)
- 4.3.2. Cash Cows (Low Growth, High Market Share)
- 4.3.3. Question Mark (High Growth, Low Market Share)
- 4.3.4. Dogs (Low Growth, Low Market Share)
- 4.4. Ansoff Matrix Analysis
- 4.5. Supply Chain Analysis
- 4.6. Regulatory Landscape
- 4.7. Current Market Potential and Opportunity Assessment (TAM–SAM–SOM Framework)
- 4.8. MSR Analyst Note
- 4.1. Porters Five Forces
- 5. Market Analysis, Insights and Forecast 2021-2033
- 5.1. Market Analysis, Insights and Forecast - by Application
- 5.1.1. Low- and Medium-phase Crude Oil
- 5.1.2. Heavy/Asphaltic Crude
- 5.1.3. Multiphase Fluid
- 5.1.4. Refined Products
- 5.1.5. Other Applications
- 5.2. Market Analysis, Insights and Forecast - by Region
- 5.2.1. Asia Pacific
- 5.2.2. North America
- 5.2.3. Europe
- 5.2.4. South America
- 5.2.5. Middle East and Africa
- 5.1. Market Analysis, Insights and Forecast - by Application
- 6. Global Drag Reducing Agents Market Analysis, Insights and Forecast, 2021-2033
- 6.1. Market Analysis, Insights and Forecast - by Application
- 6.1.1. Low- and Medium-phase Crude Oil
- 6.1.2. Heavy/Asphaltic Crude
- 6.1.3. Multiphase Fluid
- 6.1.4. Refined Products
- 6.1.5. Other Applications
- 6.1. Market Analysis, Insights and Forecast - by Application
- 7. Asia Pacific Drag Reducing Agents Market Analysis, Insights and Forecast, 2020-2032
- 7.1. Market Analysis, Insights and Forecast - by Application
- 7.1.1. Low- and Medium-phase Crude Oil
- 7.1.2. Heavy/Asphaltic Crude
- 7.1.3. Multiphase Fluid
- 7.1.4. Refined Products
- 7.1.5. Other Applications
- 7.1. Market Analysis, Insights and Forecast - by Application
- 8. North America Drag Reducing Agents Market Analysis, Insights and Forecast, 2020-2032
- 8.1. Market Analysis, Insights and Forecast - by Application
- 8.1.1. Low- and Medium-phase Crude Oil
- 8.1.2. Heavy/Asphaltic Crude
- 8.1.3. Multiphase Fluid
- 8.1.4. Refined Products
- 8.1.5. Other Applications
- 8.1. Market Analysis, Insights and Forecast - by Application
- 9. Europe Drag Reducing Agents Market Analysis, Insights and Forecast, 2020-2032
- 9.1. Market Analysis, Insights and Forecast - by Application
- 9.1.1. Low- and Medium-phase Crude Oil
- 9.1.2. Heavy/Asphaltic Crude
- 9.1.3. Multiphase Fluid
- 9.1.4. Refined Products
- 9.1.5. Other Applications
- 9.1. Market Analysis, Insights and Forecast - by Application
- 10. South America Drag Reducing Agents Market Analysis, Insights and Forecast, 2020-2032
- 10.1. Market Analysis, Insights and Forecast - by Application
- 10.1.1. Low- and Medium-phase Crude Oil
- 10.1.2. Heavy/Asphaltic Crude
- 10.1.3. Multiphase Fluid
- 10.1.4. Refined Products
- 10.1.5. Other Applications
- 10.1. Market Analysis, Insights and Forecast - by Application
- 11. Middle East and Africa Drag Reducing Agents Market Analysis, Insights and Forecast, 2020-2032
- 11.1. Market Analysis, Insights and Forecast - by Application
- 11.1.1. Low- and Medium-phase Crude Oil
- 11.1.2. Heavy/Asphaltic Crude
- 11.1.3. Multiphase Fluid
- 11.1.4. Refined Products
- 11.1.5. Other Applications
- 11.1. Market Analysis, Insights and Forecast - by Application
- 12. Competitive Analysis
- 12.1. Company Profiles
- 12.1.1 Baker Hughes
- 12.1.1.1. Company Overview
- 12.1.1.2. Products
- 12.1.1.3. Company Financials
- 12.1.1.4. SWOT Analysis
- 12.1.2 Dorf Ketal Chemicals India Pvt Ltd
- 12.1.2.1. Company Overview
- 12.1.2.2. Products
- 12.1.2.3. Company Financials
- 12.1.2.4. SWOT Analysis
- 12.1.3 Flowchem
- 12.1.3.1. Company Overview
- 12.1.3.2. Products
- 12.1.3.3. Company Financials
- 12.1.3.4. SWOT Analysis
- 12.1.4 Indian Oil Corp Ltd
- 12.1.4.1. Company Overview
- 12.1.4.2. Products
- 12.1.4.3. Company Financials
- 12.1.4.4. SWOT Analysis
- 12.1.5 Innospec
- 12.1.5.1. Company Overview
- 12.1.5.2. Products
- 12.1.5.3. Company Financials
- 12.1.5.4. SWOT Analysis
- 12.1.6 Jiangyin Huaheng Auxiliary Co Ltd
- 12.1.6.1. Company Overview
- 12.1.6.2. Products
- 12.1.6.3. Company Financials
- 12.1.6.4. SWOT Analysis
- 12.1.7 LiquidPower Specialty Products Inc
- 12.1.7.1. Company Overview
- 12.1.7.2. Products
- 12.1.7.3. Company Financials
- 12.1.7.4. SWOT Analysis
- 12.1.8 NuGenTec
- 12.1.8.1. Company Overview
- 12.1.8.2. Products
- 12.1.8.3. Company Financials
- 12.1.8.4. SWOT Analysis
- 12.1.9 Oil Flux Americas
- 12.1.9.1. Company Overview
- 12.1.9.2. Products
- 12.1.9.3. Company Financials
- 12.1.9.4. SWOT Analysis
- 12.1.10 The Zoranoc Oilfield Chemical*List Not Exhaustive
- 12.1.10.1. Company Overview
- 12.1.10.2. Products
- 12.1.10.3. Company Financials
- 12.1.10.4. SWOT Analysis
- 12.1.1 Baker Hughes
- 12.2. Market Entropy
- 12.2.1 Company's Key Areas Served
- 12.2.2 Recent Developments
- 12.3. Company Market Share Analysis 2025
- 12.3.1 Top 5 Companies Market Share Analysis
- 12.3.2 Top 3 Companies Market Share Analysis
- 12.4. List of Potential Customers
- 13. Research Methodology
List of Figures
- Figure 1: Global Drag Reducing Agents Market Revenue Breakdown (million, %) by Region 2025 & 2033
- Figure 2: Asia Pacific Drag Reducing Agents Market Revenue (million), by Application 2025 & 2033
- Figure 3: Asia Pacific Drag Reducing Agents Market Revenue Share (%), by Application 2025 & 2033
- Figure 4: Asia Pacific Drag Reducing Agents Market Revenue (million), by Country 2025 & 2033
- Figure 5: Asia Pacific Drag Reducing Agents Market Revenue Share (%), by Country 2025 & 2033
- Figure 6: North America Drag Reducing Agents Market Revenue (million), by Application 2025 & 2033
- Figure 7: North America Drag Reducing Agents Market Revenue Share (%), by Application 2025 & 2033
- Figure 8: North America Drag Reducing Agents Market Revenue (million), by Country 2025 & 2033
- Figure 9: North America Drag Reducing Agents Market Revenue Share (%), by Country 2025 & 2033
- Figure 10: Europe Drag Reducing Agents Market Revenue (million), by Application 2025 & 2033
- Figure 11: Europe Drag Reducing Agents Market Revenue Share (%), by Application 2025 & 2033
- Figure 12: Europe Drag Reducing Agents Market Revenue (million), by Country 2025 & 2033
- Figure 13: Europe Drag Reducing Agents Market Revenue Share (%), by Country 2025 & 2033
- Figure 14: South America Drag Reducing Agents Market Revenue (million), by Application 2025 & 2033
- Figure 15: South America Drag Reducing Agents Market Revenue Share (%), by Application 2025 & 2033
- Figure 16: South America Drag Reducing Agents Market Revenue (million), by Country 2025 & 2033
- Figure 17: South America Drag Reducing Agents Market Revenue Share (%), by Country 2025 & 2033
- Figure 18: Middle East and Africa Drag Reducing Agents Market Revenue (million), by Application 2025 & 2033
- Figure 19: Middle East and Africa Drag Reducing Agents Market Revenue Share (%), by Application 2025 & 2033
- Figure 20: Middle East and Africa Drag Reducing Agents Market Revenue (million), by Country 2025 & 2033
- Figure 21: Middle East and Africa Drag Reducing Agents Market Revenue Share (%), by Country 2025 & 2033
List of Tables
- Table 1: Global Drag Reducing Agents Market Revenue million Forecast, by Application 2020 & 2033
- Table 2: Global Drag Reducing Agents Market Revenue million Forecast, by Region 2020 & 2033
- Table 3: Global Drag Reducing Agents Market Revenue million Forecast, by Application 2020 & 2033
- Table 4: Global Drag Reducing Agents Market Revenue million Forecast, by Country 2020 & 2033
- Table 5: China Drag Reducing Agents Market Revenue (million) Forecast, by Application 2020 & 2033
- Table 6: India Drag Reducing Agents Market Revenue (million) Forecast, by Application 2020 & 2033
- Table 7: Japan Drag Reducing Agents Market Revenue (million) Forecast, by Application 2020 & 2033
- Table 8: South Korea Drag Reducing Agents Market Revenue (million) Forecast, by Application 2020 & 2033
- Table 9: Rest of Asia Pacific Drag Reducing Agents Market Revenue (million) Forecast, by Application 2020 & 2033
- Table 10: Global Drag Reducing Agents Market Revenue million Forecast, by Application 2020 & 2033
- Table 11: Global Drag Reducing Agents Market Revenue million Forecast, by Country 2020 & 2033
- Table 12: United States Drag Reducing Agents Market Revenue (million) Forecast, by Application 2020 & 2033
- Table 13: Canada Drag Reducing Agents Market Revenue (million) Forecast, by Application 2020 & 2033
- Table 14: Mexico Drag Reducing Agents Market Revenue (million) Forecast, by Application 2020 & 2033
- Table 15: Global Drag Reducing Agents Market Revenue million Forecast, by Application 2020 & 2033
- Table 16: Global Drag Reducing Agents Market Revenue million Forecast, by Country 2020 & 2033
- Table 17: Germany Drag Reducing Agents Market Revenue (million) Forecast, by Application 2020 & 2033
- Table 18: United Kingdom Drag Reducing Agents Market Revenue (million) Forecast, by Application 2020 & 2033
- Table 19: France Drag Reducing Agents Market Revenue (million) Forecast, by Application 2020 & 2033
- Table 20: Italy Drag Reducing Agents Market Revenue (million) Forecast, by Application 2020 & 2033
- Table 21: Rest of Europe Drag Reducing Agents Market Revenue (million) Forecast, by Application 2020 & 2033
- Table 22: Global Drag Reducing Agents Market Revenue million Forecast, by Application 2020 & 2033
- Table 23: Global Drag Reducing Agents Market Revenue million Forecast, by Country 2020 & 2033
- Table 24: Brazil Drag Reducing Agents Market Revenue (million) Forecast, by Application 2020 & 2033
- Table 25: Argentina Drag Reducing Agents Market Revenue (million) Forecast, by Application 2020 & 2033
- Table 26: Rest of South America Drag Reducing Agents Market Revenue (million) Forecast, by Application 2020 & 2033
- Table 27: Global Drag Reducing Agents Market Revenue million Forecast, by Application 2020 & 2033
- Table 28: Global Drag Reducing Agents Market Revenue million Forecast, by Country 2020 & 2033
- Table 29: South Africa Drag Reducing Agents Market Revenue (million) Forecast, by Application 2020 & 2033
- Table 30: Saudi Arabia Drag Reducing Agents Market Revenue (million) Forecast, by Application 2020 & 2033
- Table 31: Rest of Middle East and Africa Drag Reducing Agents Market Revenue (million) Forecast, by Application 2020 & 2033
Frequently Asked Questions
1. What is the projected Compound Annual Growth Rate (CAGR) of the Drag Reducing Agents Market?
The projected CAGR is approximately 5.7%.
2. Which companies are prominent players in the Drag Reducing Agents Market?
Key companies in the market include Baker Hughes, Dorf Ketal Chemicals India Pvt Ltd, Flowchem, Indian Oil Corp Ltd, Innospec, Jiangyin Huaheng Auxiliary Co Ltd, LiquidPower Specialty Products Inc, NuGenTec, Oil Flux Americas, The Zoranoc Oilfield Chemical*List Not Exhaustive.
3. What are the main segments of the Drag Reducing Agents Market?
The market segments include Application.
4. Can you provide details about the market size?
The market size is estimated to be USD 749.5 million as of 2022.
5. What are some drivers contributing to market growth?
Increasing Demand from Refineries; Other Drivers.
6. What are the notable trends driving market growth?
Crude Oil has a Substantial Market Share.
7. Are there any restraints impacting market growth?
Increasing Demand from Refineries; Other Drivers.
8. Can you provide examples of recent developments in the market?
August 2022 : Baker Hughes announced an agreement to acquire Quest Integrity a subsidiary of Team, Inc, in the development and delivery of technology-enabled asset inspection and reliability management solutions for the pipeline, refinery, petrochemical, and power generation industries. Baker Hughes pipeline inspection services identify, describe, locate, and size abnormalities in a pipeline's wall that may need the use of drag reducers to decrease frictional pressure drops in a pipeline or conduit during fluid flow.
9. What pricing options are available for accessing the report?
Pricing options include single-user, multi-user, and enterprise licenses priced at USD 4750, USD 5250, and USD 8750 respectively.
10. Is the market size provided in terms of value or volume?
The market size is provided in terms of value, measured in million.
11. Are there any specific market keywords associated with the report?
Yes, the market keyword associated with the report is "Drag Reducing Agents Market," which aids in identifying and referencing the specific market segment covered.
12. How do I determine which pricing option suits my needs best?
The pricing options vary based on user requirements and access needs. Individual users may opt for single-user licenses, while businesses requiring broader access may choose multi-user or enterprise licenses for cost-effective access to the report.
13. Are there any additional resources or data provided in the Drag Reducing Agents Market report?
While the report offers comprehensive insights, it's advisable to review the specific contents or supplementary materials provided to ascertain if additional resources or data are available.
14. How can I stay updated on further developments or reports in the Drag Reducing Agents Market?
To stay informed about further developments, trends, and reports in the Drag Reducing Agents Market, consider subscribing to industry newsletters, following relevant companies and organizations, or regularly checking reputable industry news sources and publications.
Methodology
Step 1 - Identification of Relevant Samples Size from Population Database


Step 2 - Approaches for Defining Global Market Size (Value, Volume* & Price*)

Note*: In applicable scenarios
Step 3 - Data Sources
Primary Research
- Web Analytics
- Survey Reports
- Research Institute
- Latest Research Reports
- Opinion Leaders
Secondary Research
- Annual Reports
- White Paper
- Latest Press Release
- Industry Association
- Paid Database
- Investor Presentations

Step 4 - Data Triangulation
Involves using different sources of information in order to increase the validity of a study
These sources are likely to be stakeholders in a program - participants, other researchers, program staff, other community members, and so on.
Then we put all data in single framework & apply various statistical tools to find out the dynamic on the market.
During the analysis stage, feedback from the stakeholder groups would be compared to determine areas of agreement as well as areas of divergence