

Key Insights
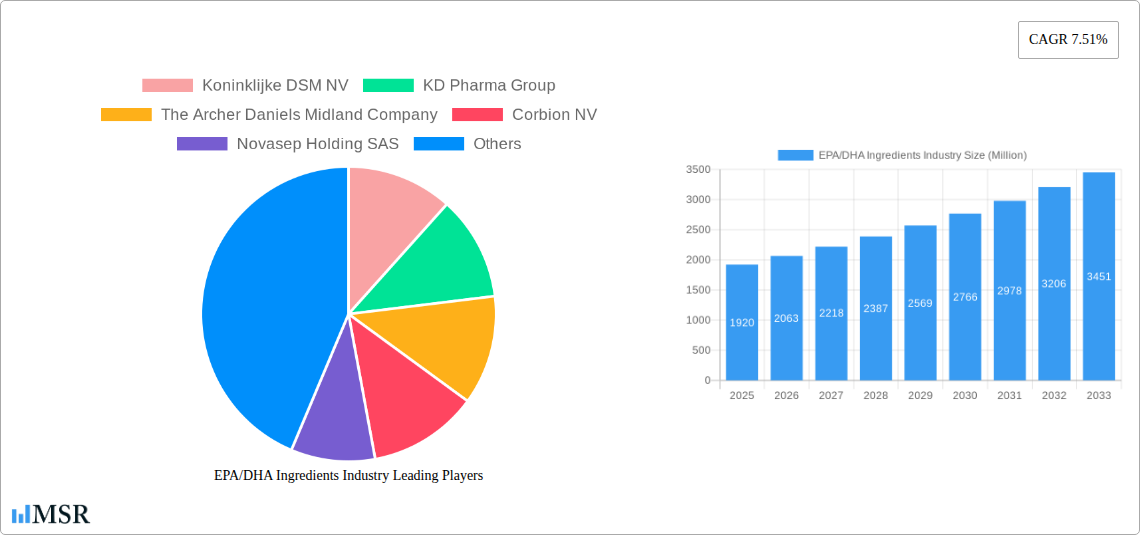
The EPA/DHA Ingredients market, valued at $1.92 billion in 2025, is projected to experience robust growth, driven by increasing consumer awareness of the health benefits associated with omega-3 fatty acids. The rising prevalence of cardiovascular diseases, cognitive decline, and inflammatory conditions fuels the demand for EPA and DHA supplements, a key driver for market expansion. Furthermore, the growing adoption of functional foods and beverages enriched with omega-3s contributes significantly to market growth. The market is witnessing innovation in extraction and purification technologies, leading to higher quality and more sustainable production methods. This, combined with a growing trend towards personalized nutrition, further bolsters market prospects. While price fluctuations in raw materials and stringent regulatory requirements pose challenges, the overall market outlook remains positive.
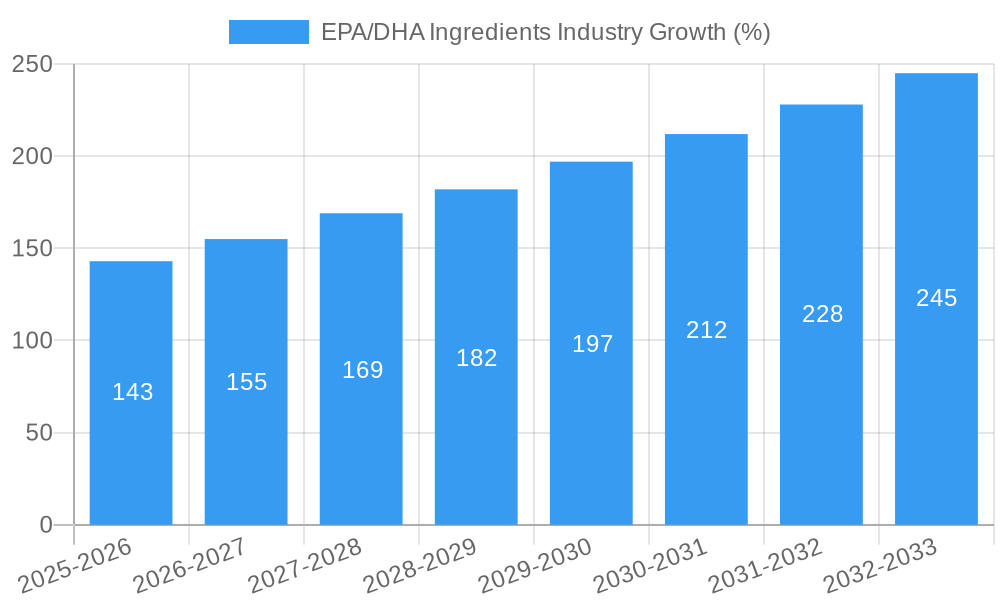
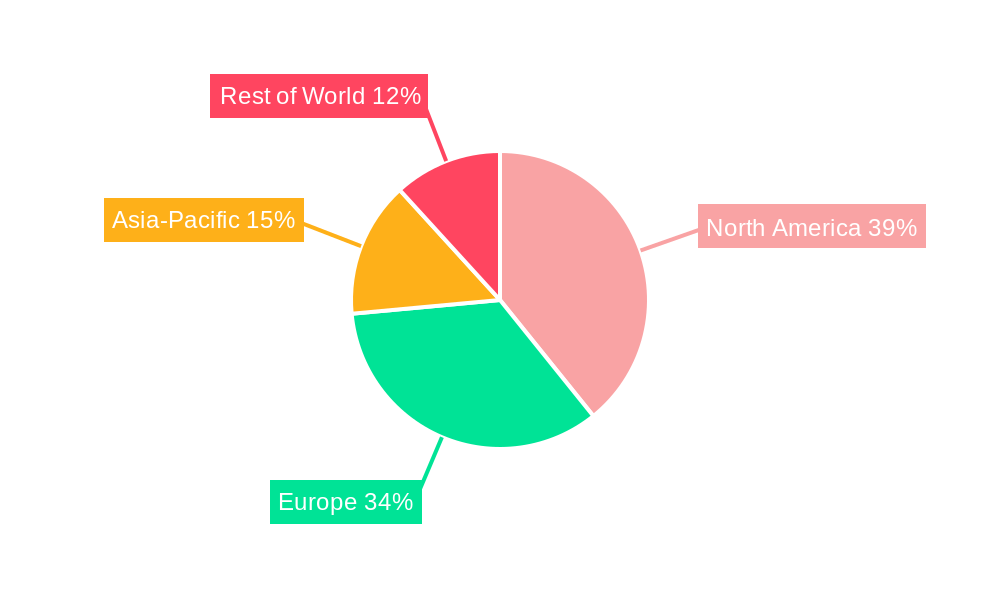
The market's Compound Annual Growth Rate (CAGR) of 7.51% from 2019 to 2025 indicates a consistently expanding market. Projecting this growth forward, we can anticipate continued expansion through 2033. Key players like Koninklijke DSM NV, KD Pharma Group, and Archer Daniels Midland Company are driving innovation and expanding their market share through strategic partnerships, acquisitions, and product diversification. Geographical segmentation likely reveals strong growth in North America and Europe, fueled by high consumer awareness and established healthcare infrastructure, while emerging markets in Asia-Pacific show promising, albeit slower growth due to factors such as evolving consumer preferences and regulatory landscapes. The segmentation within the market likely includes different forms of EPA/DHA ingredients (e.g., oils, concentrates, powders) each catering to different applications in food, dietary supplements, and pharmaceuticals. This diverse product portfolio reflects the evolving market needs and applications of EPA/DHA ingredients.
EPA/DHA Ingredients Industry: A Comprehensive Market Report (2019-2033)
This in-depth report provides a comprehensive analysis of the EPA/DHA ingredients market, offering invaluable insights for industry stakeholders, investors, and strategic decision-makers. With a study period spanning 2019-2033, a base year of 2025, and a forecast period of 2025-2033, this report unveils the market's historical performance, current dynamics, and future trajectory. The report covers key market segments, leading players like Koninklijke DSM NV, KD Pharma Group, and Archer Daniels Midland Company, and analyses crucial industry developments. Expect detailed market sizing, CAGR projections, and actionable recommendations. Download now to gain a competitive edge.
EPA/DHA Ingredients Industry Market Concentration & Dynamics
The global EPA/DHA ingredients market exhibits a moderately concentrated landscape, with a few major players holding significant market share. Koninklijke DSM NV, KD Pharma Group, and The Archer Daniels Midland Company are among the leading players, collectively accounting for an estimated xx% of the market in 2025. However, the market is also characterized by a dynamic competitive environment with numerous smaller players, especially in niche segments.
Market Dynamics:
- Innovation Ecosystems: Significant investments in R&D are driving innovation in extraction technologies, purification methods, and product formulations, leading to higher purity and efficacy.
- Regulatory Frameworks: Varying regulations across different regions influence market access and product development. Compliance with health and safety standards is a critical factor.
- Substitute Products: While other omega-3 sources exist, the unique health benefits of EPA and DHA, particularly their influence on cardiovascular and brain health, maintain a strong demand for these specific ingredients.
- End-User Trends: Growing consumer awareness of the health benefits of omega-3s, coupled with rising prevalence of chronic diseases, fuels demand across diverse applications, including dietary supplements, functional foods, and pharmaceuticals.
- M&A Activities: The industry has witnessed a moderate number of mergers and acquisitions (xx deals in the past five years), indicating strategic consolidation and expansion efforts among key players. These activities aim to strengthen market positions and diversify product portfolios.
EPA/DHA Ingredients Industry Industry Insights & Trends
The global EPA/DHA ingredients market is experiencing robust growth, driven by a confluence of factors. The market size was valued at approximately $xx Million in 2025 and is projected to reach $xx Million by 2033, exhibiting a CAGR of xx% during the forecast period.
Several key factors are fueling this expansion:
- Increasing Prevalence of Chronic Diseases: The rising incidence of heart disease, cognitive decline, and other chronic conditions is a major driver, as EPA and DHA are increasingly recognized for their potential to mitigate these health risks.
- Growing Consumer Health Awareness: Consumers are becoming more informed about nutrition and proactive health management, leading to a greater demand for functional foods and supplements enriched with EPA and DHA.
- Technological Advancements: Innovations in extraction and purification technologies enhance the quality, purity, and cost-effectiveness of EPA and DHA ingredients. This, in turn, expands market accessibility and affordability.
- Evolving Consumer Preferences: The shift toward healthier lifestyles and the growing popularity of plant-based and sustainable products are influencing the demand for sustainably sourced EPA and DHA ingredients.
- Product Diversification: The market is witnessing a growing range of product forms, including capsules, gummies, liquids, and powders, catering to diverse consumer preferences and application needs.
Key Markets & Segments Leading EPA/DHA Ingredients Industry
The North American market currently dominates the global EPA/DHA ingredients industry, accounting for an estimated xx% of the total market value in 2025. This dominance is attributed to several factors:
- High Consumer Demand: High levels of health consciousness and a large aging population contribute to significant demand in this region.
- Strong Regulatory Framework: Well-defined regulatory frameworks ensure consumer safety and support the industry's growth.
- Robust Healthcare Infrastructure: The well-developed healthcare infrastructure facilitates product distribution and market penetration.
- High Disposable Incomes: High disposable incomes enable consumers to afford premium health products, including EPA and DHA supplements and functional foods.
Other Key Regions:
The European and Asia-Pacific markets are also exhibiting significant growth, driven by rising health awareness, increasing disposable incomes, and evolving dietary preferences.
EPA/DHA Ingredients Industry Product Developments
Recent product innovations focus on enhancing purity, bioavailability, and stability of EPA and DHA ingredients. This includes the development of ultra-concentrated oils, innovative delivery systems (e.g., gummies and liquids), and formulations designed for specific health benefits (e.g., heart health, cognitive function, skin health). Companies are also focusing on developing sustainable and ethically sourced products to address growing consumer concerns. The introduction of EPAX Omega 3-9-11, a full-spectrum oil combining omega-3, -9, and -11 fatty acids, exemplifies this trend.
Challenges in the EPA/DHA Ingredients Industry Market
Several challenges hinder the growth of the EPA/DHA ingredients market:
- Supply Chain Disruptions: Dependence on sustainable and ethical sourcing of raw materials poses supply chain vulnerability.
- Price Volatility of Raw Materials: Fluctuations in the prices of raw materials impact the overall cost and profitability of EPA/DHA production.
- Stringent Regulatory Requirements: Meeting stringent regulatory requirements in different regions adds complexity and cost to product development and market entry.
- Competition from Substitute Products: Competition from other omega-3 sources and alternative health supplements presents a constant challenge.
Forces Driving EPA/DHA Ingredients Industry Growth
Several factors are driving the long-term growth of the EPA/DHA ingredients market:
- Technological Advancements: Continuous advancements in extraction and purification techniques are leading to higher quality, more sustainable, and more cost-effective EPA and DHA products.
- Growing Scientific Evidence: Accumulating scientific evidence supporting the health benefits of EPA and DHA fuels consumer demand and strengthens market positioning.
- Favorable Regulatory Environment: A supportive regulatory environment in many countries promotes industry growth and innovation.
- Strategic Partnerships: Collaborations between ingredient suppliers, food manufacturers, and health supplement companies expand market reach and product diversification.
Challenges in the EPA/DHA Ingredients Industry Market
Long-term growth catalysts include sustained investments in R&D, strategic partnerships, expansion into new markets (e.g., emerging economies), and the development of innovative product formats tailored to specific consumer needs. Focus on sustainability and traceability also drives consumer confidence and market growth.
Emerging Opportunities in EPA/DHA Ingredients Industry
Emerging opportunities include the development of personalized nutrition products containing EPA and DHA, the expansion into new applications (e.g., animal feed, cosmetics), and the growing demand for sustainably sourced and ethically produced ingredients. The market for vegan and vegetarian-friendly omega-3 products also presents significant potential.
Leading Players in the EPA/DHA Ingredients Industry Sector
- Koninklijke DSM NV
- KD Pharma Group
- The Archer Daniels Midland Company
- Corbion NV
- Novasep Holding SAS
- Neptune Wellness Solutions
- BASF SE
- Omega Protein Corporation
- Croda International PLC
- Novotech Nutraceuticals
Key Milestones in EPA/DHA Ingredients Industry Industry
- March 2024: DSM-Firmenich partnered with SCN BestCo to launch omega-3 gummies with EPA and DHA ingredients, expanding product offerings and catering to consumer preferences for convenient formats.
- March 2024: Epax invested USD 40 million in a state-of-the-art distillation facility, enhancing production capacity and improving the quality and concentration of its omega-3 products. This underscores the industry's focus on technological advancements.
- February 2024: Epax launched EPAX Omega 3-9-11, a full-spectrum oil targeting the skin health supplement market, demonstrating product diversification and the expansion into new application areas.
Strategic Outlook for EPA/DHA Ingredients Industry Market
The EPA/DHA ingredients market is poised for sustained growth, driven by rising health consciousness, technological advancements, and expanding applications. Strategic opportunities lie in developing innovative products, securing sustainable supply chains, and expanding into new markets, particularly in emerging economies. Companies focusing on product differentiation, sustainability, and building strong brand equity are well-positioned to succeed in this dynamic market.
EPA/DHA Ingredients Industry Segmentation
-
1. Type
- 1.1. Eicosapentaenoic Acid (EPA)
- 1.2. Docosahexaenoic Acid (DHA)
-
2. Source
- 2.1. Fish Oil
- 2.2. Algae Oil
- 2.3. Krill Oil
- 2.4. Other Sources
-
3. Application
- 3.1. Infant Formulae
- 3.2. Dietary Supplements
- 3.3. Fortified Food and Beverages
- 3.4. Pharmaceuticals
- 3.5. Other Applications
EPA/DHA Ingredients Industry Segmentation By Geography
-
1. North America
- 1.1. United States
- 1.2. Mexico
- 1.3. Canada
- 1.4. Rest of North America
-
2. Europe
- 2.1. Spain
- 2.2. United Kingdom
- 2.3. Germany
- 2.4. France
- 2.5. Russia
- 2.6. Italy
- 2.7. Rest of Europe
-
3. Asia Pacific
- 3.1. China
- 3.2. Japan
- 3.3. India
- 3.4. Australia
- 3.5. Rest of Asia Pacific
-
4. South America
- 4.1. Brazil
- 4.2. Argentina
- 4.3. Rest of South America
-
5. Middle East and Africa
- 5.1. United Arab Emirates
- 5.2. South Africa
- 5.3. Rest of Middle East and Africa
EPA/DHA Ingredients Industry REPORT HIGHLIGHTS
| Aspects | Details |
|---|---|
| Study Period | 2019-2033 |
| Base Year | 2024 |
| Estimated Year | 2025 |
| Forecast Period | 2025-2033 |
| Historical Period | 2019-2024 |
| Growth Rate | CAGR of 7.51% from 2019-2033 |
| Segmentation |
|
Table of Contents
- 1. Introduction
- 1.1. Research Scope
- 1.2. Market Segmentation
- 1.3. Research Methodology
- 1.4. Definitions and Assumptions
- 2. Executive Summary
- 2.1. Introduction
- 3. Market Dynamics
- 3.1. Introduction
- 3.2. Market Drivers
- 3.2.1. Increasing Awareness Of Health Benefits Associated With EPA And DHA; Demand for Concentrated Forms of Omega 3
- 3.3. Market Restrains
- 3.3.1. Increasing Awareness Of Health Benefits Associated With EPA And DHA; Demand for Concentrated Forms of Omega 3
- 3.4. Market Trends
- 3.4.1. Increasing Awareness Of Health Benefits Associated With EPA And DHA
- 4. Market Factor Analysis
- 4.1. Porters Five Forces
- 4.2. Supply/Value Chain
- 4.3. PESTEL analysis
- 4.4. Market Entropy
- 4.5. Patent/Trademark Analysis
- 5. Global EPA/DHA Ingredients Industry Analysis, Insights and Forecast, 2019-2031
- 5.1. Market Analysis, Insights and Forecast - by Type
- 5.1.1. Eicosapentaenoic Acid (EPA)
- 5.1.2. Docosahexaenoic Acid (DHA)
- 5.2. Market Analysis, Insights and Forecast - by Source
- 5.2.1. Fish Oil
- 5.2.2. Algae Oil
- 5.2.3. Krill Oil
- 5.2.4. Other Sources
- 5.3. Market Analysis, Insights and Forecast - by Application
- 5.3.1. Infant Formulae
- 5.3.2. Dietary Supplements
- 5.3.3. Fortified Food and Beverages
- 5.3.4. Pharmaceuticals
- 5.3.5. Other Applications
- 5.4. Market Analysis, Insights and Forecast - by Region
- 5.4.1. North America
- 5.4.2. Europe
- 5.4.3. Asia Pacific
- 5.4.4. South America
- 5.4.5. Middle East and Africa
- 5.1. Market Analysis, Insights and Forecast - by Type
- 6. North America EPA/DHA Ingredients Industry Analysis, Insights and Forecast, 2019-2031
- 6.1. Market Analysis, Insights and Forecast - by Type
- 6.1.1. Eicosapentaenoic Acid (EPA)
- 6.1.2. Docosahexaenoic Acid (DHA)
- 6.2. Market Analysis, Insights and Forecast - by Source
- 6.2.1. Fish Oil
- 6.2.2. Algae Oil
- 6.2.3. Krill Oil
- 6.2.4. Other Sources
- 6.3. Market Analysis, Insights and Forecast - by Application
- 6.3.1. Infant Formulae
- 6.3.2. Dietary Supplements
- 6.3.3. Fortified Food and Beverages
- 6.3.4. Pharmaceuticals
- 6.3.5. Other Applications
- 6.1. Market Analysis, Insights and Forecast - by Type
- 7. Europe EPA/DHA Ingredients Industry Analysis, Insights and Forecast, 2019-2031
- 7.1. Market Analysis, Insights and Forecast - by Type
- 7.1.1. Eicosapentaenoic Acid (EPA)
- 7.1.2. Docosahexaenoic Acid (DHA)
- 7.2. Market Analysis, Insights and Forecast - by Source
- 7.2.1. Fish Oil
- 7.2.2. Algae Oil
- 7.2.3. Krill Oil
- 7.2.4. Other Sources
- 7.3. Market Analysis, Insights and Forecast - by Application
- 7.3.1. Infant Formulae
- 7.3.2. Dietary Supplements
- 7.3.3. Fortified Food and Beverages
- 7.3.4. Pharmaceuticals
- 7.3.5. Other Applications
- 7.1. Market Analysis, Insights and Forecast - by Type
- 8. Asia Pacific EPA/DHA Ingredients Industry Analysis, Insights and Forecast, 2019-2031
- 8.1. Market Analysis, Insights and Forecast - by Type
- 8.1.1. Eicosapentaenoic Acid (EPA)
- 8.1.2. Docosahexaenoic Acid (DHA)
- 8.2. Market Analysis, Insights and Forecast - by Source
- 8.2.1. Fish Oil
- 8.2.2. Algae Oil
- 8.2.3. Krill Oil
- 8.2.4. Other Sources
- 8.3. Market Analysis, Insights and Forecast - by Application
- 8.3.1. Infant Formulae
- 8.3.2. Dietary Supplements
- 8.3.3. Fortified Food and Beverages
- 8.3.4. Pharmaceuticals
- 8.3.5. Other Applications
- 8.1. Market Analysis, Insights and Forecast - by Type
- 9. South America EPA/DHA Ingredients Industry Analysis, Insights and Forecast, 2019-2031
- 9.1. Market Analysis, Insights and Forecast - by Type
- 9.1.1. Eicosapentaenoic Acid (EPA)
- 9.1.2. Docosahexaenoic Acid (DHA)
- 9.2. Market Analysis, Insights and Forecast - by Source
- 9.2.1. Fish Oil
- 9.2.2. Algae Oil
- 9.2.3. Krill Oil
- 9.2.4. Other Sources
- 9.3. Market Analysis, Insights and Forecast - by Application
- 9.3.1. Infant Formulae
- 9.3.2. Dietary Supplements
- 9.3.3. Fortified Food and Beverages
- 9.3.4. Pharmaceuticals
- 9.3.5. Other Applications
- 9.1. Market Analysis, Insights and Forecast - by Type
- 10. Middle East and Africa EPA/DHA Ingredients Industry Analysis, Insights and Forecast, 2019-2031
- 10.1. Market Analysis, Insights and Forecast - by Type
- 10.1.1. Eicosapentaenoic Acid (EPA)
- 10.1.2. Docosahexaenoic Acid (DHA)
- 10.2. Market Analysis, Insights and Forecast - by Source
- 10.2.1. Fish Oil
- 10.2.2. Algae Oil
- 10.2.3. Krill Oil
- 10.2.4. Other Sources
- 10.3. Market Analysis, Insights and Forecast - by Application
- 10.3.1. Infant Formulae
- 10.3.2. Dietary Supplements
- 10.3.3. Fortified Food and Beverages
- 10.3.4. Pharmaceuticals
- 10.3.5. Other Applications
- 10.1. Market Analysis, Insights and Forecast - by Type
- 11. Competitive Analysis
- 11.1. Global Market Share Analysis 2024
- 11.2. Company Profiles
- 11.2.1 Koninklijke DSM NV
- 11.2.1.1. Overview
- 11.2.1.2. Products
- 11.2.1.3. SWOT Analysis
- 11.2.1.4. Recent Developments
- 11.2.1.5. Financials (Based on Availability)
- 11.2.2 KD Pharma Group
- 11.2.2.1. Overview
- 11.2.2.2. Products
- 11.2.2.3. SWOT Analysis
- 11.2.2.4. Recent Developments
- 11.2.2.5. Financials (Based on Availability)
- 11.2.3 The Archer Daniels Midland Company
- 11.2.3.1. Overview
- 11.2.3.2. Products
- 11.2.3.3. SWOT Analysis
- 11.2.3.4. Recent Developments
- 11.2.3.5. Financials (Based on Availability)
- 11.2.4 Corbion NV
- 11.2.4.1. Overview
- 11.2.4.2. Products
- 11.2.4.3. SWOT Analysis
- 11.2.4.4. Recent Developments
- 11.2.4.5. Financials (Based on Availability)
- 11.2.5 Novasep Holding SAS
- 11.2.5.1. Overview
- 11.2.5.2. Products
- 11.2.5.3. SWOT Analysis
- 11.2.5.4. Recent Developments
- 11.2.5.5. Financials (Based on Availability)
- 11.2.6 Neptune Wellness Solutions
- 11.2.6.1. Overview
- 11.2.6.2. Products
- 11.2.6.3. SWOT Analysis
- 11.2.6.4. Recent Developments
- 11.2.6.5. Financials (Based on Availability)
- 11.2.7 BASF SE
- 11.2.7.1. Overview
- 11.2.7.2. Products
- 11.2.7.3. SWOT Analysis
- 11.2.7.4. Recent Developments
- 11.2.7.5. Financials (Based on Availability)
- 11.2.8 Omega Protein Corporation
- 11.2.8.1. Overview
- 11.2.8.2. Products
- 11.2.8.3. SWOT Analysis
- 11.2.8.4. Recent Developments
- 11.2.8.5. Financials (Based on Availability)
- 11.2.9 Croda International PLC
- 11.2.9.1. Overview
- 11.2.9.2. Products
- 11.2.9.3. SWOT Analysis
- 11.2.9.4. Recent Developments
- 11.2.9.5. Financials (Based on Availability)
- 11.2.10 Novotech Nutraceuticals*List Not Exhaustive
- 11.2.10.1. Overview
- 11.2.10.2. Products
- 11.2.10.3. SWOT Analysis
- 11.2.10.4. Recent Developments
- 11.2.10.5. Financials (Based on Availability)
- 11.2.1 Koninklijke DSM NV
List of Figures
- Figure 1: Global EPA/DHA Ingredients Industry Revenue Breakdown (Million, %) by Region 2024 & 2032
- Figure 2: Global EPA/DHA Ingredients Industry Volume Breakdown (Billion, %) by Region 2024 & 2032
- Figure 3: North America EPA/DHA Ingredients Industry Revenue (Million), by Type 2024 & 2032
- Figure 4: North America EPA/DHA Ingredients Industry Volume (Billion), by Type 2024 & 2032
- Figure 5: North America EPA/DHA Ingredients Industry Revenue Share (%), by Type 2024 & 2032
- Figure 6: North America EPA/DHA Ingredients Industry Volume Share (%), by Type 2024 & 2032
- Figure 7: North America EPA/DHA Ingredients Industry Revenue (Million), by Source 2024 & 2032
- Figure 8: North America EPA/DHA Ingredients Industry Volume (Billion), by Source 2024 & 2032
- Figure 9: North America EPA/DHA Ingredients Industry Revenue Share (%), by Source 2024 & 2032
- Figure 10: North America EPA/DHA Ingredients Industry Volume Share (%), by Source 2024 & 2032
- Figure 11: North America EPA/DHA Ingredients Industry Revenue (Million), by Application 2024 & 2032
- Figure 12: North America EPA/DHA Ingredients Industry Volume (Billion), by Application 2024 & 2032
- Figure 13: North America EPA/DHA Ingredients Industry Revenue Share (%), by Application 2024 & 2032
- Figure 14: North America EPA/DHA Ingredients Industry Volume Share (%), by Application 2024 & 2032
- Figure 15: North America EPA/DHA Ingredients Industry Revenue (Million), by Country 2024 & 2032
- Figure 16: North America EPA/DHA Ingredients Industry Volume (Billion), by Country 2024 & 2032
- Figure 17: North America EPA/DHA Ingredients Industry Revenue Share (%), by Country 2024 & 2032
- Figure 18: North America EPA/DHA Ingredients Industry Volume Share (%), by Country 2024 & 2032
- Figure 19: Europe EPA/DHA Ingredients Industry Revenue (Million), by Type 2024 & 2032
- Figure 20: Europe EPA/DHA Ingredients Industry Volume (Billion), by Type 2024 & 2032
- Figure 21: Europe EPA/DHA Ingredients Industry Revenue Share (%), by Type 2024 & 2032
- Figure 22: Europe EPA/DHA Ingredients Industry Volume Share (%), by Type 2024 & 2032
- Figure 23: Europe EPA/DHA Ingredients Industry Revenue (Million), by Source 2024 & 2032
- Figure 24: Europe EPA/DHA Ingredients Industry Volume (Billion), by Source 2024 & 2032
- Figure 25: Europe EPA/DHA Ingredients Industry Revenue Share (%), by Source 2024 & 2032
- Figure 26: Europe EPA/DHA Ingredients Industry Volume Share (%), by Source 2024 & 2032
- Figure 27: Europe EPA/DHA Ingredients Industry Revenue (Million), by Application 2024 & 2032
- Figure 28: Europe EPA/DHA Ingredients Industry Volume (Billion), by Application 2024 & 2032
- Figure 29: Europe EPA/DHA Ingredients Industry Revenue Share (%), by Application 2024 & 2032
- Figure 30: Europe EPA/DHA Ingredients Industry Volume Share (%), by Application 2024 & 2032
- Figure 31: Europe EPA/DHA Ingredients Industry Revenue (Million), by Country 2024 & 2032
- Figure 32: Europe EPA/DHA Ingredients Industry Volume (Billion), by Country 2024 & 2032
- Figure 33: Europe EPA/DHA Ingredients Industry Revenue Share (%), by Country 2024 & 2032
- Figure 34: Europe EPA/DHA Ingredients Industry Volume Share (%), by Country 2024 & 2032
- Figure 35: Asia Pacific EPA/DHA Ingredients Industry Revenue (Million), by Type 2024 & 2032
- Figure 36: Asia Pacific EPA/DHA Ingredients Industry Volume (Billion), by Type 2024 & 2032
- Figure 37: Asia Pacific EPA/DHA Ingredients Industry Revenue Share (%), by Type 2024 & 2032
- Figure 38: Asia Pacific EPA/DHA Ingredients Industry Volume Share (%), by Type 2024 & 2032
- Figure 39: Asia Pacific EPA/DHA Ingredients Industry Revenue (Million), by Source 2024 & 2032
- Figure 40: Asia Pacific EPA/DHA Ingredients Industry Volume (Billion), by Source 2024 & 2032
- Figure 41: Asia Pacific EPA/DHA Ingredients Industry Revenue Share (%), by Source 2024 & 2032
- Figure 42: Asia Pacific EPA/DHA Ingredients Industry Volume Share (%), by Source 2024 & 2032
- Figure 43: Asia Pacific EPA/DHA Ingredients Industry Revenue (Million), by Application 2024 & 2032
- Figure 44: Asia Pacific EPA/DHA Ingredients Industry Volume (Billion), by Application 2024 & 2032
- Figure 45: Asia Pacific EPA/DHA Ingredients Industry Revenue Share (%), by Application 2024 & 2032
- Figure 46: Asia Pacific EPA/DHA Ingredients Industry Volume Share (%), by Application 2024 & 2032
- Figure 47: Asia Pacific EPA/DHA Ingredients Industry Revenue (Million), by Country 2024 & 2032
- Figure 48: Asia Pacific EPA/DHA Ingredients Industry Volume (Billion), by Country 2024 & 2032
- Figure 49: Asia Pacific EPA/DHA Ingredients Industry Revenue Share (%), by Country 2024 & 2032
- Figure 50: Asia Pacific EPA/DHA Ingredients Industry Volume Share (%), by Country 2024 & 2032
- Figure 51: South America EPA/DHA Ingredients Industry Revenue (Million), by Type 2024 & 2032
- Figure 52: South America EPA/DHA Ingredients Industry Volume (Billion), by Type 2024 & 2032
- Figure 53: South America EPA/DHA Ingredients Industry Revenue Share (%), by Type 2024 & 2032
- Figure 54: South America EPA/DHA Ingredients Industry Volume Share (%), by Type 2024 & 2032
- Figure 55: South America EPA/DHA Ingredients Industry Revenue (Million), by Source 2024 & 2032
- Figure 56: South America EPA/DHA Ingredients Industry Volume (Billion), by Source 2024 & 2032
- Figure 57: South America EPA/DHA Ingredients Industry Revenue Share (%), by Source 2024 & 2032
- Figure 58: South America EPA/DHA Ingredients Industry Volume Share (%), by Source 2024 & 2032
- Figure 59: South America EPA/DHA Ingredients Industry Revenue (Million), by Application 2024 & 2032
- Figure 60: South America EPA/DHA Ingredients Industry Volume (Billion), by Application 2024 & 2032
- Figure 61: South America EPA/DHA Ingredients Industry Revenue Share (%), by Application 2024 & 2032
- Figure 62: South America EPA/DHA Ingredients Industry Volume Share (%), by Application 2024 & 2032
- Figure 63: South America EPA/DHA Ingredients Industry Revenue (Million), by Country 2024 & 2032
- Figure 64: South America EPA/DHA Ingredients Industry Volume (Billion), by Country 2024 & 2032
- Figure 65: South America EPA/DHA Ingredients Industry Revenue Share (%), by Country 2024 & 2032
- Figure 66: South America EPA/DHA Ingredients Industry Volume Share (%), by Country 2024 & 2032
- Figure 67: Middle East and Africa EPA/DHA Ingredients Industry Revenue (Million), by Type 2024 & 2032
- Figure 68: Middle East and Africa EPA/DHA Ingredients Industry Volume (Billion), by Type 2024 & 2032
- Figure 69: Middle East and Africa EPA/DHA Ingredients Industry Revenue Share (%), by Type 2024 & 2032
- Figure 70: Middle East and Africa EPA/DHA Ingredients Industry Volume Share (%), by Type 2024 & 2032
- Figure 71: Middle East and Africa EPA/DHA Ingredients Industry Revenue (Million), by Source 2024 & 2032
- Figure 72: Middle East and Africa EPA/DHA Ingredients Industry Volume (Billion), by Source 2024 & 2032
- Figure 73: Middle East and Africa EPA/DHA Ingredients Industry Revenue Share (%), by Source 2024 & 2032
- Figure 74: Middle East and Africa EPA/DHA Ingredients Industry Volume Share (%), by Source 2024 & 2032
- Figure 75: Middle East and Africa EPA/DHA Ingredients Industry Revenue (Million), by Application 2024 & 2032
- Figure 76: Middle East and Africa EPA/DHA Ingredients Industry Volume (Billion), by Application 2024 & 2032
- Figure 77: Middle East and Africa EPA/DHA Ingredients Industry Revenue Share (%), by Application 2024 & 2032
- Figure 78: Middle East and Africa EPA/DHA Ingredients Industry Volume Share (%), by Application 2024 & 2032
- Figure 79: Middle East and Africa EPA/DHA Ingredients Industry Revenue (Million), by Country 2024 & 2032
- Figure 80: Middle East and Africa EPA/DHA Ingredients Industry Volume (Billion), by Country 2024 & 2032
- Figure 81: Middle East and Africa EPA/DHA Ingredients Industry Revenue Share (%), by Country 2024 & 2032
- Figure 82: Middle East and Africa EPA/DHA Ingredients Industry Volume Share (%), by Country 2024 & 2032
List of Tables
- Table 1: Global EPA/DHA Ingredients Industry Revenue Million Forecast, by Region 2019 & 2032
- Table 2: Global EPA/DHA Ingredients Industry Volume Billion Forecast, by Region 2019 & 2032
- Table 3: Global EPA/DHA Ingredients Industry Revenue Million Forecast, by Type 2019 & 2032
- Table 4: Global EPA/DHA Ingredients Industry Volume Billion Forecast, by Type 2019 & 2032
- Table 5: Global EPA/DHA Ingredients Industry Revenue Million Forecast, by Source 2019 & 2032
- Table 6: Global EPA/DHA Ingredients Industry Volume Billion Forecast, by Source 2019 & 2032
- Table 7: Global EPA/DHA Ingredients Industry Revenue Million Forecast, by Application 2019 & 2032
- Table 8: Global EPA/DHA Ingredients Industry Volume Billion Forecast, by Application 2019 & 2032
- Table 9: Global EPA/DHA Ingredients Industry Revenue Million Forecast, by Region 2019 & 2032
- Table 10: Global EPA/DHA Ingredients Industry Volume Billion Forecast, by Region 2019 & 2032
- Table 11: Global EPA/DHA Ingredients Industry Revenue Million Forecast, by Type 2019 & 2032
- Table 12: Global EPA/DHA Ingredients Industry Volume Billion Forecast, by Type 2019 & 2032
- Table 13: Global EPA/DHA Ingredients Industry Revenue Million Forecast, by Source 2019 & 2032
- Table 14: Global EPA/DHA Ingredients Industry Volume Billion Forecast, by Source 2019 & 2032
- Table 15: Global EPA/DHA Ingredients Industry Revenue Million Forecast, by Application 2019 & 2032
- Table 16: Global EPA/DHA Ingredients Industry Volume Billion Forecast, by Application 2019 & 2032
- Table 17: Global EPA/DHA Ingredients Industry Revenue Million Forecast, by Country 2019 & 2032
- Table 18: Global EPA/DHA Ingredients Industry Volume Billion Forecast, by Country 2019 & 2032
- Table 19: United States EPA/DHA Ingredients Industry Revenue (Million) Forecast, by Application 2019 & 2032
- Table 20: United States EPA/DHA Ingredients Industry Volume (Billion) Forecast, by Application 2019 & 2032
- Table 21: Mexico EPA/DHA Ingredients Industry Revenue (Million) Forecast, by Application 2019 & 2032
- Table 22: Mexico EPA/DHA Ingredients Industry Volume (Billion) Forecast, by Application 2019 & 2032
- Table 23: Canada EPA/DHA Ingredients Industry Revenue (Million) Forecast, by Application 2019 & 2032
- Table 24: Canada EPA/DHA Ingredients Industry Volume (Billion) Forecast, by Application 2019 & 2032
- Table 25: Rest of North America EPA/DHA Ingredients Industry Revenue (Million) Forecast, by Application 2019 & 2032
- Table 26: Rest of North America EPA/DHA Ingredients Industry Volume (Billion) Forecast, by Application 2019 & 2032
- Table 27: Global EPA/DHA Ingredients Industry Revenue Million Forecast, by Type 2019 & 2032
- Table 28: Global EPA/DHA Ingredients Industry Volume Billion Forecast, by Type 2019 & 2032
- Table 29: Global EPA/DHA Ingredients Industry Revenue Million Forecast, by Source 2019 & 2032
- Table 30: Global EPA/DHA Ingredients Industry Volume Billion Forecast, by Source 2019 & 2032
- Table 31: Global EPA/DHA Ingredients Industry Revenue Million Forecast, by Application 2019 & 2032
- Table 32: Global EPA/DHA Ingredients Industry Volume Billion Forecast, by Application 2019 & 2032
- Table 33: Global EPA/DHA Ingredients Industry Revenue Million Forecast, by Country 2019 & 2032
- Table 34: Global EPA/DHA Ingredients Industry Volume Billion Forecast, by Country 2019 & 2032
- Table 35: Spain EPA/DHA Ingredients Industry Revenue (Million) Forecast, by Application 2019 & 2032
- Table 36: Spain EPA/DHA Ingredients Industry Volume (Billion) Forecast, by Application 2019 & 2032
- Table 37: United Kingdom EPA/DHA Ingredients Industry Revenue (Million) Forecast, by Application 2019 & 2032
- Table 38: United Kingdom EPA/DHA Ingredients Industry Volume (Billion) Forecast, by Application 2019 & 2032
- Table 39: Germany EPA/DHA Ingredients Industry Revenue (Million) Forecast, by Application 2019 & 2032
- Table 40: Germany EPA/DHA Ingredients Industry Volume (Billion) Forecast, by Application 2019 & 2032
- Table 41: France EPA/DHA Ingredients Industry Revenue (Million) Forecast, by Application 2019 & 2032
- Table 42: France EPA/DHA Ingredients Industry Volume (Billion) Forecast, by Application 2019 & 2032
- Table 43: Russia EPA/DHA Ingredients Industry Revenue (Million) Forecast, by Application 2019 & 2032
- Table 44: Russia EPA/DHA Ingredients Industry Volume (Billion) Forecast, by Application 2019 & 2032
- Table 45: Italy EPA/DHA Ingredients Industry Revenue (Million) Forecast, by Application 2019 & 2032
- Table 46: Italy EPA/DHA Ingredients Industry Volume (Billion) Forecast, by Application 2019 & 2032
- Table 47: Rest of Europe EPA/DHA Ingredients Industry Revenue (Million) Forecast, by Application 2019 & 2032
- Table 48: Rest of Europe EPA/DHA Ingredients Industry Volume (Billion) Forecast, by Application 2019 & 2032
- Table 49: Global EPA/DHA Ingredients Industry Revenue Million Forecast, by Type 2019 & 2032
- Table 50: Global EPA/DHA Ingredients Industry Volume Billion Forecast, by Type 2019 & 2032
- Table 51: Global EPA/DHA Ingredients Industry Revenue Million Forecast, by Source 2019 & 2032
- Table 52: Global EPA/DHA Ingredients Industry Volume Billion Forecast, by Source 2019 & 2032
- Table 53: Global EPA/DHA Ingredients Industry Revenue Million Forecast, by Application 2019 & 2032
- Table 54: Global EPA/DHA Ingredients Industry Volume Billion Forecast, by Application 2019 & 2032
- Table 55: Global EPA/DHA Ingredients Industry Revenue Million Forecast, by Country 2019 & 2032
- Table 56: Global EPA/DHA Ingredients Industry Volume Billion Forecast, by Country 2019 & 2032
- Table 57: China EPA/DHA Ingredients Industry Revenue (Million) Forecast, by Application 2019 & 2032
- Table 58: China EPA/DHA Ingredients Industry Volume (Billion) Forecast, by Application 2019 & 2032
- Table 59: Japan EPA/DHA Ingredients Industry Revenue (Million) Forecast, by Application 2019 & 2032
- Table 60: Japan EPA/DHA Ingredients Industry Volume (Billion) Forecast, by Application 2019 & 2032
- Table 61: India EPA/DHA Ingredients Industry Revenue (Million) Forecast, by Application 2019 & 2032
- Table 62: India EPA/DHA Ingredients Industry Volume (Billion) Forecast, by Application 2019 & 2032
- Table 63: Australia EPA/DHA Ingredients Industry Revenue (Million) Forecast, by Application 2019 & 2032
- Table 64: Australia EPA/DHA Ingredients Industry Volume (Billion) Forecast, by Application 2019 & 2032
- Table 65: Rest of Asia Pacific EPA/DHA Ingredients Industry Revenue (Million) Forecast, by Application 2019 & 2032
- Table 66: Rest of Asia Pacific EPA/DHA Ingredients Industry Volume (Billion) Forecast, by Application 2019 & 2032
- Table 67: Global EPA/DHA Ingredients Industry Revenue Million Forecast, by Type 2019 & 2032
- Table 68: Global EPA/DHA Ingredients Industry Volume Billion Forecast, by Type 2019 & 2032
- Table 69: Global EPA/DHA Ingredients Industry Revenue Million Forecast, by Source 2019 & 2032
- Table 70: Global EPA/DHA Ingredients Industry Volume Billion Forecast, by Source 2019 & 2032
- Table 71: Global EPA/DHA Ingredients Industry Revenue Million Forecast, by Application 2019 & 2032
- Table 72: Global EPA/DHA Ingredients Industry Volume Billion Forecast, by Application 2019 & 2032
- Table 73: Global EPA/DHA Ingredients Industry Revenue Million Forecast, by Country 2019 & 2032
- Table 74: Global EPA/DHA Ingredients Industry Volume Billion Forecast, by Country 2019 & 2032
- Table 75: Brazil EPA/DHA Ingredients Industry Revenue (Million) Forecast, by Application 2019 & 2032
- Table 76: Brazil EPA/DHA Ingredients Industry Volume (Billion) Forecast, by Application 2019 & 2032
- Table 77: Argentina EPA/DHA Ingredients Industry Revenue (Million) Forecast, by Application 2019 & 2032
- Table 78: Argentina EPA/DHA Ingredients Industry Volume (Billion) Forecast, by Application 2019 & 2032
- Table 79: Rest of South America EPA/DHA Ingredients Industry Revenue (Million) Forecast, by Application 2019 & 2032
- Table 80: Rest of South America EPA/DHA Ingredients Industry Volume (Billion) Forecast, by Application 2019 & 2032
- Table 81: Global EPA/DHA Ingredients Industry Revenue Million Forecast, by Type 2019 & 2032
- Table 82: Global EPA/DHA Ingredients Industry Volume Billion Forecast, by Type 2019 & 2032
- Table 83: Global EPA/DHA Ingredients Industry Revenue Million Forecast, by Source 2019 & 2032
- Table 84: Global EPA/DHA Ingredients Industry Volume Billion Forecast, by Source 2019 & 2032
- Table 85: Global EPA/DHA Ingredients Industry Revenue Million Forecast, by Application 2019 & 2032
- Table 86: Global EPA/DHA Ingredients Industry Volume Billion Forecast, by Application 2019 & 2032
- Table 87: Global EPA/DHA Ingredients Industry Revenue Million Forecast, by Country 2019 & 2032
- Table 88: Global EPA/DHA Ingredients Industry Volume Billion Forecast, by Country 2019 & 2032
- Table 89: United Arab Emirates EPA/DHA Ingredients Industry Revenue (Million) Forecast, by Application 2019 & 2032
- Table 90: United Arab Emirates EPA/DHA Ingredients Industry Volume (Billion) Forecast, by Application 2019 & 2032
- Table 91: South Africa EPA/DHA Ingredients Industry Revenue (Million) Forecast, by Application 2019 & 2032
- Table 92: South Africa EPA/DHA Ingredients Industry Volume (Billion) Forecast, by Application 2019 & 2032
- Table 93: Rest of Middle East and Africa EPA/DHA Ingredients Industry Revenue (Million) Forecast, by Application 2019 & 2032
- Table 94: Rest of Middle East and Africa EPA/DHA Ingredients Industry Volume (Billion) Forecast, by Application 2019 & 2032
Frequently Asked Questions
1. What is the projected Compound Annual Growth Rate (CAGR) of the EPA/DHA Ingredients Industry?
The projected CAGR is approximately 7.51%.
2. Which companies are prominent players in the EPA/DHA Ingredients Industry?
Key companies in the market include Koninklijke DSM NV, KD Pharma Group, The Archer Daniels Midland Company, Corbion NV, Novasep Holding SAS, Neptune Wellness Solutions, BASF SE, Omega Protein Corporation, Croda International PLC, Novotech Nutraceuticals*List Not Exhaustive.
3. What are the main segments of the EPA/DHA Ingredients Industry?
The market segments include Type, Source, Application.
4. Can you provide details about the market size?
The market size is estimated to be USD 1.92 Million as of 2022.
5. What are some drivers contributing to market growth?
Increasing Awareness Of Health Benefits Associated With EPA And DHA; Demand for Concentrated Forms of Omega 3.
6. What are the notable trends driving market growth?
Increasing Awareness Of Health Benefits Associated With EPA And DHA.
7. Are there any restraints impacting market growth?
Increasing Awareness Of Health Benefits Associated With EPA And DHA; Demand for Concentrated Forms of Omega 3.
8. Can you provide examples of recent developments in the market?
March 2024: DSM-Firmenich partnered with SCN BestCo to launch omega-3 gummies with EPA and DHA ingredients.
9. What pricing options are available for accessing the report?
Pricing options include single-user, multi-user, and enterprise licenses priced at USD 4750, USD 5250, and USD 8750 respectively.
10. Is the market size provided in terms of value or volume?
The market size is provided in terms of value, measured in Million and volume, measured in Billion.
11. Are there any specific market keywords associated with the report?
Yes, the market keyword associated with the report is "EPA/DHA Ingredients Industry," which aids in identifying and referencing the specific market segment covered.
12. How do I determine which pricing option suits my needs best?
The pricing options vary based on user requirements and access needs. Individual users may opt for single-user licenses, while businesses requiring broader access may choose multi-user or enterprise licenses for cost-effective access to the report.
13. Are there any additional resources or data provided in the EPA/DHA Ingredients Industry report?
While the report offers comprehensive insights, it's advisable to review the specific contents or supplementary materials provided to ascertain if additional resources or data are available.
14. How can I stay updated on further developments or reports in the EPA/DHA Ingredients Industry?
To stay informed about further developments, trends, and reports in the EPA/DHA Ingredients Industry, consider subscribing to industry newsletters, following relevant companies and organizations, or regularly checking reputable industry news sources and publications.
Methodology
Step 1 - Identification of Relevant Samples Size from Population Database


Step 2 - Approaches for Defining Global Market Size (Value, Volume* & Price*)

Note*: In applicable scenarios
Step 3 - Data Sources
Primary Research
- Web Analytics
- Survey Reports
- Research Institute
- Latest Research Reports
- Opinion Leaders
Secondary Research
- Annual Reports
- White Paper
- Latest Press Release
- Industry Association
- Paid Database
- Investor Presentations

Step 4 - Data Triangulation
Involves using different sources of information in order to increase the validity of a study
These sources are likely to be stakeholders in a program - participants, other researchers, program staff, other community members, and so on.
Then we put all data in single framework & apply various statistical tools to find out the dynamic on the market.
During the analysis stage, feedback from the stakeholder groups would be compared to determine areas of agreement as well as areas of divergence
