

Key Insights
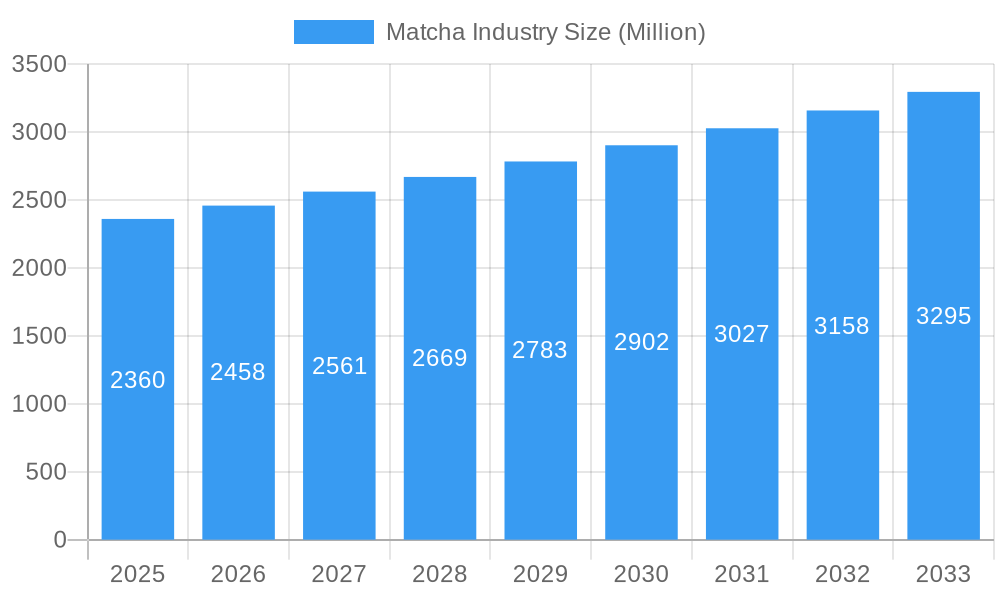
The global matcha market, valued at $2.36 billion in 2025, is projected to experience robust growth, driven by increasing consumer awareness of matcha's health benefits and its versatility in various food and beverage applications. The market's Compound Annual Growth Rate (CAGR) of 4.17% from 2019 to 2024 suggests a steady upward trajectory, indicating sustained demand. Key drivers include the rising popularity of matcha lattes, smoothies, and other innovative products, fueled by social media trends and the health and wellness movement. The growing preference for natural and functional ingredients further bolsters market expansion. While the powder form currently dominates, the liquid segment is experiencing significant growth, driven by convenience and ease of use. Distribution channels are diversifying, with online retail stores witnessing increasing traction, alongside traditional hypermarkets and specialty stores catering to dedicated matcha consumers. The competitive landscape is marked by a mix of established players and emerging brands, emphasizing innovation and product differentiation to secure market share. Regional analysis reveals North America and Asia Pacific as dominant markets, reflecting strong consumer adoption and established production bases. However, untapped potential exists in developing regions, creating opportunities for future expansion.

Matcha Industry Market Size (In Billion)
The forecast period of 2025-2033 anticipates continued market expansion, fueled by ongoing product innovation, expanding distribution networks, and increasing consumer awareness. Factors like fluctuating raw material prices and potential supply chain disruptions could pose challenges. Nevertheless, the market's inherent growth drivers – health consciousness, versatility of application, and evolving consumer preferences – are likely to mitigate these restraints and ensure continued growth over the coming years. Specific segments like flavored matcha and liquid matcha are poised for accelerated expansion, while the strategic use of online platforms will play a critical role in market penetration and brand building. Further research into the specific market segmentation data is recommended to refine strategic market entries for companies.
Matcha Industry Company Market Share
Matcha Industry Market Report: 2019-2033
This comprehensive report provides an in-depth analysis of the global Matcha industry, projecting a market size of $XX Million by 2033. The report covers the period from 2019 to 2033, with 2025 as the base year and a forecast period of 2025-2033. This detailed study offers actionable insights for industry stakeholders, including manufacturers, distributors, and investors, seeking to navigate the dynamic Matcha market. We examine key market segments, leading players like DoMatcha, Mizuba Tea, and AIYA America Inc., and the latest industry developments influencing market growth and future opportunities. Download now to gain a competitive edge!
Matcha Industry Market Concentration & Dynamics
The global Matcha market exhibits a moderately concentrated landscape, with a few key players holding significant market share. While precise figures for individual market share are unavailable publicly, companies like DoMatcha, Mizuba Tea, and AIYA America Inc. are estimated to command a considerable portion of the market, collectively accounting for approximately xx% of the total revenue in 2024. The market dynamics are shaped by a number of factors:
- Innovation Ecosystems: Significant investments in research and development are driving innovation in Matcha production, processing, and product diversification (e.g., flavored Matcha, Matcha-infused beverages).
- Regulatory Frameworks: Government regulations concerning food safety and labeling standards impact Matcha production and distribution channels. Compliance costs and regulatory changes influence market dynamics.
- Substitute Products: The market faces competition from other beverages and health supplements, making innovation and product differentiation crucial.
- End-User Trends: Growing health consciousness and increasing demand for functional beverages are key growth drivers, shifting consumer preference towards organic and premium Matcha products.
- M&A Activities: Recent mergers and acquisitions (M&As), such as Aiya Matcha's acquisition of OMGTea in February 2024, indicate a consolidation trend aimed at expanding market reach and product portfolios. We estimate xx M&A deals within the Matcha industry during the historical period.
Matcha Industry Insights & Trends
The global Matcha market witnessed robust growth during the historical period (2019-2024), expanding at a CAGR of xx%. This growth is projected to continue during the forecast period (2025-2033), with the market size expected to reach $XX Million by 2033. Several factors fuel this growth:
- Market Growth Drivers: Rising disposable incomes, increased awareness of Matcha’s health benefits (antioxidants, etc.), and the growing popularity of Matcha-based beverages in cafes and restaurants.
- Technological Disruptions: Advancements in Matcha processing technologies improve efficiency and product quality. Online retail channels further broaden market access.
- Evolving Consumer Behaviors: Health-conscious consumers are increasingly seeking natural and functional foods, driving demand for premium and organic Matcha products.
Key Markets & Segments Leading Matcha Industry
The Matcha market displays significant regional variations, with [Dominant Region, e.g., North America or Asia] currently leading in terms of consumption and market share. Several factors contribute to the dominance of this region:
- Dominant Region Drivers:
- Strong economic growth and rising disposable incomes.
- Well-developed distribution networks, including hypermarkets, specialty stores, and online retailers.
- High consumer awareness of health and wellness benefits.
Segment Analysis:
- Product Type: The powder form of Matcha dominates, although the liquid segment is experiencing faster growth. Flavored Matcha is gaining traction, fueled by innovation and consumer preference for diverse taste profiles.
- Distribution Channel: Online retail stores are experiencing rapid growth, complementing traditional distribution channels like hypermarkets/supermarkets and specialty stores.
Matcha Industry Product Developments
Recent product innovations highlight the industry’s focus on convenience, premiumization, and diverse applications. The introduction of ready-to-drink Matcha, decaffeinated Matcha, and specialized blends cater to evolving consumer preferences. Technological advancements in processing enhance quality and extend shelf life. This innovation creates competitive advantages and expands market penetration.
Challenges in the Matcha Industry Market
The Matcha industry faces several challenges:
- Supply Chain Issues: Maintaining consistent supply and quality, especially for organic Matcha, can be challenging due to weather patterns and cultivation practices.
- Regulatory Hurdles: Meeting stringent food safety regulations across various markets increases production costs and complexity.
- Competitive Pressures: Competition from substitute products and other beverage categories necessitates constant innovation and brand building. These challenges represent a $xx Million annual impact on industry growth.
Forces Driving Matcha Industry Growth
Several factors propel the long-term growth of the Matcha industry:
- Technological Advancements: Automation in Matcha production increases efficiency and lowers costs.
- Economic Factors: Continued economic growth in key markets, particularly in developing economies, fuels increased spending on premium food and beverages.
- Regulatory Support: Government initiatives promoting healthy eating habits support the growth of the Matcha market.
Long-Term Growth Catalysts in the Matcha Industry
The long-term growth of the Matcha industry is supported by several key factors: strategic partnerships like Aiya Matcha's acquisition of OMGTea, expanding into new markets (e.g., UK), and the introduction of innovative product formats (e.g., ready-to-drink Matcha). These factors ensure sustained industry growth in the coming decade.
Emerging Opportunities in Matcha Industry
Emerging trends present promising opportunities:
- Expansion into New Markets: Untapped markets in emerging economies offer significant growth potential.
- Functional Food Applications: Incorporating Matcha into various food products expands its market reach beyond beverages.
- Sustainability and Ethical Sourcing: Consumers increasingly demand sustainably sourced and ethically produced Matcha.
Leading Players in the Matcha Industry Sector
- DoMatcha
- Mizuba Tea
- PIQUE
- Matcha DNA
- Ippodo Tea
- AIYA America Inc
- AOI Tea
- Breakaway Matcha LLC
- Matcha Maiden
- Midori Spring
Key Milestones in Matcha Industry Industry
- December 2023: Matcha Direct launched Decaff Matcha.
- February 2024: Aiya Matcha acquired a majority stake in OMGTea.
- February 2024: Ippodo Tea launched Premium Select Matcha.
Strategic Outlook for Matcha Industry Market
The Matcha market presents significant growth potential over the forecast period. Strategic initiatives focusing on product innovation, expansion into new markets, and building strong brand identities will be crucial for success. The industry is poised for continued expansion driven by consumer demand for health-conscious and premium products.
Matcha Industry Segmentation
-
1. Product Type
- 1.1. Regular
- 1.2. Flavored
-
2. Form
- 2.1. Powder
- 2.2. Liquid
-
3. Distribution Channel
- 3.1. Hypermarket/Supermarket
- 3.2. Speciality Stores
- 3.3. Online Retail Stores
- 3.4. Others
Matcha Industry Segmentation By Geography
-
1. North America
- 1.1. United States
- 1.2. Canada
- 1.3. Mexico
- 1.4. Rest of North America
-
2. Europe
- 2.1. United Kingdom
- 2.2. Germany
- 2.3. Spain
- 2.4. France
- 2.5. Italy
- 2.6. Russia
- 2.7. Rest of Europe
-
3. Asia Pacific
- 3.1. China
- 3.2. Japan
- 3.3. India
- 3.4. Australia
- 3.5. Rest of Asia Pacific
-
4. South America
- 4.1. Brazil
- 4.2. Argentina
- 4.3. Rest of South America
- 5. Middle East
-
6. United Arab Emirates
- 6.1. South Africa
- 6.2. Rest of Middle East
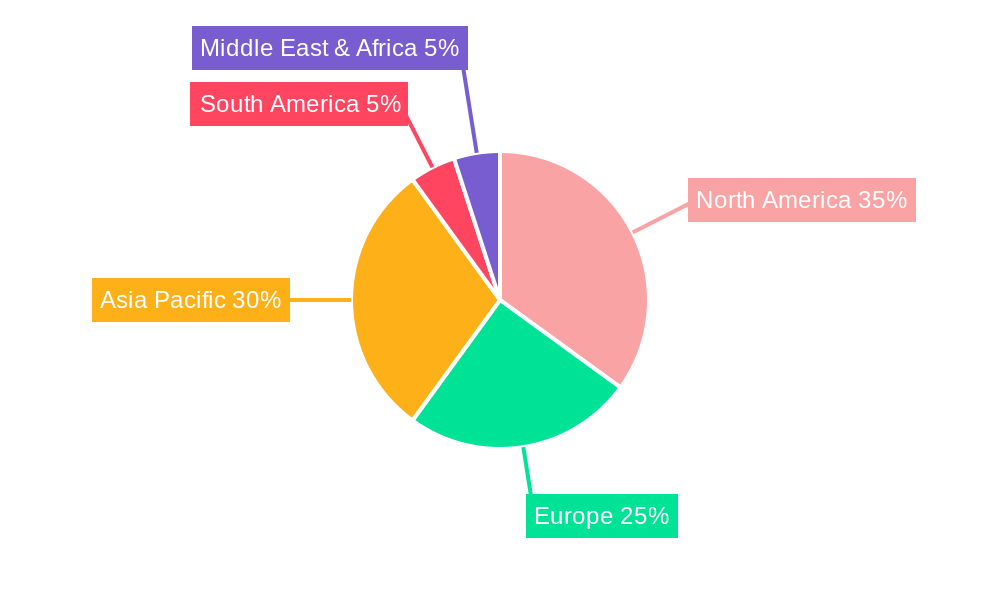
Matcha Industry Regional Market Share
Geographic Coverage of Matcha Industry
Matcha Industry REPORT HIGHLIGHTS
| Aspects | Details |
|---|---|
| Study Period | 2020-2034 |
| Base Year | 2025 |
| Estimated Year | 2026 |
| Forecast Period | 2026-2034 |
| Historical Period | 2020-2025 |
| Growth Rate | CAGR of 4.17% from 2020-2034 |
| Segmentation |
|
Table of Contents
- 1. Introduction
- 1.1. Research Scope
- 1.2. Market Segmentation
- 1.3. Research Objective
- 1.4. Definitions and Assumptions
- 2. Executive Summary
- 2.1. Market Snapshot
- 3. Market Dynamics
- 3.1. Market Drivers
- 3.2. Market Restrains
- 3.3. Market Trends
- 3.4. Market Opportunities
- 4. Market Factor Analysis
- 4.1. Porters Five Forces
- 4.1.1. Bargaining Power of Suppliers
- 4.1.2. Bargaining Power of Buyers
- 4.1.3. Threat of New Entrants
- 4.1.4. Threat of Substitutes
- 4.1.5. Competitive Rivalry
- 4.2. PESTEL analysis
- 4.3. BCG Analysis
- 4.3.1. Stars (High Growth, High Market Share)
- 4.3.2. Cash Cows (Low Growth, High Market Share)
- 4.3.3. Question Mark (High Growth, Low Market Share)
- 4.3.4. Dogs (Low Growth, Low Market Share)
- 4.4. Ansoff Matrix Analysis
- 4.5. Supply Chain Analysis
- 4.6. Regulatory Landscape
- 4.7. Current Market Potential and Opportunity Assessment (TAM–SAM–SOM Framework)
- 4.8. MSR Analyst Note
- 4.1. Porters Five Forces
- 5. Market Analysis, Insights and Forecast 2021-2033
- 5.1. Market Analysis, Insights and Forecast - by Product Type
- 5.1.1. Regular
- 5.1.2. Flavored
- 5.2. Market Analysis, Insights and Forecast - by Form
- 5.2.1. Powder
- 5.2.2. Liquid
- 5.3. Market Analysis, Insights and Forecast - by Distribution Channel
- 5.3.1. Hypermarket/Supermarket
- 5.3.2. Speciality Stores
- 5.3.3. Online Retail Stores
- 5.3.4. Others
- 5.4. Market Analysis, Insights and Forecast - by Region
- 5.4.1. North America
- 5.4.2. Europe
- 5.4.3. Asia Pacific
- 5.4.4. South America
- 5.4.5. Middle East
- 5.4.6. United Arab Emirates
- 5.1. Market Analysis, Insights and Forecast - by Product Type
- 6. Global Matcha Industry Analysis, Insights and Forecast, 2021-2033
- 6.1. Market Analysis, Insights and Forecast - by Product Type
- 6.1.1. Regular
- 6.1.2. Flavored
- 6.2. Market Analysis, Insights and Forecast - by Form
- 6.2.1. Powder
- 6.2.2. Liquid
- 6.3. Market Analysis, Insights and Forecast - by Distribution Channel
- 6.3.1. Hypermarket/Supermarket
- 6.3.2. Speciality Stores
- 6.3.3. Online Retail Stores
- 6.3.4. Others
- 6.1. Market Analysis, Insights and Forecast - by Product Type
- 7. North America Matcha Industry Analysis, Insights and Forecast, 2020-2032
- 7.1. Market Analysis, Insights and Forecast - by Product Type
- 7.1.1. Regular
- 7.1.2. Flavored
- 7.2. Market Analysis, Insights and Forecast - by Form
- 7.2.1. Powder
- 7.2.2. Liquid
- 7.3. Market Analysis, Insights and Forecast - by Distribution Channel
- 7.3.1. Hypermarket/Supermarket
- 7.3.2. Speciality Stores
- 7.3.3. Online Retail Stores
- 7.3.4. Others
- 7.1. Market Analysis, Insights and Forecast - by Product Type
- 8. Europe Matcha Industry Analysis, Insights and Forecast, 2020-2032
- 8.1. Market Analysis, Insights and Forecast - by Product Type
- 8.1.1. Regular
- 8.1.2. Flavored
- 8.2. Market Analysis, Insights and Forecast - by Form
- 8.2.1. Powder
- 8.2.2. Liquid
- 8.3. Market Analysis, Insights and Forecast - by Distribution Channel
- 8.3.1. Hypermarket/Supermarket
- 8.3.2. Speciality Stores
- 8.3.3. Online Retail Stores
- 8.3.4. Others
- 8.1. Market Analysis, Insights and Forecast - by Product Type
- 9. Asia Pacific Matcha Industry Analysis, Insights and Forecast, 2020-2032
- 9.1. Market Analysis, Insights and Forecast - by Product Type
- 9.1.1. Regular
- 9.1.2. Flavored
- 9.2. Market Analysis, Insights and Forecast - by Form
- 9.2.1. Powder
- 9.2.2. Liquid
- 9.3. Market Analysis, Insights and Forecast - by Distribution Channel
- 9.3.1. Hypermarket/Supermarket
- 9.3.2. Speciality Stores
- 9.3.3. Online Retail Stores
- 9.3.4. Others
- 9.1. Market Analysis, Insights and Forecast - by Product Type
- 10. South America Matcha Industry Analysis, Insights and Forecast, 2020-2032
- 10.1. Market Analysis, Insights and Forecast - by Product Type
- 10.1.1. Regular
- 10.1.2. Flavored
- 10.2. Market Analysis, Insights and Forecast - by Form
- 10.2.1. Powder
- 10.2.2. Liquid
- 10.3. Market Analysis, Insights and Forecast - by Distribution Channel
- 10.3.1. Hypermarket/Supermarket
- 10.3.2. Speciality Stores
- 10.3.3. Online Retail Stores
- 10.3.4. Others
- 10.1. Market Analysis, Insights and Forecast - by Product Type
- 11. Middle East Matcha Industry Analysis, Insights and Forecast, 2020-2032
- 11.1. Market Analysis, Insights and Forecast - by Product Type
- 11.1.1. Regular
- 11.1.2. Flavored
- 11.2. Market Analysis, Insights and Forecast - by Form
- 11.2.1. Powder
- 11.2.2. Liquid
- 11.3. Market Analysis, Insights and Forecast - by Distribution Channel
- 11.3.1. Hypermarket/Supermarket
- 11.3.2. Speciality Stores
- 11.3.3. Online Retail Stores
- 11.3.4. Others
- 11.1. Market Analysis, Insights and Forecast - by Product Type
- 12. United Arab Emirates Matcha Industry Analysis, Insights and Forecast, 2020-2032
- 12.1. Market Analysis, Insights and Forecast - by Product Type
- 12.1.1. Regular
- 12.1.2. Flavored
- 12.2. Market Analysis, Insights and Forecast - by Form
- 12.2.1. Powder
- 12.2.2. Liquid
- 12.3. Market Analysis, Insights and Forecast - by Distribution Channel
- 12.3.1. Hypermarket/Supermarket
- 12.3.2. Speciality Stores
- 12.3.3. Online Retail Stores
- 12.3.4. Others
- 12.1. Market Analysis, Insights and Forecast - by Product Type
- 13. Competitive Analysis
- 13.1. Company Profiles
- 13.1.1 DoMatcha
- 13.1.1.1. Company Overview
- 13.1.1.2. Products
- 13.1.1.3. Company Financials
- 13.1.1.4. SWOT Analysis
- 13.1.2 Mizuba Tea
- 13.1.2.1. Company Overview
- 13.1.2.2. Products
- 13.1.2.3. Company Financials
- 13.1.2.4. SWOT Analysis
- 13.1.3 PIQUE*List Not Exhaustive
- 13.1.3.1. Company Overview
- 13.1.3.2. Products
- 13.1.3.3. Company Financials
- 13.1.3.4. SWOT Analysis
- 13.1.4 Matcha DNA
- 13.1.4.1. Company Overview
- 13.1.4.2. Products
- 13.1.4.3. Company Financials
- 13.1.4.4. SWOT Analysis
- 13.1.5 Ippodo Tea
- 13.1.5.1. Company Overview
- 13.1.5.2. Products
- 13.1.5.3. Company Financials
- 13.1.5.4. SWOT Analysis
- 13.1.6 AIYA America Inc
- 13.1.6.1. Company Overview
- 13.1.6.2. Products
- 13.1.6.3. Company Financials
- 13.1.6.4. SWOT Analysis
- 13.1.7 AOI Tea
- 13.1.7.1. Company Overview
- 13.1.7.2. Products
- 13.1.7.3. Company Financials
- 13.1.7.4. SWOT Analysis
- 13.1.8 Breakaway Matcha LLC
- 13.1.8.1. Company Overview
- 13.1.8.2. Products
- 13.1.8.3. Company Financials
- 13.1.8.4. SWOT Analysis
- 13.1.9 Matcha Maiden
- 13.1.9.1. Company Overview
- 13.1.9.2. Products
- 13.1.9.3. Company Financials
- 13.1.9.4. SWOT Analysis
- 13.1.10 Midori Spring
- 13.1.10.1. Company Overview
- 13.1.10.2. Products
- 13.1.10.3. Company Financials
- 13.1.10.4. SWOT Analysis
- 13.1.1 DoMatcha
- 13.2. Market Entropy
- 13.2.1 Company's Key Areas Served
- 13.2.2 Recent Developments
- 13.3. Company Market Share Analysis 2025
- 13.3.1 Top 5 Companies Market Share Analysis
- 13.3.2 Top 3 Companies Market Share Analysis
- 13.4. List of Potential Customers
- 14. Research Methodology
List of Figures
- Figure 1: Global Matcha Industry Revenue Breakdown (Million, %) by Region 2025 & 2033
- Figure 2: North America Matcha Industry Revenue (Million), by Product Type 2025 & 2033
- Figure 3: North America Matcha Industry Revenue Share (%), by Product Type 2025 & 2033
- Figure 4: North America Matcha Industry Revenue (Million), by Form 2025 & 2033
- Figure 5: North America Matcha Industry Revenue Share (%), by Form 2025 & 2033
- Figure 6: North America Matcha Industry Revenue (Million), by Distribution Channel 2025 & 2033
- Figure 7: North America Matcha Industry Revenue Share (%), by Distribution Channel 2025 & 2033
- Figure 8: North America Matcha Industry Revenue (Million), by Country 2025 & 2033
- Figure 9: North America Matcha Industry Revenue Share (%), by Country 2025 & 2033
- Figure 10: Europe Matcha Industry Revenue (Million), by Product Type 2025 & 2033
- Figure 11: Europe Matcha Industry Revenue Share (%), by Product Type 2025 & 2033
- Figure 12: Europe Matcha Industry Revenue (Million), by Form 2025 & 2033
- Figure 13: Europe Matcha Industry Revenue Share (%), by Form 2025 & 2033
- Figure 14: Europe Matcha Industry Revenue (Million), by Distribution Channel 2025 & 2033
- Figure 15: Europe Matcha Industry Revenue Share (%), by Distribution Channel 2025 & 2033
- Figure 16: Europe Matcha Industry Revenue (Million), by Country 2025 & 2033
- Figure 17: Europe Matcha Industry Revenue Share (%), by Country 2025 & 2033
- Figure 18: Asia Pacific Matcha Industry Revenue (Million), by Product Type 2025 & 2033
- Figure 19: Asia Pacific Matcha Industry Revenue Share (%), by Product Type 2025 & 2033
- Figure 20: Asia Pacific Matcha Industry Revenue (Million), by Form 2025 & 2033
- Figure 21: Asia Pacific Matcha Industry Revenue Share (%), by Form 2025 & 2033
- Figure 22: Asia Pacific Matcha Industry Revenue (Million), by Distribution Channel 2025 & 2033
- Figure 23: Asia Pacific Matcha Industry Revenue Share (%), by Distribution Channel 2025 & 2033
- Figure 24: Asia Pacific Matcha Industry Revenue (Million), by Country 2025 & 2033
- Figure 25: Asia Pacific Matcha Industry Revenue Share (%), by Country 2025 & 2033
- Figure 26: South America Matcha Industry Revenue (Million), by Product Type 2025 & 2033
- Figure 27: South America Matcha Industry Revenue Share (%), by Product Type 2025 & 2033
- Figure 28: South America Matcha Industry Revenue (Million), by Form 2025 & 2033
- Figure 29: South America Matcha Industry Revenue Share (%), by Form 2025 & 2033
- Figure 30: South America Matcha Industry Revenue (Million), by Distribution Channel 2025 & 2033
- Figure 31: South America Matcha Industry Revenue Share (%), by Distribution Channel 2025 & 2033
- Figure 32: South America Matcha Industry Revenue (Million), by Country 2025 & 2033
- Figure 33: South America Matcha Industry Revenue Share (%), by Country 2025 & 2033
- Figure 34: Middle East Matcha Industry Revenue (Million), by Product Type 2025 & 2033
- Figure 35: Middle East Matcha Industry Revenue Share (%), by Product Type 2025 & 2033
- Figure 36: Middle East Matcha Industry Revenue (Million), by Form 2025 & 2033
- Figure 37: Middle East Matcha Industry Revenue Share (%), by Form 2025 & 2033
- Figure 38: Middle East Matcha Industry Revenue (Million), by Distribution Channel 2025 & 2033
- Figure 39: Middle East Matcha Industry Revenue Share (%), by Distribution Channel 2025 & 2033
- Figure 40: Middle East Matcha Industry Revenue (Million), by Country 2025 & 2033
- Figure 41: Middle East Matcha Industry Revenue Share (%), by Country 2025 & 2033
- Figure 42: United Arab Emirates Matcha Industry Revenue (Million), by Product Type 2025 & 2033
- Figure 43: United Arab Emirates Matcha Industry Revenue Share (%), by Product Type 2025 & 2033
- Figure 44: United Arab Emirates Matcha Industry Revenue (Million), by Form 2025 & 2033
- Figure 45: United Arab Emirates Matcha Industry Revenue Share (%), by Form 2025 & 2033
- Figure 46: United Arab Emirates Matcha Industry Revenue (Million), by Distribution Channel 2025 & 2033
- Figure 47: United Arab Emirates Matcha Industry Revenue Share (%), by Distribution Channel 2025 & 2033
- Figure 48: United Arab Emirates Matcha Industry Revenue (Million), by Country 2025 & 2033
- Figure 49: United Arab Emirates Matcha Industry Revenue Share (%), by Country 2025 & 2033
List of Tables
- Table 1: Global Matcha Industry Revenue Million Forecast, by Product Type 2020 & 2033
- Table 2: Global Matcha Industry Revenue Million Forecast, by Form 2020 & 2033
- Table 3: Global Matcha Industry Revenue Million Forecast, by Distribution Channel 2020 & 2033
- Table 4: Global Matcha Industry Revenue Million Forecast, by Region 2020 & 2033
- Table 5: Global Matcha Industry Revenue Million Forecast, by Product Type 2020 & 2033
- Table 6: Global Matcha Industry Revenue Million Forecast, by Form 2020 & 2033
- Table 7: Global Matcha Industry Revenue Million Forecast, by Distribution Channel 2020 & 2033
- Table 8: Global Matcha Industry Revenue Million Forecast, by Country 2020 & 2033
- Table 9: United States Matcha Industry Revenue (Million) Forecast, by Application 2020 & 2033
- Table 10: Canada Matcha Industry Revenue (Million) Forecast, by Application 2020 & 2033
- Table 11: Mexico Matcha Industry Revenue (Million) Forecast, by Application 2020 & 2033
- Table 12: Rest of North America Matcha Industry Revenue (Million) Forecast, by Application 2020 & 2033
- Table 13: Global Matcha Industry Revenue Million Forecast, by Product Type 2020 & 2033
- Table 14: Global Matcha Industry Revenue Million Forecast, by Form 2020 & 2033
- Table 15: Global Matcha Industry Revenue Million Forecast, by Distribution Channel 2020 & 2033
- Table 16: Global Matcha Industry Revenue Million Forecast, by Country 2020 & 2033
- Table 17: United Kingdom Matcha Industry Revenue (Million) Forecast, by Application 2020 & 2033
- Table 18: Germany Matcha Industry Revenue (Million) Forecast, by Application 2020 & 2033
- Table 19: Spain Matcha Industry Revenue (Million) Forecast, by Application 2020 & 2033
- Table 20: France Matcha Industry Revenue (Million) Forecast, by Application 2020 & 2033
- Table 21: Italy Matcha Industry Revenue (Million) Forecast, by Application 2020 & 2033
- Table 22: Russia Matcha Industry Revenue (Million) Forecast, by Application 2020 & 2033
- Table 23: Rest of Europe Matcha Industry Revenue (Million) Forecast, by Application 2020 & 2033
- Table 24: Global Matcha Industry Revenue Million Forecast, by Product Type 2020 & 2033
- Table 25: Global Matcha Industry Revenue Million Forecast, by Form 2020 & 2033
- Table 26: Global Matcha Industry Revenue Million Forecast, by Distribution Channel 2020 & 2033
- Table 27: Global Matcha Industry Revenue Million Forecast, by Country 2020 & 2033
- Table 28: China Matcha Industry Revenue (Million) Forecast, by Application 2020 & 2033
- Table 29: Japan Matcha Industry Revenue (Million) Forecast, by Application 2020 & 2033
- Table 30: India Matcha Industry Revenue (Million) Forecast, by Application 2020 & 2033
- Table 31: Australia Matcha Industry Revenue (Million) Forecast, by Application 2020 & 2033
- Table 32: Rest of Asia Pacific Matcha Industry Revenue (Million) Forecast, by Application 2020 & 2033
- Table 33: Global Matcha Industry Revenue Million Forecast, by Product Type 2020 & 2033
- Table 34: Global Matcha Industry Revenue Million Forecast, by Form 2020 & 2033
- Table 35: Global Matcha Industry Revenue Million Forecast, by Distribution Channel 2020 & 2033
- Table 36: Global Matcha Industry Revenue Million Forecast, by Country 2020 & 2033
- Table 37: Brazil Matcha Industry Revenue (Million) Forecast, by Application 2020 & 2033
- Table 38: Argentina Matcha Industry Revenue (Million) Forecast, by Application 2020 & 2033
- Table 39: Rest of South America Matcha Industry Revenue (Million) Forecast, by Application 2020 & 2033
- Table 40: Global Matcha Industry Revenue Million Forecast, by Product Type 2020 & 2033
- Table 41: Global Matcha Industry Revenue Million Forecast, by Form 2020 & 2033
- Table 42: Global Matcha Industry Revenue Million Forecast, by Distribution Channel 2020 & 2033
- Table 43: Global Matcha Industry Revenue Million Forecast, by Country 2020 & 2033
- Table 44: Global Matcha Industry Revenue Million Forecast, by Product Type 2020 & 2033
- Table 45: Global Matcha Industry Revenue Million Forecast, by Form 2020 & 2033
- Table 46: Global Matcha Industry Revenue Million Forecast, by Distribution Channel 2020 & 2033
- Table 47: Global Matcha Industry Revenue Million Forecast, by Country 2020 & 2033
- Table 48: South Africa Matcha Industry Revenue (Million) Forecast, by Application 2020 & 2033
- Table 49: Rest of Middle East Matcha Industry Revenue (Million) Forecast, by Application 2020 & 2033
Frequently Asked Questions
1. What is the projected Compound Annual Growth Rate (CAGR) of the Matcha Industry?
The projected CAGR is approximately 4.17%.
2. Which companies are prominent players in the Matcha Industry?
Key companies in the market include DoMatcha, Mizuba Tea, PIQUE*List Not Exhaustive, Matcha DNA, Ippodo Tea, AIYA America Inc, AOI Tea, Breakaway Matcha LLC, Matcha Maiden, Midori Spring.
3. What are the main segments of the Matcha Industry?
The market segments include Product Type, Form, Distribution Channel.
4. Can you provide details about the market size?
The market size is estimated to be USD 2.36 Million as of 2022.
5. What are some drivers contributing to market growth?
Increasing Focus On Health and Wellness; Surge in Product Innovation.
6. What are the notable trends driving market growth?
Increasing Focus On Health and Wellness.
7. Are there any restraints impacting market growth?
Presence of Substitutes.
8. Can you provide examples of recent developments in the market?
February 2024: Aiya Matcha acquired a majority stake in OMGTea to bring matcha to the masses. This collaboration aimed to expand and build a more extensive presence in the United Kingdom.
9. What pricing options are available for accessing the report?
Pricing options include single-user, multi-user, and enterprise licenses priced at USD 4750, USD 5250, and USD 8750 respectively.
10. Is the market size provided in terms of value or volume?
The market size is provided in terms of value, measured in Million.
11. Are there any specific market keywords associated with the report?
Yes, the market keyword associated with the report is "Matcha Industry," which aids in identifying and referencing the specific market segment covered.
12. How do I determine which pricing option suits my needs best?
The pricing options vary based on user requirements and access needs. Individual users may opt for single-user licenses, while businesses requiring broader access may choose multi-user or enterprise licenses for cost-effective access to the report.
13. Are there any additional resources or data provided in the Matcha Industry report?
While the report offers comprehensive insights, it's advisable to review the specific contents or supplementary materials provided to ascertain if additional resources or data are available.
14. How can I stay updated on further developments or reports in the Matcha Industry?
To stay informed about further developments, trends, and reports in the Matcha Industry, consider subscribing to industry newsletters, following relevant companies and organizations, or regularly checking reputable industry news sources and publications.
Methodology
Step 1 - Identification of Relevant Samples Size from Population Database


Step 2 - Approaches for Defining Global Market Size (Value, Volume* & Price*)

Note*: In applicable scenarios
Step 3 - Data Sources
Primary Research
- Web Analytics
- Survey Reports
- Research Institute
- Latest Research Reports
- Opinion Leaders
Secondary Research
- Annual Reports
- White Paper
- Latest Press Release
- Industry Association
- Paid Database
- Investor Presentations

Step 4 - Data Triangulation
Involves using different sources of information in order to increase the validity of a study
These sources are likely to be stakeholders in a program - participants, other researchers, program staff, other community members, and so on.
Then we put all data in single framework & apply various statistical tools to find out the dynamic on the market.
During the analysis stage, feedback from the stakeholder groups would be compared to determine areas of agreement as well as areas of divergence