

Key Insights
The Highly Potent Active Pharmaceutical Ingredients (HPAPI) market is poised for significant expansion, driven by the increasing prevalence of chronic diseases and the growing demand for targeted therapies, particularly in oncology. The market is projected to reach an estimated USD 144.2 billion in 2025, exhibiting a robust Compound Annual Growth Rate (CAGR) of 6.6% during the forecast period of 2025-2033. This growth is underpinned by substantial investments in research and development by pharmaceutical giants and a burgeoning pipeline of complex therapeutic molecules requiring specialized manufacturing capabilities. The advancement of synthetic chemistry and innovative extraction techniques further fuels the market by enabling the efficient and scalable production of these high-value compounds. Key applications, including cancer therapy, respiratory therapy, and central nervous system therapy, are witnessing accelerated adoption of HPAPIs due to their superior efficacy and reduced side effects compared to conventional treatments.
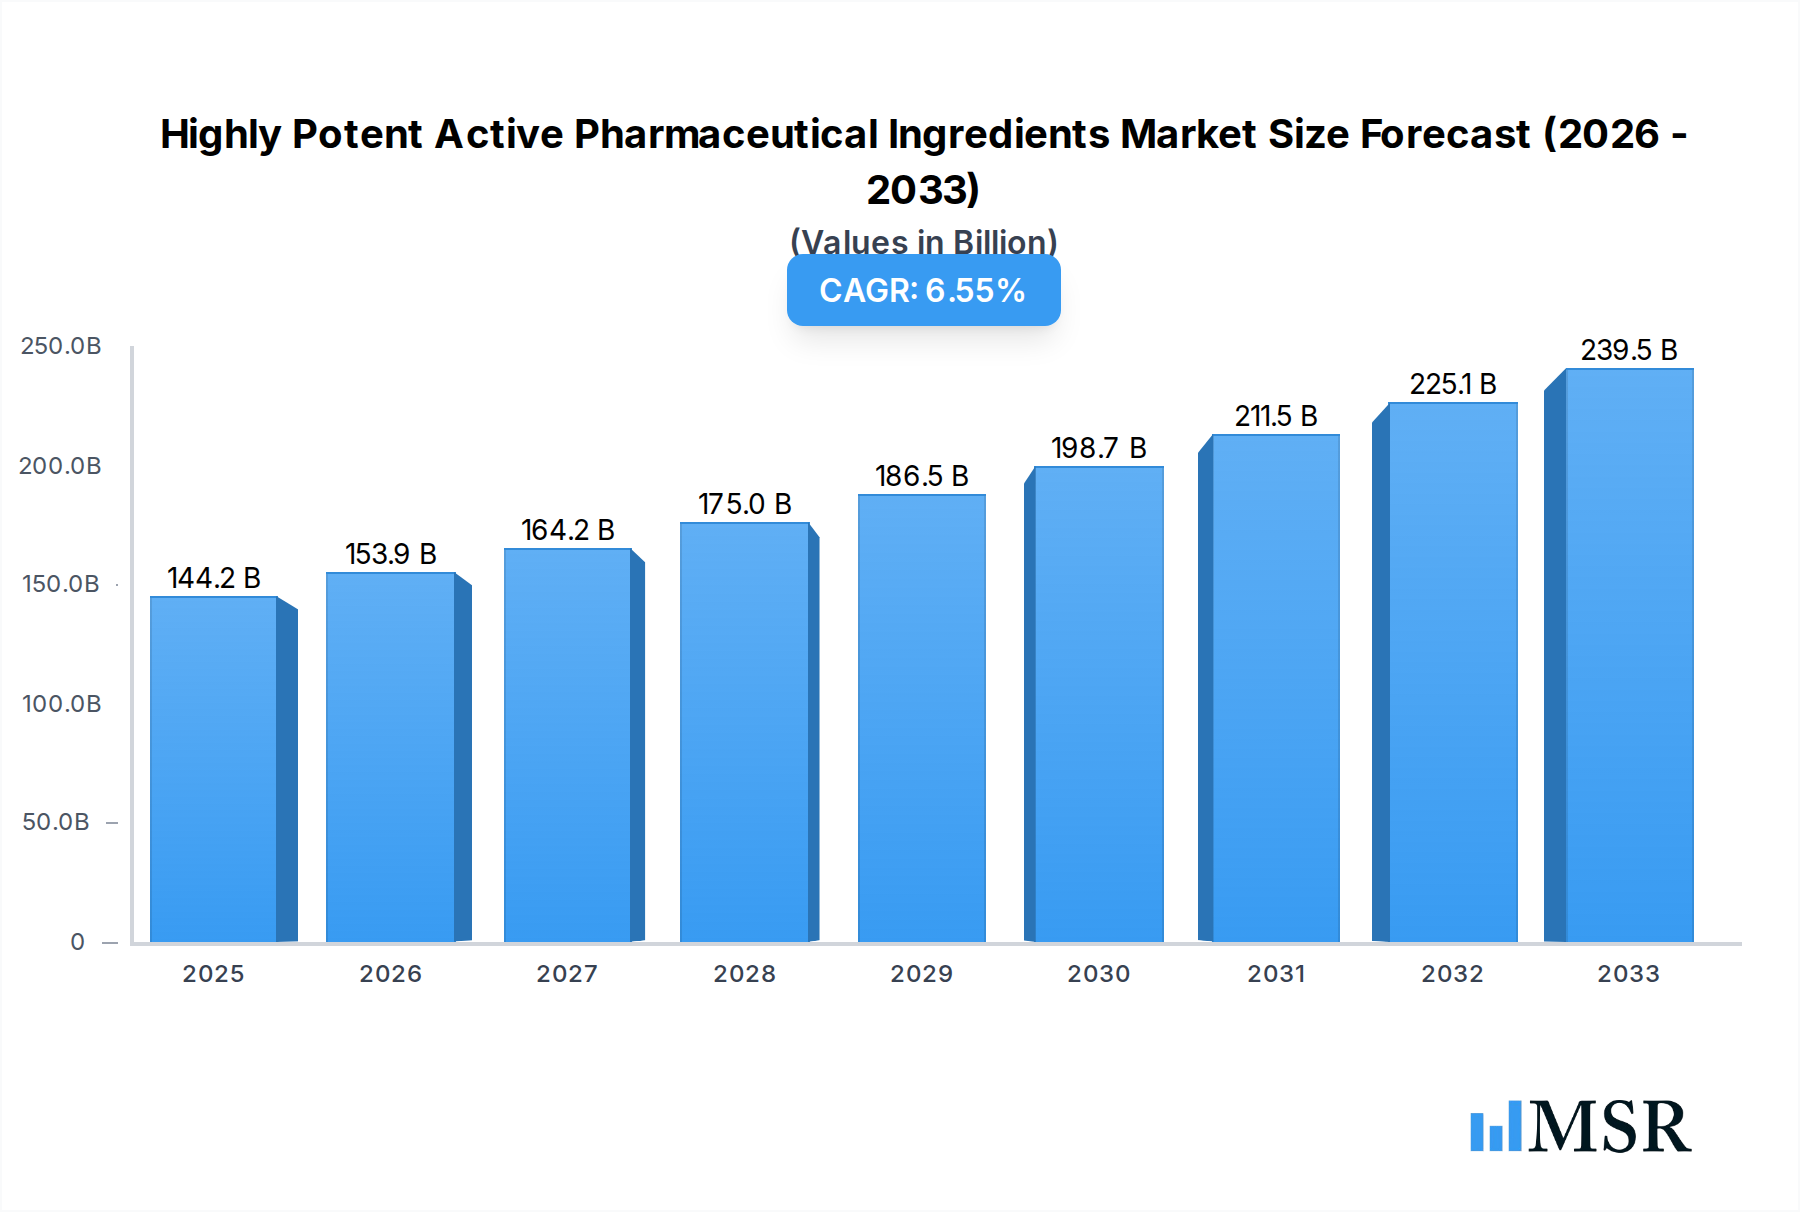
Highly Potent Active Pharmaceutical Ingredients Market Size (In Billion)
The market's trajectory is further shaped by evolving manufacturing trends, with a notable shift towards sophisticated chemical synthesis methods offering greater control and purity. While plant and animal extraction remain relevant for certain compounds, the focus is increasingly on precision manufacturing. However, the market faces certain restraints, including the high cost of specialized manufacturing infrastructure and stringent regulatory requirements for handling highly potent substances, which necessitate significant capital investment and expertise. Despite these challenges, strategic collaborations between contract development and manufacturing organizations (CDMOs) and pharmaceutical companies are mitigating some of these barriers. Geographically, North America and Europe currently dominate the market due to established healthcare ecosystems and significant R&D spending. The Asia Pacific region, particularly China and India, is emerging as a dynamic growth area, driven by expanding pharmaceutical manufacturing capabilities and a growing domestic demand for advanced therapies.

Highly Potent Active Pharmaceutical Ingredients Company Market Share
Highly Potent Active Pharmaceutical Ingredients Market Concentration & Dynamics
The global Highly Potent Active Pharmaceutical Ingredients (HPAPI) market exhibits a moderate to high concentration, characterized by the presence of established pharmaceutical giants and specialized contract development and manufacturing organizations (CDMOs). Leading players like Pfizer, Merck, Lonza Group AG, Teva API, and Cambrex command significant market share, driven by their extensive R&D capabilities, robust manufacturing infrastructure, and strong regulatory compliance. The innovation ecosystem thrives on collaborations between pharmaceutical companies and CDMOs, facilitating the development of complex HPAPIs for cancer therapy, respiratory therapy, and central nervous system (CNS) therapy. Regulatory frameworks, particularly stringent for HPAPIs due to their toxicity, shape market entry and competition, favoring companies with established containment technologies and quality management systems. Substitute products, while limited for highly specialized HPAPIs, may emerge from advancements in biologics and gene therapies, influencing long-term market dynamics. End-user trends indicate a growing demand for targeted therapies and personalized medicine, directly impacting HPAPI requirements. Merger and acquisition (M&A) activities, with an estimated X number of deals valued at over $XX billion, are prevalent as larger companies seek to integrate specialized capabilities and smaller players aim for scale.
- Market Share Dominance: Major players hold an estimated collective market share of over 70%.
- M&A Deal Count: Over the historical period, an estimated XX deals have been recorded.
- Innovation Focus: Partnerships for novel HPAPI synthesis and containment solutions are key.
- Regulatory Impact: Strict GMP and EHS guidelines are critical competitive differentiators.
Highly Potent Active Pharmaceutical Ingredients Industry Insights & Trends
The global Highly Potent Active Pharmaceutical Ingredients (HPAPI) market is poised for substantial growth, projected to reach a market size of over $XX billion by 2033, expanding at a compound annual growth rate (CAGR) of approximately XX% from the base year 2025. This robust expansion is fueled by a confluence of factors, including the escalating prevalence of chronic diseases like cancer, the increasing development of highly targeted therapies, and advancements in pharmaceutical manufacturing technologies. The rise of cancer therapy as a dominant application segment, accounting for an estimated XX% of the market share, underscores the critical role of HPAPIs in oncology drug development. Furthermore, the growing demand for respiratory therapy and central nervous system (CNS) therapy treatments is also contributing significantly to market expansion.
Technological disruptions are revolutionizing HPAPI production. The increasing adoption of chemical synthesis techniques, particularly complex multi-step synthesis and continuous manufacturing processes, allows for greater efficiency, purity, and scalability. While plant and animal extraction methods remain relevant for certain niche applications, chemical synthesis is the predominant type, representing an estimated XX% of the market. Innovations in containment technologies, such as isolator technology and advanced closed-system transfers, are crucial for safely handling these highly potent compounds, minimizing operator exposure and environmental contamination. This focus on safety and containment is paramount, driving investments in specialized manufacturing facilities and skilled personnel.
Evolving consumer behaviors, particularly the growing patient demand for more effective and less toxic treatment options, are indirectly influencing the HPAPI market. As pharmaceutical companies strive to develop drugs with improved efficacy and reduced side effects, the reliance on highly potent and targeted active ingredients intensifies. The increasing outsourcing of HPAPI manufacturing to specialized CDMOs by both large pharmaceutical corporations and emerging biotechs is another significant trend, allowing companies to leverage expertise, reduce capital expenditure, and accelerate drug development timelines. The global market for HPAPIs is expected to witness sustained growth, driven by an aging population, increasing healthcare expenditure, and a continuous pipeline of novel therapeutic candidates requiring high-potency ingredients. The estimated market size in 2025 stands at over $XX billion, with projections indicating a steady upward trajectory. The historical period (2019-2024) has laid the groundwork for this accelerated growth, marked by significant investments in R&D and manufacturing capabilities.
- Market Size (2025): $XX Billion
- CAGR (2025-2033): XX%
- Dominant Application: Cancer Therapy (XX% Market Share)
- Predominant Type: Chemical Synthesis (XX% Market Share)
- Key Technological Advancement: Advanced Containment Systems
- Outsourcing Trend: Increased reliance on specialized CDMOs.
Key Markets & Segments Leading Highly Potent Active Pharmaceutical Ingredients
The global Highly Potent Active Pharmaceutical Ingredients (HPAPI) market is predominantly led by North America, accounting for an estimated XX% of the global market share in 2025. This dominance is attributed to several key drivers:
- Robust Pharmaceutical R&D Infrastructure: North America boasts a high concentration of leading pharmaceutical and biotechnology companies with extensive research and development pipelines, driving demand for specialized HPAPIs.
- High Healthcare Expenditure: Significant investment in healthcare, coupled with a higher incidence of chronic diseases like cancer, translates into a greater demand for advanced therapeutic agents.
- Advanced Regulatory Framework: While stringent, the well-established regulatory environment in North America encourages investment in high-quality manufacturing and compliance, fostering a market for sophisticated HPAPI production.
- Presence of Key Players: Major HPAPI manufacturers and CDMOs, including Pfizer, Merck, and Cambrex, have a strong operational presence in the region, supporting market growth.
Within North America, the United States is the single largest contributor, driven by its vast pharmaceutical industry and a significant patient population undergoing treatment for various diseases.
In terms of Application, Cancer Therapy clearly leads the HPAPI market. The relentless pursuit of more effective and targeted cancer treatments, including antibody-drug conjugates (ADCs) and small molecule inhibitors, has made HPAPIs indispensable. The complexity and potency required for these therapies mean that specialized manufacturing capabilities are essential. The market for cancer-related HPAPIs is estimated to represent over XX% of the total application segment.
The Respiratory Therapy segment is also a significant contributor, driven by the rising incidence of respiratory ailments such as asthma, COPD, and cystic fibrosis. Advanced inhaled medications and targeted delivery systems often rely on highly potent APIs for optimal efficacy. This segment is estimated to hold approximately XX% of the application market.
The Central Nervous System (CNS) Therapy segment is experiencing steady growth, fueled by the increasing prevalence of neurological disorders like Alzheimer's, Parkinson's, and depression. The development of novel treatments for these complex conditions often necessitates the use of potent APIs that can cross the blood-brain barrier effectively. This segment contributes around XX% to the application market.
The 'Others' application segment, encompassing therapies for rare diseases, autoimmune disorders, and infectious diseases, also plays a role, albeit smaller.
Concerning Types, Chemical Synthesis is the dominant method for HPAPI production, accounting for an estimated XX% of the market. This method offers high purity, precise control over molecular structure, and scalability for a wide range of complex molecules. Innovations in synthetic chemistry, catalysis, and process optimization continue to enhance efficiency and reduce costs.
Plant and Animal Extraction represents a smaller but significant portion of the market, particularly for APIs derived from natural sources with unique therapeutic properties. This method is often used for certain anti-cancer agents and specialized treatments. This segment accounts for roughly XX% of the market.
The 'Others' type category, which may include bioprocessing or advanced fermentation techniques for certain complex molecules, represents a nascent but growing area of interest.
- Dominant Region: North America (XX% Market Share)
- Leading Country: United States
- Leading Application: Cancer Therapy (XX% of Application Segment)
- Second Leading Application: Respiratory Therapy (XX% of Application Segment)
- Third Leading Application: Central Nervous System Therapy (XX% of Application Segment)
- Dominant Type: Chemical Synthesis (XX% of Type Segment)
- Key Driver (Application): Demand for targeted therapies and novel drug development.
- Key Driver (Type): Advancements in synthetic chemistry and process optimization.
Highly Potent Active Pharmaceutical Ingredients Product Developments
The Highly Potent Active Pharmaceutical Ingredients (HPAPI) market is characterized by continuous product innovation, with a strong focus on developing novel and more effective therapeutic agents. Key developments revolve around the synthesis of highly selective small molecules and antibody-drug conjugates (ADCs) for cancer therapy, offering improved efficacy and reduced systemic toxicity. Advancements in containment technology further enable the safe development and manufacturing of these potent compounds. For respiratory therapy, innovations are centered on developing APIs for targeted delivery systems, enhancing therapeutic outcomes for conditions like asthma and COPD. In the CNS therapy realm, the focus is on creating HPAPIs that can effectively cross the blood-brain barrier, addressing complex neurological disorders. The market relevance of these product developments is significant, as they directly contribute to the advancement of personalized medicine and targeted treatment strategies, providing pharmaceutical companies with a competitive edge.
Challenges in the Highly Potent Active Pharmaceutical Ingredients Market
The Highly Potent Active Pharmaceutical Ingredients (HPAPI) market, while promising, faces several significant challenges that can impede growth and necessitate strategic mitigation. These include:
- Stringent Regulatory Hurdles: The inherent toxicity of HPAPIs necessitates extremely rigorous regulatory compliance, including advanced containment, specialized handling, and extensive safety testing, leading to higher development costs and longer approval timelines.
- Complex Manufacturing Processes: The synthesis and purification of HPAPIs often involve multi-step, complex chemical processes requiring specialized expertise, advanced equipment, and meticulous quality control, making manufacturing a bottleneck.
- High Capital Investment: Establishing or upgrading manufacturing facilities to meet HPAPI handling standards requires substantial capital investment in specialized containment technologies, such as isolators, closed-system transfer devices, and dedicated ventilation systems.
- Skilled Workforce Shortage: A significant challenge is the availability of highly skilled personnel trained in the safe handling, synthesis, and quality control of HPAPIs, leading to increased recruitment and training costs.
- Supply Chain Complexity: Ensuring a secure and reliable supply chain for raw materials and intermediates used in HPAPI synthesis, often requiring specialized sourcing and stringent quality checks, adds to operational complexity.
Forces Driving Highly Potent Active Pharmaceutical Ingredients Growth
The growth of the Highly Potent Active Pharmaceutical Ingredients (HPAPI) market is propelled by several interconnected forces:
- Escalating Prevalence of Chronic Diseases: The rising incidence of diseases such as cancer, autoimmune disorders, and neurological conditions creates a continuous demand for more effective and targeted therapies, often requiring HPAPIs.
- Advancements in Targeted Therapies: The shift towards precision medicine and the development of highly specific drugs, including antibody-drug conjugates (ADCs) and small molecule inhibitors, directly fuels the need for potent and highly pure APIs.
- Technological Innovations in Synthesis and Containment: Continuous improvements in chemical synthesis techniques, process intensification, and sophisticated containment technologies are making HPAPI development and manufacturing more feasible and safer.
- Increasing Outsourcing by Pharmaceutical Companies: Many pharmaceutical companies are increasingly outsourcing HPAPI development and manufacturing to specialized Contract Development and Manufacturing Organizations (CDMOs) to leverage expertise, reduce capital expenditure, and accelerate timelines.
- Growing Healthcare Expenditure Globally: Increased investment in healthcare infrastructure and access to advanced treatments worldwide is expanding the market for sophisticated pharmaceutical products, including those utilizing HPAPIs.
Challenges in the Highly Potent Active Pharmaceutical Ingredients Market
The long-term growth catalysts for the Highly Potent Active Pharmaceutical Ingredients (HPAPI) market are deeply embedded in ongoing innovation and market expansion strategies. A primary catalyst is the continued pipeline of novel drug candidates, particularly in oncology and rare diseases, which inherently require potent compounds. Furthermore, advancements in biopharmaceutical manufacturing, including the integration of artificial intelligence for process optimization and the development of more efficient continuous manufacturing platforms, will significantly de-risk and accelerate HPAPI production. Strategic partnerships and collaborations between pharmaceutical companies and specialized CDMOs will foster innovation and facilitate access to cutting-edge technologies and expertise. The expanding global reach of healthcare systems and the increasing demand for advanced therapies in emerging markets also present substantial long-term growth opportunities.
Emerging Opportunities in Highly Potent Active Pharmaceutical Ingredients
Emerging opportunities in the Highly Potent Active Pharmaceutical Ingredients (HPAPI) market are diverse and poised to shape its future landscape. A significant trend is the growth of personalized medicine, which demands highly specific and potent APIs tailored to individual patient profiles. The increasing development of antibody-drug conjugates (ADCs), a class of drugs that combine the targeting ability of antibodies with the cytotoxic potency of small molecule drugs, presents a substantial opportunity for HPAPI manufacturers. Furthermore, the expansion of therapeutic areas, beyond traditional oncology to include autoimmune diseases, inflammatory conditions, and certain neurological disorders, is creating new avenues for HPAPI utilization. Technological advancements in drug delivery systems, such as novel oral formulations and advanced inhalation devices, also create opportunities for the development of specifically engineered HPAPIs. The increasing focus on sustainable and green chemistry in pharmaceutical manufacturing is also opening doors for innovative and environmentally conscious HPAPI production methods.
- Personalized Medicine: Tailoring HPAPIs for individual patient needs.
- Antibody-Drug Conjugates (ADCs): A rapidly growing segment requiring potent payloads.
- Expanding Therapeutic Areas: New applications in autoimmune, inflammatory, and neurological diseases.
- Advanced Drug Delivery Systems: Opportunities for custom-engineered HPAPIs.
- Sustainable Manufacturing: Development of eco-friendly HPAPI production processes.
Leading Players in the Highly Potent Active Pharmaceutical Ingredients Sector
- Teva API
- Pfizer
- Merck
- Lonza Group AG
- STA Pharmaceutical
- Novasep
- Cambrex
- Dishman Carbogen Amcis Ltd
- Wuhan Hitech
- Haoyuan Chemexpress
- ScinoPharm
Key Milestones in Highly Potent Active Pharmaceutical Ingredients Industry
- 2019/2020: Increased investment in specialized HPAPI manufacturing facilities and containment technologies by major CDMOs and pharmaceutical companies.
- 2021: Significant rise in the number of approvals for Antibody-Drug Conjugates (ADCs), boosting demand for HPAPI payloads.
- 2022: Advancements in continuous manufacturing processes for HPAPIs, offering enhanced efficiency and scalability.
- 2023: Growing partnerships between small biotech firms and established CDMOs for HPAPI development and commercialization.
- 2024: Increased focus on robust supply chain management and de-risking strategies for critical HPAPI intermediates.
Strategic Outlook for Highly Potent Active Pharmaceutical Ingredients Market
The strategic outlook for the Highly Potent Active Pharmaceutical Ingredients (HPAPI) market is one of sustained and robust growth, driven by innovation and an expanding therapeutic landscape. Key growth accelerators include the continued dominance of oncology drug development, where HPAPIs are indispensable for targeted therapies, and the burgeoning field of Antibody-Drug Conjugates (ADCs), which necessitates the production of highly potent payloads. Furthermore, advancements in synthetic chemistry and bioprocessing will enable more efficient, cost-effective, and safer manufacturing of complex HPAPIs. The increasing global demand for advanced healthcare solutions, particularly in emerging economies, and the ongoing strategic outsourcing of HPAPI manufacturing by pharmaceutical companies to specialized CDMOs will further bolster market expansion. Companies that invest in cutting-edge containment technologies, highly skilled workforces, and integrated supply chain solutions will be best positioned to capitalize on future market potential.
Highly Potent Active Pharmaceutical Ingredients Segmentation
-
1. Application
- 1.1. Cancer Therapy
- 1.2. Respiratory Therapy
- 1.3. Central Nervous System Therapy
- 1.4. Others
-
2. Types
- 2.1. Chemical Synthesis
- 2.2. Plant and Animal Extraction
- 2.3. Others
Highly Potent Active Pharmaceutical Ingredients Segmentation By Geography
-
1. North America
- 1.1. United States
- 1.2. Canada
- 1.3. Mexico
-
2. South America
- 2.1. Brazil
- 2.2. Argentina
- 2.3. Rest of South America
-
3. Europe
- 3.1. United Kingdom
- 3.2. Germany
- 3.3. France
- 3.4. Italy
- 3.5. Spain
- 3.6. Russia
- 3.7. Benelux
- 3.8. Nordics
- 3.9. Rest of Europe
-
4. Middle East & Africa
- 4.1. Turkey
- 4.2. Israel
- 4.3. GCC
- 4.4. North Africa
- 4.5. South Africa
- 4.6. Rest of Middle East & Africa
-
5. Asia Pacific
- 5.1. China
- 5.2. India
- 5.3. Japan
- 5.4. South Korea
- 5.5. ASEAN
- 5.6. Oceania
- 5.7. Rest of Asia Pacific

Highly Potent Active Pharmaceutical Ingredients Regional Market Share
Geographic Coverage of Highly Potent Active Pharmaceutical Ingredients
Highly Potent Active Pharmaceutical Ingredients REPORT HIGHLIGHTS
| Aspects | Details |
|---|---|
| Study Period | 2020-2034 |
| Base Year | 2025 |
| Estimated Year | 2026 |
| Forecast Period | 2026-2034 |
| Historical Period | 2020-2025 |
| Growth Rate | CAGR of 6.6% from 2020-2034 |
| Segmentation |
|
Table of Contents
- 1. Introduction
- 1.1. Research Scope
- 1.2. Market Segmentation
- 1.3. Research Methodology
- 1.4. Definitions and Assumptions
- 2. Executive Summary
- 2.1. Introduction
- 3. Market Dynamics
- 3.1. Introduction
- 3.2. Market Drivers
- 3.3. Market Restrains
- 3.4. Market Trends
- 4. Market Factor Analysis
- 4.1. Porters Five Forces
- 4.2. Supply/Value Chain
- 4.3. PESTEL analysis
- 4.4. Market Entropy
- 4.5. Patent/Trademark Analysis
- 5. Global Highly Potent Active Pharmaceutical Ingredients Analysis, Insights and Forecast, 2020-2032
- 5.1. Market Analysis, Insights and Forecast - by Application
- 5.1.1. Cancer Therapy
- 5.1.2. Respiratory Therapy
- 5.1.3. Central Nervous System Therapy
- 5.1.4. Others
- 5.2. Market Analysis, Insights and Forecast - by Types
- 5.2.1. Chemical Synthesis
- 5.2.2. Plant and Animal Extraction
- 5.2.3. Others
- 5.3. Market Analysis, Insights and Forecast - by Region
- 5.3.1. North America
- 5.3.2. South America
- 5.3.3. Europe
- 5.3.4. Middle East & Africa
- 5.3.5. Asia Pacific
- 5.1. Market Analysis, Insights and Forecast - by Application
- 6. North America Highly Potent Active Pharmaceutical Ingredients Analysis, Insights and Forecast, 2020-2032
- 6.1. Market Analysis, Insights and Forecast - by Application
- 6.1.1. Cancer Therapy
- 6.1.2. Respiratory Therapy
- 6.1.3. Central Nervous System Therapy
- 6.1.4. Others
- 6.2. Market Analysis, Insights and Forecast - by Types
- 6.2.1. Chemical Synthesis
- 6.2.2. Plant and Animal Extraction
- 6.2.3. Others
- 6.1. Market Analysis, Insights and Forecast - by Application
- 7. South America Highly Potent Active Pharmaceutical Ingredients Analysis, Insights and Forecast, 2020-2032
- 7.1. Market Analysis, Insights and Forecast - by Application
- 7.1.1. Cancer Therapy
- 7.1.2. Respiratory Therapy
- 7.1.3. Central Nervous System Therapy
- 7.1.4. Others
- 7.2. Market Analysis, Insights and Forecast - by Types
- 7.2.1. Chemical Synthesis
- 7.2.2. Plant and Animal Extraction
- 7.2.3. Others
- 7.1. Market Analysis, Insights and Forecast - by Application
- 8. Europe Highly Potent Active Pharmaceutical Ingredients Analysis, Insights and Forecast, 2020-2032
- 8.1. Market Analysis, Insights and Forecast - by Application
- 8.1.1. Cancer Therapy
- 8.1.2. Respiratory Therapy
- 8.1.3. Central Nervous System Therapy
- 8.1.4. Others
- 8.2. Market Analysis, Insights and Forecast - by Types
- 8.2.1. Chemical Synthesis
- 8.2.2. Plant and Animal Extraction
- 8.2.3. Others
- 8.1. Market Analysis, Insights and Forecast - by Application
- 9. Middle East & Africa Highly Potent Active Pharmaceutical Ingredients Analysis, Insights and Forecast, 2020-2032
- 9.1. Market Analysis, Insights and Forecast - by Application
- 9.1.1. Cancer Therapy
- 9.1.2. Respiratory Therapy
- 9.1.3. Central Nervous System Therapy
- 9.1.4. Others
- 9.2. Market Analysis, Insights and Forecast - by Types
- 9.2.1. Chemical Synthesis
- 9.2.2. Plant and Animal Extraction
- 9.2.3. Others
- 9.1. Market Analysis, Insights and Forecast - by Application
- 10. Asia Pacific Highly Potent Active Pharmaceutical Ingredients Analysis, Insights and Forecast, 2020-2032
- 10.1. Market Analysis, Insights and Forecast - by Application
- 10.1.1. Cancer Therapy
- 10.1.2. Respiratory Therapy
- 10.1.3. Central Nervous System Therapy
- 10.1.4. Others
- 10.2. Market Analysis, Insights and Forecast - by Types
- 10.2.1. Chemical Synthesis
- 10.2.2. Plant and Animal Extraction
- 10.2.3. Others
- 10.1. Market Analysis, Insights and Forecast - by Application
- 11. Competitive Analysis
- 11.1. Global Market Share Analysis 2025
- 11.2. Company Profiles
- 11.2.1 Teva api
- 11.2.1.1. Overview
- 11.2.1.2. Products
- 11.2.1.3. SWOT Analysis
- 11.2.1.4. Recent Developments
- 11.2.1.5. Financials (Based on Availability)
- 11.2.2 Pfizer
- 11.2.2.1. Overview
- 11.2.2.2. Products
- 11.2.2.3. SWOT Analysis
- 11.2.2.4. Recent Developments
- 11.2.2.5. Financials (Based on Availability)
- 11.2.3 Merck
- 11.2.3.1. Overview
- 11.2.3.2. Products
- 11.2.3.3. SWOT Analysis
- 11.2.3.4. Recent Developments
- 11.2.3.5. Financials (Based on Availability)
- 11.2.4 Lonza Group AG
- 11.2.4.1. Overview
- 11.2.4.2. Products
- 11.2.4.3. SWOT Analysis
- 11.2.4.4. Recent Developments
- 11.2.4.5. Financials (Based on Availability)
- 11.2.5 STA Pharmaceutical
- 11.2.5.1. Overview
- 11.2.5.2. Products
- 11.2.5.3. SWOT Analysis
- 11.2.5.4. Recent Developments
- 11.2.5.5. Financials (Based on Availability)
- 11.2.6 Novasep
- 11.2.6.1. Overview
- 11.2.6.2. Products
- 11.2.6.3. SWOT Analysis
- 11.2.6.4. Recent Developments
- 11.2.6.5. Financials (Based on Availability)
- 11.2.7 Cambrex
- 11.2.7.1. Overview
- 11.2.7.2. Products
- 11.2.7.3. SWOT Analysis
- 11.2.7.4. Recent Developments
- 11.2.7.5. Financials (Based on Availability)
- 11.2.8 Dishman Carbogen Amcis Ltd
- 11.2.8.1. Overview
- 11.2.8.2. Products
- 11.2.8.3. SWOT Analysis
- 11.2.8.4. Recent Developments
- 11.2.8.5. Financials (Based on Availability)
- 11.2.9 Wuhan Hitech
- 11.2.9.1. Overview
- 11.2.9.2. Products
- 11.2.9.3. SWOT Analysis
- 11.2.9.4. Recent Developments
- 11.2.9.5. Financials (Based on Availability)
- 11.2.10 Haoyuan Chemexpress
- 11.2.10.1. Overview
- 11.2.10.2. Products
- 11.2.10.3. SWOT Analysis
- 11.2.10.4. Recent Developments
- 11.2.10.5. Financials (Based on Availability)
- 11.2.11 ScinoPharm
- 11.2.11.1. Overview
- 11.2.11.2. Products
- 11.2.11.3. SWOT Analysis
- 11.2.11.4. Recent Developments
- 11.2.11.5. Financials (Based on Availability)
- 11.2.1 Teva api
List of Figures
- Figure 1: Global Highly Potent Active Pharmaceutical Ingredients Revenue Breakdown (undefined, %) by Region 2025 & 2033
- Figure 2: North America Highly Potent Active Pharmaceutical Ingredients Revenue (undefined), by Application 2025 & 2033
- Figure 3: North America Highly Potent Active Pharmaceutical Ingredients Revenue Share (%), by Application 2025 & 2033
- Figure 4: North America Highly Potent Active Pharmaceutical Ingredients Revenue (undefined), by Types 2025 & 2033
- Figure 5: North America Highly Potent Active Pharmaceutical Ingredients Revenue Share (%), by Types 2025 & 2033
- Figure 6: North America Highly Potent Active Pharmaceutical Ingredients Revenue (undefined), by Country 2025 & 2033
- Figure 7: North America Highly Potent Active Pharmaceutical Ingredients Revenue Share (%), by Country 2025 & 2033
- Figure 8: South America Highly Potent Active Pharmaceutical Ingredients Revenue (undefined), by Application 2025 & 2033
- Figure 9: South America Highly Potent Active Pharmaceutical Ingredients Revenue Share (%), by Application 2025 & 2033
- Figure 10: South America Highly Potent Active Pharmaceutical Ingredients Revenue (undefined), by Types 2025 & 2033
- Figure 11: South America Highly Potent Active Pharmaceutical Ingredients Revenue Share (%), by Types 2025 & 2033
- Figure 12: South America Highly Potent Active Pharmaceutical Ingredients Revenue (undefined), by Country 2025 & 2033
- Figure 13: South America Highly Potent Active Pharmaceutical Ingredients Revenue Share (%), by Country 2025 & 2033
- Figure 14: Europe Highly Potent Active Pharmaceutical Ingredients Revenue (undefined), by Application 2025 & 2033
- Figure 15: Europe Highly Potent Active Pharmaceutical Ingredients Revenue Share (%), by Application 2025 & 2033
- Figure 16: Europe Highly Potent Active Pharmaceutical Ingredients Revenue (undefined), by Types 2025 & 2033
- Figure 17: Europe Highly Potent Active Pharmaceutical Ingredients Revenue Share (%), by Types 2025 & 2033
- Figure 18: Europe Highly Potent Active Pharmaceutical Ingredients Revenue (undefined), by Country 2025 & 2033
- Figure 19: Europe Highly Potent Active Pharmaceutical Ingredients Revenue Share (%), by Country 2025 & 2033
- Figure 20: Middle East & Africa Highly Potent Active Pharmaceutical Ingredients Revenue (undefined), by Application 2025 & 2033
- Figure 21: Middle East & Africa Highly Potent Active Pharmaceutical Ingredients Revenue Share (%), by Application 2025 & 2033
- Figure 22: Middle East & Africa Highly Potent Active Pharmaceutical Ingredients Revenue (undefined), by Types 2025 & 2033
- Figure 23: Middle East & Africa Highly Potent Active Pharmaceutical Ingredients Revenue Share (%), by Types 2025 & 2033
- Figure 24: Middle East & Africa Highly Potent Active Pharmaceutical Ingredients Revenue (undefined), by Country 2025 & 2033
- Figure 25: Middle East & Africa Highly Potent Active Pharmaceutical Ingredients Revenue Share (%), by Country 2025 & 2033
- Figure 26: Asia Pacific Highly Potent Active Pharmaceutical Ingredients Revenue (undefined), by Application 2025 & 2033
- Figure 27: Asia Pacific Highly Potent Active Pharmaceutical Ingredients Revenue Share (%), by Application 2025 & 2033
- Figure 28: Asia Pacific Highly Potent Active Pharmaceutical Ingredients Revenue (undefined), by Types 2025 & 2033
- Figure 29: Asia Pacific Highly Potent Active Pharmaceutical Ingredients Revenue Share (%), by Types 2025 & 2033
- Figure 30: Asia Pacific Highly Potent Active Pharmaceutical Ingredients Revenue (undefined), by Country 2025 & 2033
- Figure 31: Asia Pacific Highly Potent Active Pharmaceutical Ingredients Revenue Share (%), by Country 2025 & 2033
List of Tables
- Table 1: Global Highly Potent Active Pharmaceutical Ingredients Revenue undefined Forecast, by Application 2020 & 2033
- Table 2: Global Highly Potent Active Pharmaceutical Ingredients Revenue undefined Forecast, by Types 2020 & 2033
- Table 3: Global Highly Potent Active Pharmaceutical Ingredients Revenue undefined Forecast, by Region 2020 & 2033
- Table 4: Global Highly Potent Active Pharmaceutical Ingredients Revenue undefined Forecast, by Application 2020 & 2033
- Table 5: Global Highly Potent Active Pharmaceutical Ingredients Revenue undefined Forecast, by Types 2020 & 2033
- Table 6: Global Highly Potent Active Pharmaceutical Ingredients Revenue undefined Forecast, by Country 2020 & 2033
- Table 7: United States Highly Potent Active Pharmaceutical Ingredients Revenue (undefined) Forecast, by Application 2020 & 2033
- Table 8: Canada Highly Potent Active Pharmaceutical Ingredients Revenue (undefined) Forecast, by Application 2020 & 2033
- Table 9: Mexico Highly Potent Active Pharmaceutical Ingredients Revenue (undefined) Forecast, by Application 2020 & 2033
- Table 10: Global Highly Potent Active Pharmaceutical Ingredients Revenue undefined Forecast, by Application 2020 & 2033
- Table 11: Global Highly Potent Active Pharmaceutical Ingredients Revenue undefined Forecast, by Types 2020 & 2033
- Table 12: Global Highly Potent Active Pharmaceutical Ingredients Revenue undefined Forecast, by Country 2020 & 2033
- Table 13: Brazil Highly Potent Active Pharmaceutical Ingredients Revenue (undefined) Forecast, by Application 2020 & 2033
- Table 14: Argentina Highly Potent Active Pharmaceutical Ingredients Revenue (undefined) Forecast, by Application 2020 & 2033
- Table 15: Rest of South America Highly Potent Active Pharmaceutical Ingredients Revenue (undefined) Forecast, by Application 2020 & 2033
- Table 16: Global Highly Potent Active Pharmaceutical Ingredients Revenue undefined Forecast, by Application 2020 & 2033
- Table 17: Global Highly Potent Active Pharmaceutical Ingredients Revenue undefined Forecast, by Types 2020 & 2033
- Table 18: Global Highly Potent Active Pharmaceutical Ingredients Revenue undefined Forecast, by Country 2020 & 2033
- Table 19: United Kingdom Highly Potent Active Pharmaceutical Ingredients Revenue (undefined) Forecast, by Application 2020 & 2033
- Table 20: Germany Highly Potent Active Pharmaceutical Ingredients Revenue (undefined) Forecast, by Application 2020 & 2033
- Table 21: France Highly Potent Active Pharmaceutical Ingredients Revenue (undefined) Forecast, by Application 2020 & 2033
- Table 22: Italy Highly Potent Active Pharmaceutical Ingredients Revenue (undefined) Forecast, by Application 2020 & 2033
- Table 23: Spain Highly Potent Active Pharmaceutical Ingredients Revenue (undefined) Forecast, by Application 2020 & 2033
- Table 24: Russia Highly Potent Active Pharmaceutical Ingredients Revenue (undefined) Forecast, by Application 2020 & 2033
- Table 25: Benelux Highly Potent Active Pharmaceutical Ingredients Revenue (undefined) Forecast, by Application 2020 & 2033
- Table 26: Nordics Highly Potent Active Pharmaceutical Ingredients Revenue (undefined) Forecast, by Application 2020 & 2033
- Table 27: Rest of Europe Highly Potent Active Pharmaceutical Ingredients Revenue (undefined) Forecast, by Application 2020 & 2033
- Table 28: Global Highly Potent Active Pharmaceutical Ingredients Revenue undefined Forecast, by Application 2020 & 2033
- Table 29: Global Highly Potent Active Pharmaceutical Ingredients Revenue undefined Forecast, by Types 2020 & 2033
- Table 30: Global Highly Potent Active Pharmaceutical Ingredients Revenue undefined Forecast, by Country 2020 & 2033
- Table 31: Turkey Highly Potent Active Pharmaceutical Ingredients Revenue (undefined) Forecast, by Application 2020 & 2033
- Table 32: Israel Highly Potent Active Pharmaceutical Ingredients Revenue (undefined) Forecast, by Application 2020 & 2033
- Table 33: GCC Highly Potent Active Pharmaceutical Ingredients Revenue (undefined) Forecast, by Application 2020 & 2033
- Table 34: North Africa Highly Potent Active Pharmaceutical Ingredients Revenue (undefined) Forecast, by Application 2020 & 2033
- Table 35: South Africa Highly Potent Active Pharmaceutical Ingredients Revenue (undefined) Forecast, by Application 2020 & 2033
- Table 36: Rest of Middle East & Africa Highly Potent Active Pharmaceutical Ingredients Revenue (undefined) Forecast, by Application 2020 & 2033
- Table 37: Global Highly Potent Active Pharmaceutical Ingredients Revenue undefined Forecast, by Application 2020 & 2033
- Table 38: Global Highly Potent Active Pharmaceutical Ingredients Revenue undefined Forecast, by Types 2020 & 2033
- Table 39: Global Highly Potent Active Pharmaceutical Ingredients Revenue undefined Forecast, by Country 2020 & 2033
- Table 40: China Highly Potent Active Pharmaceutical Ingredients Revenue (undefined) Forecast, by Application 2020 & 2033
- Table 41: India Highly Potent Active Pharmaceutical Ingredients Revenue (undefined) Forecast, by Application 2020 & 2033
- Table 42: Japan Highly Potent Active Pharmaceutical Ingredients Revenue (undefined) Forecast, by Application 2020 & 2033
- Table 43: South Korea Highly Potent Active Pharmaceutical Ingredients Revenue (undefined) Forecast, by Application 2020 & 2033
- Table 44: ASEAN Highly Potent Active Pharmaceutical Ingredients Revenue (undefined) Forecast, by Application 2020 & 2033
- Table 45: Oceania Highly Potent Active Pharmaceutical Ingredients Revenue (undefined) Forecast, by Application 2020 & 2033
- Table 46: Rest of Asia Pacific Highly Potent Active Pharmaceutical Ingredients Revenue (undefined) Forecast, by Application 2020 & 2033
Frequently Asked Questions
1. What is the projected Compound Annual Growth Rate (CAGR) of the Highly Potent Active Pharmaceutical Ingredients?
The projected CAGR is approximately 6.6%.
2. Which companies are prominent players in the Highly Potent Active Pharmaceutical Ingredients?
Key companies in the market include Teva api, Pfizer, Merck, Lonza Group AG, STA Pharmaceutical, Novasep, Cambrex, Dishman Carbogen Amcis Ltd, Wuhan Hitech, Haoyuan Chemexpress, ScinoPharm.
3. What are the main segments of the Highly Potent Active Pharmaceutical Ingredients?
The market segments include Application, Types.
4. Can you provide details about the market size?
The market size is estimated to be USD XXX N/A as of 2022.
5. What are some drivers contributing to market growth?
N/A
6. What are the notable trends driving market growth?
N/A
7. Are there any restraints impacting market growth?
N/A
8. Can you provide examples of recent developments in the market?
N/A
9. What pricing options are available for accessing the report?
Pricing options include single-user, multi-user, and enterprise licenses priced at USD 4900.00, USD 7350.00, and USD 9800.00 respectively.
10. Is the market size provided in terms of value or volume?
The market size is provided in terms of value, measured in N/A.
11. Are there any specific market keywords associated with the report?
Yes, the market keyword associated with the report is "Highly Potent Active Pharmaceutical Ingredients," which aids in identifying and referencing the specific market segment covered.
12. How do I determine which pricing option suits my needs best?
The pricing options vary based on user requirements and access needs. Individual users may opt for single-user licenses, while businesses requiring broader access may choose multi-user or enterprise licenses for cost-effective access to the report.
13. Are there any additional resources or data provided in the Highly Potent Active Pharmaceutical Ingredients report?
While the report offers comprehensive insights, it's advisable to review the specific contents or supplementary materials provided to ascertain if additional resources or data are available.
14. How can I stay updated on further developments or reports in the Highly Potent Active Pharmaceutical Ingredients?
To stay informed about further developments, trends, and reports in the Highly Potent Active Pharmaceutical Ingredients, consider subscribing to industry newsletters, following relevant companies and organizations, or regularly checking reputable industry news sources and publications.
Methodology
Step 1 - Identification of Relevant Samples Size from Population Database


Step 2 - Approaches for Defining Global Market Size (Value, Volume* & Price*)

Note*: In applicable scenarios
Step 3 - Data Sources
Primary Research
- Web Analytics
- Survey Reports
- Research Institute
- Latest Research Reports
- Opinion Leaders
Secondary Research
- Annual Reports
- White Paper
- Latest Press Release
- Industry Association
- Paid Database
- Investor Presentations

Step 4 - Data Triangulation
Involves using different sources of information in order to increase the validity of a study
These sources are likely to be stakeholders in a program - participants, other researchers, program staff, other community members, and so on.
Then we put all data in single framework & apply various statistical tools to find out the dynamic on the market.
During the analysis stage, feedback from the stakeholder groups would be compared to determine areas of agreement as well as areas of divergence