

Key Insights
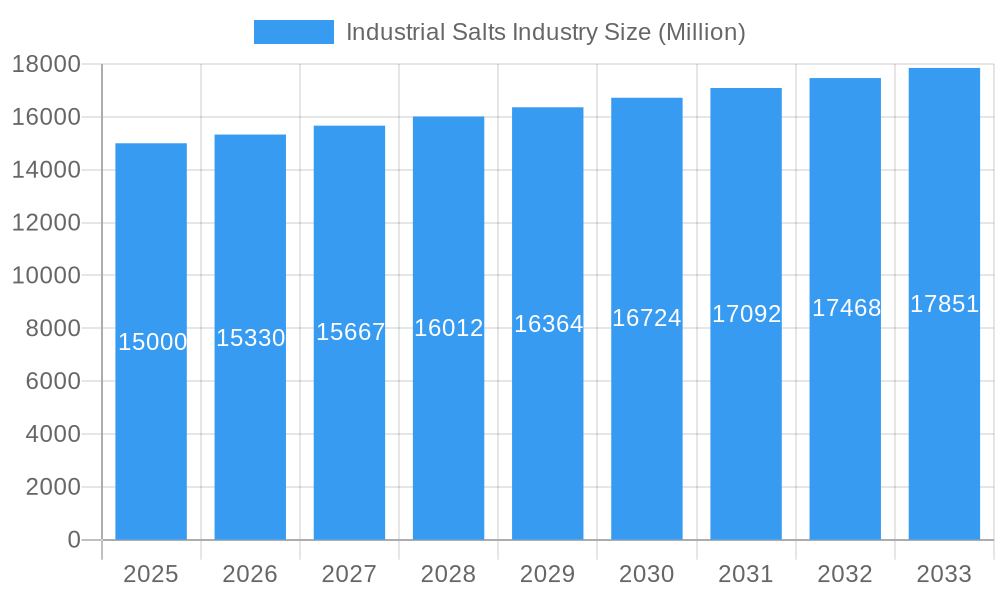
The global industrial salts market, estimated at 238.55 million in the 2025 base year, is projected for sustained growth, exhibiting a compound annual growth rate (CAGR) of 2.2% through 2033. Key growth drivers include escalating demand from chemical processing for chlorine and caustic soda production, and the vital role of industrial salts in water treatment for purification. The food processing sector's consistent use as a preservative and flavor enhancer also bolsters market expansion. Innovations in sustainable production methods, such as solar and vacuum evaporation, are shaping the market landscape. Market restraints encompass fluctuating raw material costs, stringent environmental regulations for brine disposal, and potential competition from alternative de-icing agents. Market segmentation highlights rock salt and natural brine as primary sources, with diverse production methods influencing cost and environmental impact. Chemical processing and water treatment represent leading applications, with agriculture, food processing, and de-icing also contributing significantly. Major players, including Cargill, Tata Chemicals, and K+S, are driving competitive dynamics through innovation and expansion. Regional demand is concentrated in North America, Europe, and Asia-Pacific, fueled by industrial development and population growth.
Industrial Salts Industry Market Size (In Million)
The forecast period (2025-2033) anticipates continued market expansion, propelled by increasing industrialization in developing economies. While global economic outlooks may introduce short-term volatility, the long-term demand for industrial salts remains robust due to their essential industrial applications. Advancements in sustainable salt production are poised to influence future market dynamics, favoring eco-friendly practices. The competitive landscape features a blend of multinational corporations and regional players, indicating opportunities for both consolidation and niche specialization. Strategic partnerships and technological advancements will be critical for future market leadership, alongside market penetration in emerging applications and expansion into untapped regions.
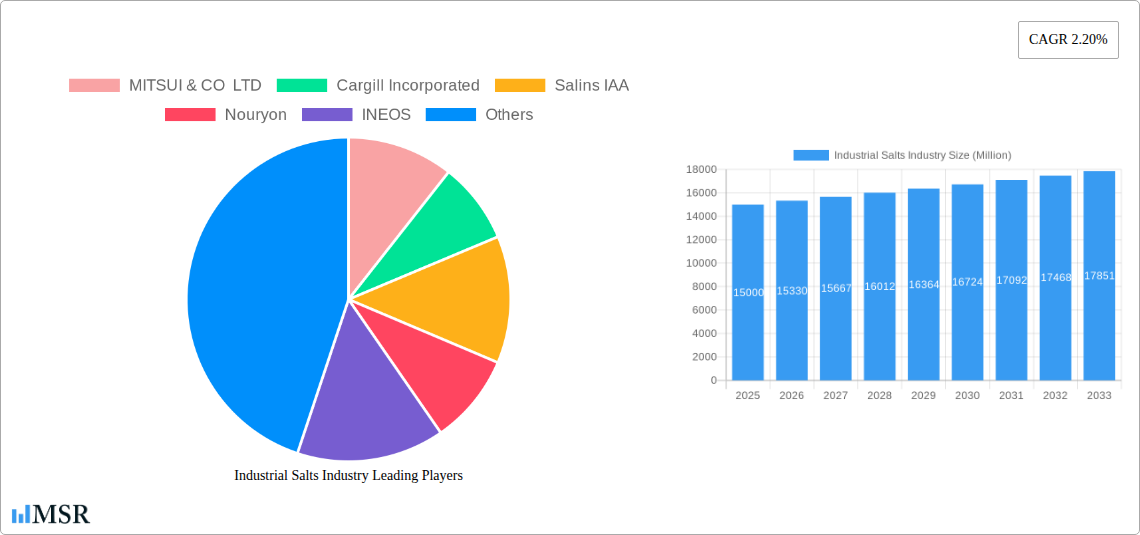
Industrial Salts Industry Company Market Share
This report offers a comprehensive analysis of the global industrial salts market, detailing market size, growth drivers, key players, and future trends. The study period spans 2019-2033, with 2025 as the base year and 2025-2033 as the forecast period. This analysis, grounded in historical data from 2019-2024, is an essential resource for industry stakeholders, investors, and businesses navigating this dynamic market.
Industrial Salts Industry Market Concentration & Dynamics
The industrial salts market is characterized by a moderately concentrated landscape, with several major players commanding significant market share. MITSUI & CO LTD, Cargill Incorporated, and K+S Aktiengesellschaft are among the leading global players, each holding a substantial portion of the global market. However, the presence of numerous regional and specialized producers contributes to a competitive dynamic. Market share data reveals a top 5 concentration of approximately xx%, indicating opportunities for both expansion and consolidation.
Innovation Ecosystems: The industry witnesses ongoing innovation in extraction techniques (like enhanced solar evaporation), purification processes, and the development of specialized salt products tailored to specific applications. This drives efficiency improvements and the creation of high-value products.
Regulatory Frameworks: Stringent environmental regulations concerning water usage and waste disposal impact production costs and operational strategies. Compliance costs vary across regions, influencing the profitability and competitiveness of players.
Substitute Products: While direct substitutes for industrial salt are limited, alternative de-icing agents and chemicals in specific applications offer some competitive pressure. This necessitates continuous innovation and differentiation.
End-User Trends: Growth in key end-use sectors like chemical processing, water treatment, and food processing are significant drivers of market expansion. Changes in consumer preferences and industrial processes continuously shape market demand.
M&A Activities: The industrial salts industry has witnessed notable M&A activity in recent years. For example, Tata Chemicals Ltd's intended acquisition of Archean Group's industrial salt unit in 2021 highlights the strategic importance of consolidation and expansion. The number of M&A deals in the last five years is estimated at xx, reflecting a trend towards market concentration.
Industrial Salts Industry Insights & Trends
The global industrial salts market is experiencing robust growth, driven by increasing demand across various sectors. The market size in 2025 is estimated at $xx Million, exhibiting a Compound Annual Growth Rate (CAGR) of xx% during the forecast period (2025-2033). This expansion is fueled by several key factors:
- Rising Demand from Chemical Processing: The chemical industry’s continuous expansion fuels the demand for high-quality industrial salts as essential raw materials.
- Growth in Water Treatment: Increasing urbanization and industrialization necessitate advanced water treatment solutions, further boosting the demand for water treatment salts.
- Infrastructure Development: Extensive infrastructure projects worldwide drive demand for de-icing salts, especially in regions with harsh winters.
- Technological Advancements: Innovations in extraction and purification techniques enhance efficiency and reduce costs, improving market competitiveness.
- Growing Food Processing Sector: The burgeoning food processing industry requires significant quantities of salt as a preservative and flavor enhancer.
Key Markets & Segments Leading Industrial Salts Industry
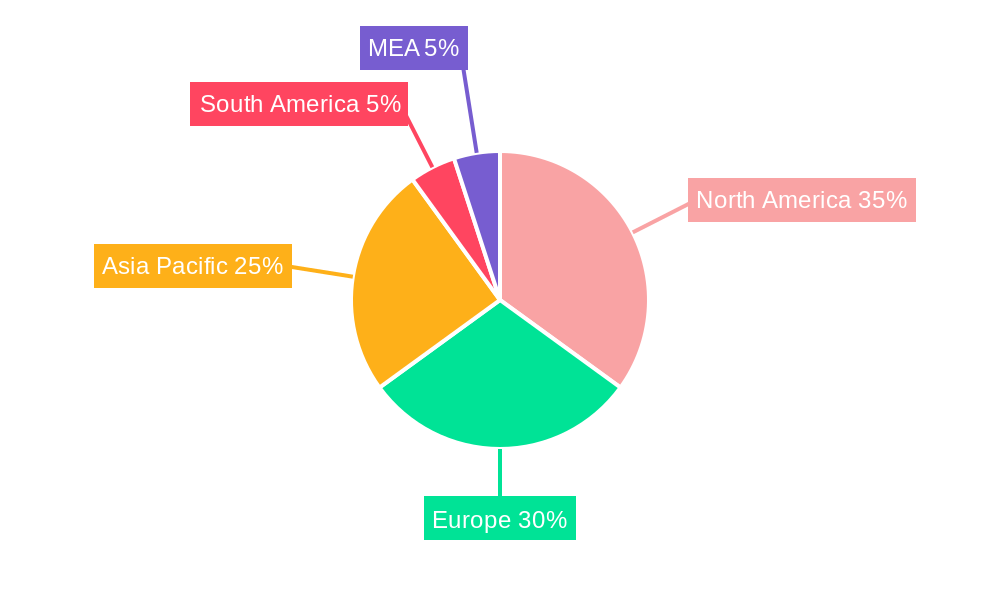
The global industrial salts market is geographically diverse, with significant presence in North America, Europe, and Asia-Pacific. However, the Asia-Pacific region is expected to exhibit the fastest growth rate during the forecast period due to rapid industrialization and increasing infrastructure investments. Within the market segments:
Source: Rock salt and natural brine are the two primary sources of industrial salt. Rock salt mining accounts for xx% of the total production, while brine extraction holds a xx% share.
Manufacturing Process: Solar evaporation, vacuum evaporation, and conventional mining are prevalent manufacturing processes, each having its unique characteristics in terms of cost-effectiveness and environmental impact. Solar evaporation dominates in regions with abundant sunlight.
Application: Chemical processing remains the largest application segment, followed by water treatment and de-icing. Growth in the food processing and oil and gas sectors further bolsters market demand.
- Drivers for Growth:
- Rapid industrialization and urbanization, particularly in developing economies.
- Growing investments in infrastructure development across several nations.
- Technological advancements that enhance extraction, processing and purification.
Industrial Salts Industry Product Developments
Recent product innovations focus on developing specialized salts with enhanced purity and tailored properties for specific applications. These include high-purity salts for pharmaceutical and electronics industries, and modified salts optimized for de-icing efficiency. This emphasis on value-added products is a key strategy for enhancing market competitiveness. Companies are also focusing on sustainable production methods to meet increasing environmental concerns.
Challenges in the Industrial Salts Industry Market
The industrial salts market faces several challenges, including volatile raw material prices, stringent environmental regulations, and intense competition among numerous producers. Supply chain disruptions due to geopolitical instability and climate change pose significant risks to production and delivery. Furthermore, the need for significant capital investment in infrastructure and technology can act as a barrier to entry for new players. These factors collectively impact overall profitability and market dynamics.
Forces Driving Industrial Salts Industry Growth
The key growth drivers for the industrial salts market include robust demand from key industries (chemicals, water treatment, food processing), continuous technological advancements, and favorable government policies promoting industrial development and infrastructure projects. Economies of scale and strategic acquisitions play vital roles in shaping the market's future.
Long-Term Growth Catalysts in the Industrial Salts Industry
Long-term growth in the industrial salts market will be driven by increasing collaborations and partnerships, along with innovations in salt extraction and purification technologies. Market expansion into new geographical areas and emerging applications, particularly within specialized industrial segments, present significant growth opportunities. Sustainable and environmentally friendly production practices will become increasingly important for securing market share.
Emerging Opportunities in Industrial Salts Industry
Emerging opportunities include exploring niche applications of industrial salts in areas like water softening and specialized chemical processes. Technological advancements leading to higher efficiency and reduced environmental impact will attract more investments in the industry. Growth of the renewable energy sector and associated technologies will also drive demand for specialized salts. Furthermore, focusing on premium and highly purified products will create significant value opportunities.
Leading Players in the Industrial Salts Industry Sector
- MITSUI & CO LTD
- Cargill Incorporated
- Salins IAA
- Nouryon
- INEOS
- Tata Chemicals Ltd
- Archean Group
- Donald Brown Group
- Rio Tinto
- Delmon Group of Companies
- K+S Aktiengesellschaft
- Morton Salt Inc
- Exportadora de Sal de CV
- Compass Minerals
- Dominion Salt Limited
Key Milestones in Industrial Salts Industry Industry
- January 2021: Tata Chemicals Ltd intended to acquire Archean Group's industrial salt unit (3 Million tons annual capacity).
- June 2018: INEOS implemented a new salt handling system at its Runcorn facility, optimizing salt tablet production (up to 500 kilotons annually).
Strategic Outlook for Industrial Salts Industry Market
The industrial salts market is poised for continued growth, driven by increasing demand across various end-use sectors and ongoing technological advancements. Strategic investments in sustainable production practices and exploring new market applications will play a key role in shaping the future landscape. Focus on value-added products and strategic partnerships will further enhance market competitiveness and profitability for major players.
Industrial Salts Industry Segmentation
-
1. Source
- 1.1. Rock Salt
- 1.2. Natural Brine
-
2. Manufacturing Process
- 2.1. Solar Evaporation
- 2.2. Vacuum Evaporation
- 2.3. Conventional Mining
-
3. Application
- 3.1. Chemical Processing
- 3.2. Water Treatment
- 3.3. De-icing
- 3.4. Agriculture
- 3.5. Food Processing
- 3.6. Oil and Gas
- 3.7. Other Applications
Industrial Salts Industry Segmentation By Geography
-
1. Asia Pacific
- 1.1. China
- 1.2. India
- 1.3. Japan
- 1.4. South Korea
- 1.5. Rest of Asia Pacific
-
2. North America
- 2.1. United States
- 2.2. Canada
- 2.3. Mexico
-
3. Europe
- 3.1. Germany
- 3.2. United Kingdom
- 3.3. France
- 3.4. Italy
- 3.5. Rest of Europe
-
4. South America
- 4.1. Brazil
- 4.2. Argentina
- 4.3. Rest of South America
-
5. Middle East and Africa
- 5.1. Saudi Arabia
- 5.2. South Africa
- 5.3. Rest of Middle East and Africa
Industrial Salts Industry Regional Market Share
Geographic Coverage of Industrial Salts Industry
Industrial Salts Industry REPORT HIGHLIGHTS
| Aspects | Details |
|---|---|
| Study Period | 2020-2034 |
| Base Year | 2025 |
| Estimated Year | 2026 |
| Forecast Period | 2026-2034 |
| Historical Period | 2020-2025 |
| Growth Rate | CAGR of 2.2% from 2020-2034 |
| Segmentation |
|
Table of Contents
- 1. Introduction
- 1.1. Research Scope
- 1.2. Market Segmentation
- 1.3. Research Objective
- 1.4. Definitions and Assumptions
- 2. Executive Summary
- 2.1. Market Snapshot
- 3. Market Dynamics
- 3.1. Market Drivers
- 3.2. Market Restrains
- 3.3. Market Trends
- 3.4. Market Opportunities
- 4. Market Factor Analysis
- 4.1. Porters Five Forces
- 4.1.1. Bargaining Power of Suppliers
- 4.1.2. Bargaining Power of Buyers
- 4.1.3. Threat of New Entrants
- 4.1.4. Threat of Substitutes
- 4.1.5. Competitive Rivalry
- 4.2. PESTEL analysis
- 4.3. BCG Analysis
- 4.3.1. Stars (High Growth, High Market Share)
- 4.3.2. Cash Cows (Low Growth, High Market Share)
- 4.3.3. Question Mark (High Growth, Low Market Share)
- 4.3.4. Dogs (Low Growth, Low Market Share)
- 4.4. Ansoff Matrix Analysis
- 4.5. Supply Chain Analysis
- 4.6. Regulatory Landscape
- 4.7. Current Market Potential and Opportunity Assessment (TAM–SAM–SOM Framework)
- 4.8. MSR Analyst Note
- 4.1. Porters Five Forces
- 5. Market Analysis, Insights and Forecast 2021-2033
- 5.1. Market Analysis, Insights and Forecast - by Source
- 5.1.1. Rock Salt
- 5.1.2. Natural Brine
- 5.2. Market Analysis, Insights and Forecast - by Manufacturing Process
- 5.2.1. Solar Evaporation
- 5.2.2. Vacuum Evaporation
- 5.2.3. Conventional Mining
- 5.3. Market Analysis, Insights and Forecast - by Application
- 5.3.1. Chemical Processing
- 5.3.2. Water Treatment
- 5.3.3. De-icing
- 5.3.4. Agriculture
- 5.3.5. Food Processing
- 5.3.6. Oil and Gas
- 5.3.7. Other Applications
- 5.4. Market Analysis, Insights and Forecast - by Region
- 5.4.1. Asia Pacific
- 5.4.2. North America
- 5.4.3. Europe
- 5.4.4. South America
- 5.4.5. Middle East and Africa
- 5.1. Market Analysis, Insights and Forecast - by Source
- 6. Global Industrial Salts Industry Analysis, Insights and Forecast, 2021-2033
- 6.1. Market Analysis, Insights and Forecast - by Source
- 6.1.1. Rock Salt
- 6.1.2. Natural Brine
- 6.2. Market Analysis, Insights and Forecast - by Manufacturing Process
- 6.2.1. Solar Evaporation
- 6.2.2. Vacuum Evaporation
- 6.2.3. Conventional Mining
- 6.3. Market Analysis, Insights and Forecast - by Application
- 6.3.1. Chemical Processing
- 6.3.2. Water Treatment
- 6.3.3. De-icing
- 6.3.4. Agriculture
- 6.3.5. Food Processing
- 6.3.6. Oil and Gas
- 6.3.7. Other Applications
- 6.1. Market Analysis, Insights and Forecast - by Source
- 7. Asia Pacific Industrial Salts Industry Analysis, Insights and Forecast, 2020-2032
- 7.1. Market Analysis, Insights and Forecast - by Source
- 7.1.1. Rock Salt
- 7.1.2. Natural Brine
- 7.2. Market Analysis, Insights and Forecast - by Manufacturing Process
- 7.2.1. Solar Evaporation
- 7.2.2. Vacuum Evaporation
- 7.2.3. Conventional Mining
- 7.3. Market Analysis, Insights and Forecast - by Application
- 7.3.1. Chemical Processing
- 7.3.2. Water Treatment
- 7.3.3. De-icing
- 7.3.4. Agriculture
- 7.3.5. Food Processing
- 7.3.6. Oil and Gas
- 7.3.7. Other Applications
- 7.1. Market Analysis, Insights and Forecast - by Source
- 8. North America Industrial Salts Industry Analysis, Insights and Forecast, 2020-2032
- 8.1. Market Analysis, Insights and Forecast - by Source
- 8.1.1. Rock Salt
- 8.1.2. Natural Brine
- 8.2. Market Analysis, Insights and Forecast - by Manufacturing Process
- 8.2.1. Solar Evaporation
- 8.2.2. Vacuum Evaporation
- 8.2.3. Conventional Mining
- 8.3. Market Analysis, Insights and Forecast - by Application
- 8.3.1. Chemical Processing
- 8.3.2. Water Treatment
- 8.3.3. De-icing
- 8.3.4. Agriculture
- 8.3.5. Food Processing
- 8.3.6. Oil and Gas
- 8.3.7. Other Applications
- 8.1. Market Analysis, Insights and Forecast - by Source
- 9. Europe Industrial Salts Industry Analysis, Insights and Forecast, 2020-2032
- 9.1. Market Analysis, Insights and Forecast - by Source
- 9.1.1. Rock Salt
- 9.1.2. Natural Brine
- 9.2. Market Analysis, Insights and Forecast - by Manufacturing Process
- 9.2.1. Solar Evaporation
- 9.2.2. Vacuum Evaporation
- 9.2.3. Conventional Mining
- 9.3. Market Analysis, Insights and Forecast - by Application
- 9.3.1. Chemical Processing
- 9.3.2. Water Treatment
- 9.3.3. De-icing
- 9.3.4. Agriculture
- 9.3.5. Food Processing
- 9.3.6. Oil and Gas
- 9.3.7. Other Applications
- 9.1. Market Analysis, Insights and Forecast - by Source
- 10. South America Industrial Salts Industry Analysis, Insights and Forecast, 2020-2032
- 10.1. Market Analysis, Insights and Forecast - by Source
- 10.1.1. Rock Salt
- 10.1.2. Natural Brine
- 10.2. Market Analysis, Insights and Forecast - by Manufacturing Process
- 10.2.1. Solar Evaporation
- 10.2.2. Vacuum Evaporation
- 10.2.3. Conventional Mining
- 10.3. Market Analysis, Insights and Forecast - by Application
- 10.3.1. Chemical Processing
- 10.3.2. Water Treatment
- 10.3.3. De-icing
- 10.3.4. Agriculture
- 10.3.5. Food Processing
- 10.3.6. Oil and Gas
- 10.3.7. Other Applications
- 10.1. Market Analysis, Insights and Forecast - by Source
- 11. Middle East and Africa Industrial Salts Industry Analysis, Insights and Forecast, 2020-2032
- 11.1. Market Analysis, Insights and Forecast - by Source
- 11.1.1. Rock Salt
- 11.1.2. Natural Brine
- 11.2. Market Analysis, Insights and Forecast - by Manufacturing Process
- 11.2.1. Solar Evaporation
- 11.2.2. Vacuum Evaporation
- 11.2.3. Conventional Mining
- 11.3. Market Analysis, Insights and Forecast - by Application
- 11.3.1. Chemical Processing
- 11.3.2. Water Treatment
- 11.3.3. De-icing
- 11.3.4. Agriculture
- 11.3.5. Food Processing
- 11.3.6. Oil and Gas
- 11.3.7. Other Applications
- 11.1. Market Analysis, Insights and Forecast - by Source
- 12. Competitive Analysis
- 12.1. Company Profiles
- 12.1.1 MITSUI & CO LTD
- 12.1.1.1. Company Overview
- 12.1.1.2. Products
- 12.1.1.3. Company Financials
- 12.1.1.4. SWOT Analysis
- 12.1.2 Cargill Incorporated
- 12.1.2.1. Company Overview
- 12.1.2.2. Products
- 12.1.2.3. Company Financials
- 12.1.2.4. SWOT Analysis
- 12.1.3 Salins IAA
- 12.1.3.1. Company Overview
- 12.1.3.2. Products
- 12.1.3.3. Company Financials
- 12.1.3.4. SWOT Analysis
- 12.1.4 Nouryon
- 12.1.4.1. Company Overview
- 12.1.4.2. Products
- 12.1.4.3. Company Financials
- 12.1.4.4. SWOT Analysis
- 12.1.5 INEOS
- 12.1.5.1. Company Overview
- 12.1.5.2. Products
- 12.1.5.3. Company Financials
- 12.1.5.4. SWOT Analysis
- 12.1.6 Tata Chemicals Ltd
- 12.1.6.1. Company Overview
- 12.1.6.2. Products
- 12.1.6.3. Company Financials
- 12.1.6.4. SWOT Analysis
- 12.1.7 Archean Group
- 12.1.7.1. Company Overview
- 12.1.7.2. Products
- 12.1.7.3. Company Financials
- 12.1.7.4. SWOT Analysis
- 12.1.8 Donald Brown Group
- 12.1.8.1. Company Overview
- 12.1.8.2. Products
- 12.1.8.3. Company Financials
- 12.1.8.4. SWOT Analysis
- 12.1.9 Rio Tinto
- 12.1.9.1. Company Overview
- 12.1.9.2. Products
- 12.1.9.3. Company Financials
- 12.1.9.4. SWOT Analysis
- 12.1.10 Delmon Group of Companies
- 12.1.10.1. Company Overview
- 12.1.10.2. Products
- 12.1.10.3. Company Financials
- 12.1.10.4. SWOT Analysis
- 12.1.11 K+S Aktiengesellschaft
- 12.1.11.1. Company Overview
- 12.1.11.2. Products
- 12.1.11.3. Company Financials
- 12.1.11.4. SWOT Analysis
- 12.1.12 Morton Salt Inc
- 12.1.12.1. Company Overview
- 12.1.12.2. Products
- 12.1.12.3. Company Financials
- 12.1.12.4. SWOT Analysis
- 12.1.13 Exportadora de Sal de CV
- 12.1.13.1. Company Overview
- 12.1.13.2. Products
- 12.1.13.3. Company Financials
- 12.1.13.4. SWOT Analysis
- 12.1.14 Compass Minerals
- 12.1.14.1. Company Overview
- 12.1.14.2. Products
- 12.1.14.3. Company Financials
- 12.1.14.4. SWOT Analysis
- 12.1.15 Dominion Salt Limited
- 12.1.15.1. Company Overview
- 12.1.15.2. Products
- 12.1.15.3. Company Financials
- 12.1.15.4. SWOT Analysis
- 12.1.1 MITSUI & CO LTD
- 12.2. Market Entropy
- 12.2.1 Company's Key Areas Served
- 12.2.2 Recent Developments
- 12.3. Company Market Share Analysis 2025
- 12.3.1 Top 5 Companies Market Share Analysis
- 12.3.2 Top 3 Companies Market Share Analysis
- 12.4. List of Potential Customers
- 13. Research Methodology
List of Figures
- Figure 1: Global Industrial Salts Industry Revenue Breakdown (million, %) by Region 2025 & 2033
- Figure 2: Global Industrial Salts Industry Volume Breakdown (K Tons, %) by Region 2025 & 2033
- Figure 3: Asia Pacific Industrial Salts Industry Revenue (million), by Source 2025 & 2033
- Figure 4: Asia Pacific Industrial Salts Industry Volume (K Tons), by Source 2025 & 2033
- Figure 5: Asia Pacific Industrial Salts Industry Revenue Share (%), by Source 2025 & 2033
- Figure 6: Asia Pacific Industrial Salts Industry Volume Share (%), by Source 2025 & 2033
- Figure 7: Asia Pacific Industrial Salts Industry Revenue (million), by Manufacturing Process 2025 & 2033
- Figure 8: Asia Pacific Industrial Salts Industry Volume (K Tons), by Manufacturing Process 2025 & 2033
- Figure 9: Asia Pacific Industrial Salts Industry Revenue Share (%), by Manufacturing Process 2025 & 2033
- Figure 10: Asia Pacific Industrial Salts Industry Volume Share (%), by Manufacturing Process 2025 & 2033
- Figure 11: Asia Pacific Industrial Salts Industry Revenue (million), by Application 2025 & 2033
- Figure 12: Asia Pacific Industrial Salts Industry Volume (K Tons), by Application 2025 & 2033
- Figure 13: Asia Pacific Industrial Salts Industry Revenue Share (%), by Application 2025 & 2033
- Figure 14: Asia Pacific Industrial Salts Industry Volume Share (%), by Application 2025 & 2033
- Figure 15: Asia Pacific Industrial Salts Industry Revenue (million), by Country 2025 & 2033
- Figure 16: Asia Pacific Industrial Salts Industry Volume (K Tons), by Country 2025 & 2033
- Figure 17: Asia Pacific Industrial Salts Industry Revenue Share (%), by Country 2025 & 2033
- Figure 18: Asia Pacific Industrial Salts Industry Volume Share (%), by Country 2025 & 2033
- Figure 19: North America Industrial Salts Industry Revenue (million), by Source 2025 & 2033
- Figure 20: North America Industrial Salts Industry Volume (K Tons), by Source 2025 & 2033
- Figure 21: North America Industrial Salts Industry Revenue Share (%), by Source 2025 & 2033
- Figure 22: North America Industrial Salts Industry Volume Share (%), by Source 2025 & 2033
- Figure 23: North America Industrial Salts Industry Revenue (million), by Manufacturing Process 2025 & 2033
- Figure 24: North America Industrial Salts Industry Volume (K Tons), by Manufacturing Process 2025 & 2033
- Figure 25: North America Industrial Salts Industry Revenue Share (%), by Manufacturing Process 2025 & 2033
- Figure 26: North America Industrial Salts Industry Volume Share (%), by Manufacturing Process 2025 & 2033
- Figure 27: North America Industrial Salts Industry Revenue (million), by Application 2025 & 2033
- Figure 28: North America Industrial Salts Industry Volume (K Tons), by Application 2025 & 2033
- Figure 29: North America Industrial Salts Industry Revenue Share (%), by Application 2025 & 2033
- Figure 30: North America Industrial Salts Industry Volume Share (%), by Application 2025 & 2033
- Figure 31: North America Industrial Salts Industry Revenue (million), by Country 2025 & 2033
- Figure 32: North America Industrial Salts Industry Volume (K Tons), by Country 2025 & 2033
- Figure 33: North America Industrial Salts Industry Revenue Share (%), by Country 2025 & 2033
- Figure 34: North America Industrial Salts Industry Volume Share (%), by Country 2025 & 2033
- Figure 35: Europe Industrial Salts Industry Revenue (million), by Source 2025 & 2033
- Figure 36: Europe Industrial Salts Industry Volume (K Tons), by Source 2025 & 2033
- Figure 37: Europe Industrial Salts Industry Revenue Share (%), by Source 2025 & 2033
- Figure 38: Europe Industrial Salts Industry Volume Share (%), by Source 2025 & 2033
- Figure 39: Europe Industrial Salts Industry Revenue (million), by Manufacturing Process 2025 & 2033
- Figure 40: Europe Industrial Salts Industry Volume (K Tons), by Manufacturing Process 2025 & 2033
- Figure 41: Europe Industrial Salts Industry Revenue Share (%), by Manufacturing Process 2025 & 2033
- Figure 42: Europe Industrial Salts Industry Volume Share (%), by Manufacturing Process 2025 & 2033
- Figure 43: Europe Industrial Salts Industry Revenue (million), by Application 2025 & 2033
- Figure 44: Europe Industrial Salts Industry Volume (K Tons), by Application 2025 & 2033
- Figure 45: Europe Industrial Salts Industry Revenue Share (%), by Application 2025 & 2033
- Figure 46: Europe Industrial Salts Industry Volume Share (%), by Application 2025 & 2033
- Figure 47: Europe Industrial Salts Industry Revenue (million), by Country 2025 & 2033
- Figure 48: Europe Industrial Salts Industry Volume (K Tons), by Country 2025 & 2033
- Figure 49: Europe Industrial Salts Industry Revenue Share (%), by Country 2025 & 2033
- Figure 50: Europe Industrial Salts Industry Volume Share (%), by Country 2025 & 2033
- Figure 51: South America Industrial Salts Industry Revenue (million), by Source 2025 & 2033
- Figure 52: South America Industrial Salts Industry Volume (K Tons), by Source 2025 & 2033
- Figure 53: South America Industrial Salts Industry Revenue Share (%), by Source 2025 & 2033
- Figure 54: South America Industrial Salts Industry Volume Share (%), by Source 2025 & 2033
- Figure 55: South America Industrial Salts Industry Revenue (million), by Manufacturing Process 2025 & 2033
- Figure 56: South America Industrial Salts Industry Volume (K Tons), by Manufacturing Process 2025 & 2033
- Figure 57: South America Industrial Salts Industry Revenue Share (%), by Manufacturing Process 2025 & 2033
- Figure 58: South America Industrial Salts Industry Volume Share (%), by Manufacturing Process 2025 & 2033
- Figure 59: South America Industrial Salts Industry Revenue (million), by Application 2025 & 2033
- Figure 60: South America Industrial Salts Industry Volume (K Tons), by Application 2025 & 2033
- Figure 61: South America Industrial Salts Industry Revenue Share (%), by Application 2025 & 2033
- Figure 62: South America Industrial Salts Industry Volume Share (%), by Application 2025 & 2033
- Figure 63: South America Industrial Salts Industry Revenue (million), by Country 2025 & 2033
- Figure 64: South America Industrial Salts Industry Volume (K Tons), by Country 2025 & 2033
- Figure 65: South America Industrial Salts Industry Revenue Share (%), by Country 2025 & 2033
- Figure 66: South America Industrial Salts Industry Volume Share (%), by Country 2025 & 2033
- Figure 67: Middle East and Africa Industrial Salts Industry Revenue (million), by Source 2025 & 2033
- Figure 68: Middle East and Africa Industrial Salts Industry Volume (K Tons), by Source 2025 & 2033
- Figure 69: Middle East and Africa Industrial Salts Industry Revenue Share (%), by Source 2025 & 2033
- Figure 70: Middle East and Africa Industrial Salts Industry Volume Share (%), by Source 2025 & 2033
- Figure 71: Middle East and Africa Industrial Salts Industry Revenue (million), by Manufacturing Process 2025 & 2033
- Figure 72: Middle East and Africa Industrial Salts Industry Volume (K Tons), by Manufacturing Process 2025 & 2033
- Figure 73: Middle East and Africa Industrial Salts Industry Revenue Share (%), by Manufacturing Process 2025 & 2033
- Figure 74: Middle East and Africa Industrial Salts Industry Volume Share (%), by Manufacturing Process 2025 & 2033
- Figure 75: Middle East and Africa Industrial Salts Industry Revenue (million), by Application 2025 & 2033
- Figure 76: Middle East and Africa Industrial Salts Industry Volume (K Tons), by Application 2025 & 2033
- Figure 77: Middle East and Africa Industrial Salts Industry Revenue Share (%), by Application 2025 & 2033
- Figure 78: Middle East and Africa Industrial Salts Industry Volume Share (%), by Application 2025 & 2033
- Figure 79: Middle East and Africa Industrial Salts Industry Revenue (million), by Country 2025 & 2033
- Figure 80: Middle East and Africa Industrial Salts Industry Volume (K Tons), by Country 2025 & 2033
- Figure 81: Middle East and Africa Industrial Salts Industry Revenue Share (%), by Country 2025 & 2033
- Figure 82: Middle East and Africa Industrial Salts Industry Volume Share (%), by Country 2025 & 2033
List of Tables
- Table 1: Global Industrial Salts Industry Revenue million Forecast, by Source 2020 & 2033
- Table 2: Global Industrial Salts Industry Volume K Tons Forecast, by Source 2020 & 2033
- Table 3: Global Industrial Salts Industry Revenue million Forecast, by Manufacturing Process 2020 & 2033
- Table 4: Global Industrial Salts Industry Volume K Tons Forecast, by Manufacturing Process 2020 & 2033
- Table 5: Global Industrial Salts Industry Revenue million Forecast, by Application 2020 & 2033
- Table 6: Global Industrial Salts Industry Volume K Tons Forecast, by Application 2020 & 2033
- Table 7: Global Industrial Salts Industry Revenue million Forecast, by Region 2020 & 2033
- Table 8: Global Industrial Salts Industry Volume K Tons Forecast, by Region 2020 & 2033
- Table 9: Global Industrial Salts Industry Revenue million Forecast, by Source 2020 & 2033
- Table 10: Global Industrial Salts Industry Volume K Tons Forecast, by Source 2020 & 2033
- Table 11: Global Industrial Salts Industry Revenue million Forecast, by Manufacturing Process 2020 & 2033
- Table 12: Global Industrial Salts Industry Volume K Tons Forecast, by Manufacturing Process 2020 & 2033
- Table 13: Global Industrial Salts Industry Revenue million Forecast, by Application 2020 & 2033
- Table 14: Global Industrial Salts Industry Volume K Tons Forecast, by Application 2020 & 2033
- Table 15: Global Industrial Salts Industry Revenue million Forecast, by Country 2020 & 2033
- Table 16: Global Industrial Salts Industry Volume K Tons Forecast, by Country 2020 & 2033
- Table 17: China Industrial Salts Industry Revenue (million) Forecast, by Application 2020 & 2033
- Table 18: China Industrial Salts Industry Volume (K Tons) Forecast, by Application 2020 & 2033
- Table 19: India Industrial Salts Industry Revenue (million) Forecast, by Application 2020 & 2033
- Table 20: India Industrial Salts Industry Volume (K Tons) Forecast, by Application 2020 & 2033
- Table 21: Japan Industrial Salts Industry Revenue (million) Forecast, by Application 2020 & 2033
- Table 22: Japan Industrial Salts Industry Volume (K Tons) Forecast, by Application 2020 & 2033
- Table 23: South Korea Industrial Salts Industry Revenue (million) Forecast, by Application 2020 & 2033
- Table 24: South Korea Industrial Salts Industry Volume (K Tons) Forecast, by Application 2020 & 2033
- Table 25: Rest of Asia Pacific Industrial Salts Industry Revenue (million) Forecast, by Application 2020 & 2033
- Table 26: Rest of Asia Pacific Industrial Salts Industry Volume (K Tons) Forecast, by Application 2020 & 2033
- Table 27: Global Industrial Salts Industry Revenue million Forecast, by Source 2020 & 2033
- Table 28: Global Industrial Salts Industry Volume K Tons Forecast, by Source 2020 & 2033
- Table 29: Global Industrial Salts Industry Revenue million Forecast, by Manufacturing Process 2020 & 2033
- Table 30: Global Industrial Salts Industry Volume K Tons Forecast, by Manufacturing Process 2020 & 2033
- Table 31: Global Industrial Salts Industry Revenue million Forecast, by Application 2020 & 2033
- Table 32: Global Industrial Salts Industry Volume K Tons Forecast, by Application 2020 & 2033
- Table 33: Global Industrial Salts Industry Revenue million Forecast, by Country 2020 & 2033
- Table 34: Global Industrial Salts Industry Volume K Tons Forecast, by Country 2020 & 2033
- Table 35: United States Industrial Salts Industry Revenue (million) Forecast, by Application 2020 & 2033
- Table 36: United States Industrial Salts Industry Volume (K Tons) Forecast, by Application 2020 & 2033
- Table 37: Canada Industrial Salts Industry Revenue (million) Forecast, by Application 2020 & 2033
- Table 38: Canada Industrial Salts Industry Volume (K Tons) Forecast, by Application 2020 & 2033
- Table 39: Mexico Industrial Salts Industry Revenue (million) Forecast, by Application 2020 & 2033
- Table 40: Mexico Industrial Salts Industry Volume (K Tons) Forecast, by Application 2020 & 2033
- Table 41: Global Industrial Salts Industry Revenue million Forecast, by Source 2020 & 2033
- Table 42: Global Industrial Salts Industry Volume K Tons Forecast, by Source 2020 & 2033
- Table 43: Global Industrial Salts Industry Revenue million Forecast, by Manufacturing Process 2020 & 2033
- Table 44: Global Industrial Salts Industry Volume K Tons Forecast, by Manufacturing Process 2020 & 2033
- Table 45: Global Industrial Salts Industry Revenue million Forecast, by Application 2020 & 2033
- Table 46: Global Industrial Salts Industry Volume K Tons Forecast, by Application 2020 & 2033
- Table 47: Global Industrial Salts Industry Revenue million Forecast, by Country 2020 & 2033
- Table 48: Global Industrial Salts Industry Volume K Tons Forecast, by Country 2020 & 2033
- Table 49: Germany Industrial Salts Industry Revenue (million) Forecast, by Application 2020 & 2033
- Table 50: Germany Industrial Salts Industry Volume (K Tons) Forecast, by Application 2020 & 2033
- Table 51: United Kingdom Industrial Salts Industry Revenue (million) Forecast, by Application 2020 & 2033
- Table 52: United Kingdom Industrial Salts Industry Volume (K Tons) Forecast, by Application 2020 & 2033
- Table 53: France Industrial Salts Industry Revenue (million) Forecast, by Application 2020 & 2033
- Table 54: France Industrial Salts Industry Volume (K Tons) Forecast, by Application 2020 & 2033
- Table 55: Italy Industrial Salts Industry Revenue (million) Forecast, by Application 2020 & 2033
- Table 56: Italy Industrial Salts Industry Volume (K Tons) Forecast, by Application 2020 & 2033
- Table 57: Rest of Europe Industrial Salts Industry Revenue (million) Forecast, by Application 2020 & 2033
- Table 58: Rest of Europe Industrial Salts Industry Volume (K Tons) Forecast, by Application 2020 & 2033
- Table 59: Global Industrial Salts Industry Revenue million Forecast, by Source 2020 & 2033
- Table 60: Global Industrial Salts Industry Volume K Tons Forecast, by Source 2020 & 2033
- Table 61: Global Industrial Salts Industry Revenue million Forecast, by Manufacturing Process 2020 & 2033
- Table 62: Global Industrial Salts Industry Volume K Tons Forecast, by Manufacturing Process 2020 & 2033
- Table 63: Global Industrial Salts Industry Revenue million Forecast, by Application 2020 & 2033
- Table 64: Global Industrial Salts Industry Volume K Tons Forecast, by Application 2020 & 2033
- Table 65: Global Industrial Salts Industry Revenue million Forecast, by Country 2020 & 2033
- Table 66: Global Industrial Salts Industry Volume K Tons Forecast, by Country 2020 & 2033
- Table 67: Brazil Industrial Salts Industry Revenue (million) Forecast, by Application 2020 & 2033
- Table 68: Brazil Industrial Salts Industry Volume (K Tons) Forecast, by Application 2020 & 2033
- Table 69: Argentina Industrial Salts Industry Revenue (million) Forecast, by Application 2020 & 2033
- Table 70: Argentina Industrial Salts Industry Volume (K Tons) Forecast, by Application 2020 & 2033
- Table 71: Rest of South America Industrial Salts Industry Revenue (million) Forecast, by Application 2020 & 2033
- Table 72: Rest of South America Industrial Salts Industry Volume (K Tons) Forecast, by Application 2020 & 2033
- Table 73: Global Industrial Salts Industry Revenue million Forecast, by Source 2020 & 2033
- Table 74: Global Industrial Salts Industry Volume K Tons Forecast, by Source 2020 & 2033
- Table 75: Global Industrial Salts Industry Revenue million Forecast, by Manufacturing Process 2020 & 2033
- Table 76: Global Industrial Salts Industry Volume K Tons Forecast, by Manufacturing Process 2020 & 2033
- Table 77: Global Industrial Salts Industry Revenue million Forecast, by Application 2020 & 2033
- Table 78: Global Industrial Salts Industry Volume K Tons Forecast, by Application 2020 & 2033
- Table 79: Global Industrial Salts Industry Revenue million Forecast, by Country 2020 & 2033
- Table 80: Global Industrial Salts Industry Volume K Tons Forecast, by Country 2020 & 2033
- Table 81: Saudi Arabia Industrial Salts Industry Revenue (million) Forecast, by Application 2020 & 2033
- Table 82: Saudi Arabia Industrial Salts Industry Volume (K Tons) Forecast, by Application 2020 & 2033
- Table 83: South Africa Industrial Salts Industry Revenue (million) Forecast, by Application 2020 & 2033
- Table 84: South Africa Industrial Salts Industry Volume (K Tons) Forecast, by Application 2020 & 2033
- Table 85: Rest of Middle East and Africa Industrial Salts Industry Revenue (million) Forecast, by Application 2020 & 2033
- Table 86: Rest of Middle East and Africa Industrial Salts Industry Volume (K Tons) Forecast, by Application 2020 & 2033
Frequently Asked Questions
1. What is the projected Compound Annual Growth Rate (CAGR) of the Industrial Salts Industry?
The projected CAGR is approximately 2.2%.
2. Which companies are prominent players in the Industrial Salts Industry?
Key companies in the market include MITSUI & CO LTD, Cargill Incorporated, Salins IAA, Nouryon, INEOS, Tata Chemicals Ltd, Archean Group, Donald Brown Group, Rio Tinto, Delmon Group of Companies, K+S Aktiengesellschaft, Morton Salt Inc, Exportadora de Sal de CV, Compass Minerals, Dominion Salt Limited.
3. What are the main segments of the Industrial Salts Industry?
The market segments include Source, Manufacturing Process, Application.
4. Can you provide details about the market size?
The market size is estimated to be USD 238.55 million as of 2022.
5. What are some drivers contributing to market growth?
Increasing Demand in Chemical Processing; Growing Demand from Water Treatment.
6. What are the notable trends driving market growth?
Increasing Demand from Chemicals Processing Application.
7. Are there any restraints impacting market growth?
Stringent Government Regulations; Unfavorable Conditions Arising due to the Impact of COVID-19.
8. Can you provide examples of recent developments in the market?
In January 2021, Tata Chemicals Ltd intended to acquire the industrial salt unit with an annual production capacity of 3 million tons of Archean Group, which would enhance the company's business.
9. What pricing options are available for accessing the report?
Pricing options include single-user, multi-user, and enterprise licenses priced at USD 4750, USD 5250, and USD 8750 respectively.
10. Is the market size provided in terms of value or volume?
The market size is provided in terms of value, measured in million and volume, measured in K Tons.
11. Are there any specific market keywords associated with the report?
Yes, the market keyword associated with the report is "Industrial Salts Industry," which aids in identifying and referencing the specific market segment covered.
12. How do I determine which pricing option suits my needs best?
The pricing options vary based on user requirements and access needs. Individual users may opt for single-user licenses, while businesses requiring broader access may choose multi-user or enterprise licenses for cost-effective access to the report.
13. Are there any additional resources or data provided in the Industrial Salts Industry report?
While the report offers comprehensive insights, it's advisable to review the specific contents or supplementary materials provided to ascertain if additional resources or data are available.
14. How can I stay updated on further developments or reports in the Industrial Salts Industry?
To stay informed about further developments, trends, and reports in the Industrial Salts Industry, consider subscribing to industry newsletters, following relevant companies and organizations, or regularly checking reputable industry news sources and publications.
Methodology
Step 1 - Identification of Relevant Samples Size from Population Database


Step 2 - Approaches for Defining Global Market Size (Value, Volume* & Price*)

Note*: In applicable scenarios
Step 3 - Data Sources
Primary Research
- Web Analytics
- Survey Reports
- Research Institute
- Latest Research Reports
- Opinion Leaders
Secondary Research
- Annual Reports
- White Paper
- Latest Press Release
- Industry Association
- Paid Database
- Investor Presentations

Step 4 - Data Triangulation
Involves using different sources of information in order to increase the validity of a study
These sources are likely to be stakeholders in a program - participants, other researchers, program staff, other community members, and so on.
Then we put all data in single framework & apply various statistical tools to find out the dynamic on the market.
During the analysis stage, feedback from the stakeholder groups would be compared to determine areas of agreement as well as areas of divergence