

Key Insights
The global Laboratory Cleaning Agents market is poised for significant expansion, projected to reach approximately $1,064 million by 2025. This robust growth is underpinned by a compelling Compound Annual Growth Rate (CAGR) of 7% throughout the forecast period of 2025-2033. A primary driver for this upward trajectory is the increasing demand for specialized cleaning solutions across diverse laboratory settings, including chemistry, biology, and medical fields. Advancements in scientific research and the continuous development of new analytical techniques necessitate stringent hygiene protocols and the use of high-performance cleaning agents to ensure accurate and reproducible results. Furthermore, the growing emphasis on maintaining sterile environments in pharmaceutical manufacturing and healthcare settings, coupled with stringent regulatory compliance, is fueling the adoption of advanced laboratory cleaning solutions. The market is also benefiting from technological innovations in cleaning formulations, leading to the development of eco-friendly, safer, and more effective products that address specific contamination challenges.
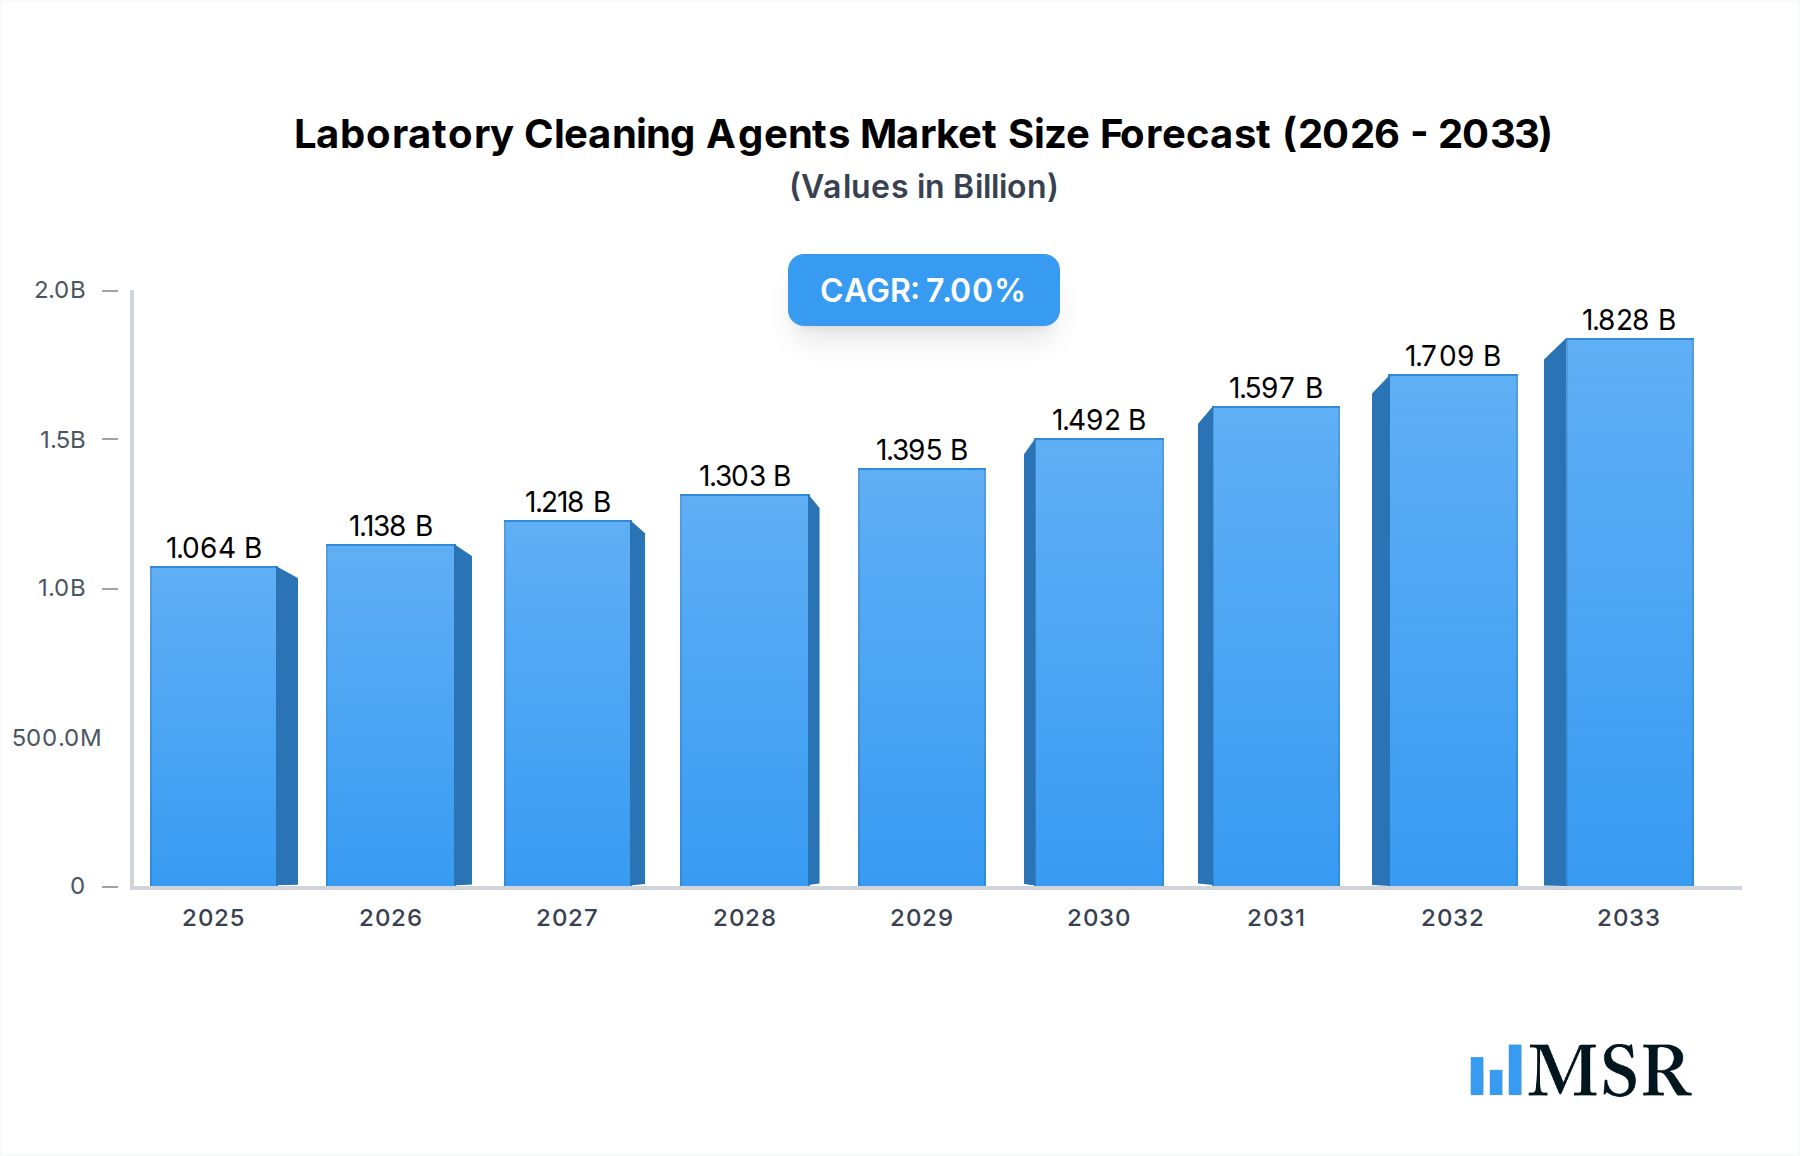
Laboratory Cleaning Agents Market Size (In Billion)
Key trends shaping the Laboratory Cleaning Agents market include the rising preference for biodegradable and non-toxic cleaning formulations, driven by environmental concerns and workplace safety regulations. The increasing automation in laboratories also influences the demand for cleaning agents compatible with automated cleaning systems, thereby enhancing efficiency and reducing human error. Segmentation analysis reveals that Chemistry and Biology Laboratories are expected to constitute the largest application segments, owing to their extensive use of a wide array of sophisticated equipment requiring regular and thorough cleaning. Within the types segment, Alkaline Cleaning Solutions are likely to dominate, given their effectiveness in removing organic residues and biofilms common in laboratory environments. While the market is robust, potential restraints such as the high cost of specialized cleaning agents and the availability of less effective but cheaper alternatives could pose challenges. However, the overarching need for precision and contamination control in scientific endeavors is expected to propel the market forward, with North America and Europe anticipated to be leading regions due to their well-established research infrastructure and stringent quality standards.

Laboratory Cleaning Agents Company Market Share
This comprehensive report, "Laboratory Cleaning Agents Market: Analysis and Forecast 2019–2033," provides an in-depth examination of the global laboratory cleaning agents sector. It offers critical insights for stakeholders navigating this dynamic market, covering market concentration, industry trends, key segments, product developments, challenges, growth drivers, emerging opportunities, and leading players. The report utilizes a study period from 2019 to 2033, with 2025 as the base and estimated year, and a forecast period extending from 2025 to 2033, incorporating historical data from 2019 to 2024. With an estimated market size in the billions of dollars and projected growth rates, this report is an indispensable resource for chemical suppliers, laboratory equipment manufacturers, research institutions, and procurement managers.
Laboratory Cleaning Agents Market Concentration & Dynamics
The global laboratory cleaning agents market exhibits a moderate to high concentration, with several key players holding significant market share. Leading companies like Merck, 3M, and Avantor are at the forefront, leveraging their extensive distribution networks and strong R&D capabilities. The innovation ecosystem is robust, driven by advancements in chemical formulations for enhanced efficacy, environmental sustainability, and specialized applications across chemistry, biology, and medical laboratories. Regulatory frameworks, primarily focused on safety, environmental impact, and efficacy testing, are crucial in shaping market entry and product development. Substitute products, such as basic detergents and manual cleaning methods, exist but often lack the precision and effectiveness required for sensitive laboratory environments. End-user trends indicate a growing demand for eco-friendly and biodegradable cleaning solutions, as well as specialized agents for complex analytical instrumentation and sensitive biological samples. Mergers and acquisitions (M&A) activities have been observed, though less frequent, as larger entities seek to consolidate market share and acquire innovative technologies. The number of M&A deals in the historical period (2019-2024) is estimated to be in the range of 10-20, indicating strategic consolidation rather than aggressive expansion.
Laboratory Cleaning Agents Industry Insights & Trends
The laboratory cleaning agents market is experiencing steady growth, driven by increasing investments in research and development across various scientific disciplines. The estimated market size for laboratory cleaning agents is approximately $5,000 million in the base year 2025. This growth is propelled by the expanding number of research laboratories globally, particularly in the life sciences, pharmaceuticals, and biotechnology sectors. Technological disruptions are also playing a significant role, with the development of advanced cleaning solutions that offer superior performance, reduced residue, and enhanced safety profiles. For instance, the advent of enzymatic cleaners and precision cleaning agents for microfluidic devices and sensitive analytical equipment is transforming laboratory practices. Evolving consumer behaviors within the scientific community emphasize the demand for sustainable and green chemistry alternatives. Researchers are increasingly seeking cleaning agents that minimize environmental impact, reduce hazardous waste, and comply with stringent environmental regulations. This shift towards sustainability is fostering innovation in biodegradable formulations and water-saving cleaning processes. Furthermore, the automation of laboratory workflows necessitates specialized cleaning agents compatible with automated cleaning systems and robotic platforms. The compound annual growth rate (CAGR) for the laboratory cleaning agents market is projected to be around 6.5% from 2025 to 2033, reflecting a healthy and sustained expansion. The increasing complexity of laboratory experiments and the need for pristine conditions to ensure accurate results are also significant market drivers.
Key Markets & Segments Leading Laboratory Cleaning Agents
The global laboratory cleaning agents market is dominated by the Medical Laboratory segment, which accounts for approximately 40% of the total market revenue. This dominance is attributed to the stringent hygiene and sterility requirements in medical diagnostic and research settings, including hospitals, clinical research organizations (CROs), and pharmaceutical quality control laboratories.
- Drivers for Medical Laboratory Dominance:
- Increasing Healthcare Expenditure: Rising global healthcare spending fuels the expansion of medical research and diagnostic facilities, directly boosting demand for laboratory cleaning agents.
- Stringent Regulatory Standards: Regulations from bodies like the FDA and EMA mandate rigorous cleaning protocols to prevent cross-contamination and ensure patient safety, driving the need for high-performance cleaning solutions.
- Prevalence of Chronic Diseases: The growing burden of chronic diseases necessitates advanced research and diagnostic capabilities, further expanding the medical laboratory sector.
- Growth in Biopharmaceutical Research: The booming biopharmaceutical industry relies heavily on meticulous laboratory practices for drug discovery, development, and quality assurance.
The Chemistry Laboratory segment represents another significant market, comprising around 30% of the market share. This segment is driven by the vast array of chemical research, analytical testing, and synthesis activities across academia and industry.
- Drivers for Chemistry Laboratory Dominance:
- Expansion of Chemical Industries: Growth in petrochemicals, specialty chemicals, and materials science research fuels demand for specialized cleaning agents for analytical instruments and reaction vessels.
- Advancements in Analytical Techniques: Sophisticated analytical techniques like chromatography and spectroscopy require meticulous cleaning to maintain instrument sensitivity and accuracy.
- Academic Research Growth: Universities and research institutions are continuously expanding their chemistry departments, leading to sustained demand for cleaning agents.
The Biology Laboratory segment, with an estimated 25% market share, is also a key contributor, driven by advancements in molecular biology, genetics, and cell culture research.
- Drivers for Biology Laboratory Dominance:
- Genomics and Proteomics Research: The rapid growth in these fields requires sterile environments and specialized cleaning for sensitive equipment.
- Cell Culture Applications: Maintaining aseptic conditions in cell culture laboratories is paramount, necessitating effective and gentle cleaning agents.
- Biotechnology Advancements: The burgeoning biotechnology sector, encompassing areas like genetic engineering and synthetic biology, relies heavily on clean laboratory practices.
In terms of Type, Neutral Cleaners hold the largest market share, estimated at over 50%. This is due to their broad applicability across various laboratory materials and instruments, offering effective cleaning without harsh chemical reactions. Alkaline Cleaning Solutions are also widely used, particularly for removing stubborn organic residues, and represent approximately 30% of the market. The "Others" category, encompassing acidic cleaners, enzymatic cleaners, and specialized solvent-based cleaners, accounts for the remaining share and is expected to witness higher growth due to niche applications. Geographically, North America and Europe currently lead the market, but the Asia-Pacific region is emerging as a significant growth hub due to increasing R&D investments and the expansion of pharmaceutical and biotechnology industries in countries like China and India.
Laboratory Cleaning Agents Product Developments
Product innovation in the laboratory cleaning agents market is characterized by a strong focus on enhanced efficacy, environmental sustainability, and user safety. Manufacturers are developing advanced formulations that provide superior cleaning power for complex residues, while simultaneously minimizing environmental impact through biodegradable ingredients and reduced volatile organic compounds (VOCs). Specialized cleaners for sensitive analytical instrumentation, such as HPLC systems, mass spectrometers, and electron microscopes, are gaining prominence. These products are designed to prevent residue buildup, maintain instrument performance, and extend equipment lifespan. Furthermore, the trend towards green chemistry is driving the development of aqueous-based and enzyme-based cleaning solutions that offer effective decontamination without the use of harsh solvents. The market is also witnessing the introduction of ready-to-use formulations and convenient packaging to streamline laboratory workflows and improve ease of use.
Challenges in the Laboratory Cleaning Agents Market
The laboratory cleaning agents market faces several challenges that can impede growth. Stringent regulatory compliance, particularly concerning chemical safety and environmental impact, necessitates significant investment in R&D and product registration, potentially increasing product costs and lead times for market entry. Fluctuations in raw material prices can impact manufacturing costs and profitability, especially for specialized chemical ingredients. Furthermore, the presence of a large number of smaller players offering generic or lower-cost alternatives creates intense price competition, particularly for less specialized applications. Supply chain disruptions, as witnessed in recent global events, can affect the availability of key raw materials and the timely delivery of finished products, impacting customer satisfaction and market reach.
Forces Driving Laboratory Cleaning Agents Growth
Several key forces are driving the growth of the laboratory cleaning agents market. The escalating global investment in research and development across life sciences, pharmaceuticals, biotechnology, and materials science is a primary catalyst, requiring increasingly sophisticated and effective cleaning solutions. Advancements in analytical instrumentation, such as high-resolution mass spectrometry and advanced chromatography techniques, demand ultra-pure and residue-free environments, thereby boosting the need for specialized cleaning agents. The growing emphasis on laboratory safety and compliance with regulatory standards, such as Good Laboratory Practice (GLP) and Good Manufacturing Practice (GMP), mandates the use of validated and certified cleaning agents. Furthermore, the increasing outsourcing of laboratory services by pharmaceutical and biotech companies fuels the demand for efficient and reliable cleaning protocols.
Challenges in the Laboratory Cleaning Agents Market
The long-term growth of the laboratory cleaning agents market is underpinned by several critical factors. Continuous innovation in developing novel cleaning chemistries, including enzyme-based and bio-based formulations, addresses the growing demand for sustainable and eco-friendly solutions. Strategic partnerships and collaborations between cleaning agent manufacturers and laboratory equipment providers are crucial for developing synergistic solutions that enhance instrument performance and longevity. Market expansion into emerging economies, driven by increasing R&D investments and the growth of the life sciences sector, presents significant long-term growth opportunities. The development of intelligent cleaning systems that integrate with laboratory automation and data management platforms will also shape future growth trajectories.
Emerging Opportunities in Laboratory Cleaning Agents
Emerging opportunities in the laboratory cleaning agents market are primarily driven by the growing demand for sustainable and eco-friendly products. The development of biodegradable, low-VOC, and water-saving cleaning solutions represents a significant growth area. The rapid expansion of the biopharmaceutical industry and the increasing complexity of drug discovery processes are creating demand for highly specialized cleaning agents for cell culture media, protein analysis, and genomics research. The miniaturization of laboratory equipment and the rise of microfluidics present opportunities for precision cleaning agents that can effectively clean intricate channels and surfaces. Furthermore, the growing adoption of laboratory automation and robotics necessitates compatible cleaning agents that can be integrated into automated cleaning workflows. The expanding market for in-vitro diagnostics (IVD) also presents a niche but growing opportunity for specialized cleaning agents to maintain the accuracy and reliability of diagnostic devices.
Leading Players in the Laboratory Cleaning Agents Sector
- Merck
- 3M
- Genesys
- Getinge
- International Products Corporation (IPC)
- Decon Laboratories
- Ambersil
- Alconox Inc
- COLE-PARMER
- Fishersci
- Thermo Scientific
- Labconco
- MP Biomedicals
- MilliporeSigma
- Cleaning Solution
- Avantor
- BrandTech
- Branson Ultrasonics
- Integra
- Cambridge Diagnostic Products
- Elma Schmidbauer GmbH
- Mopec Eazy Soak
- Zhongjing Keyi Technology
Key Milestones in Laboratory Cleaning Agents Industry
- 2019: Launch of new range of eco-friendly, biodegradable cleaning agents by Alconox Inc., aligning with growing sustainability trends.
- 2020: Merck enhances its portfolio with advanced cleaning solutions for biopharmaceutical manufacturing, addressing increased demand during the pandemic.
- 2021: 3M introduces novel surface disinfectants with enhanced efficacy for clinical and research laboratories, responding to heightened hygiene concerns.
- 2022: Genesys focuses on developing custom cleaning formulations for specialized analytical instruments, meeting niche market demands.
- 2023: Avantor expands its offerings with integrated cleaning and decontamination solutions for life science laboratories, providing a comprehensive approach.
- 2024: Thermo Scientific introduces advanced cleaning agents designed for automated laboratory platforms, supporting the trend of laboratory automation.
Strategic Outlook for Laboratory Cleaning Agents Market
The strategic outlook for the laboratory cleaning agents market is highly positive, driven by sustained innovation, growing R&D investments, and increasing demand for specialized and sustainable cleaning solutions. Manufacturers are poised to capitalize on the expanding biopharmaceutical and biotechnology sectors, requiring highly specific and effective cleaning agents. The focus on developing "green" and environmentally friendly products will continue to be a key differentiator. Strategic partnerships with laboratory equipment manufacturers and distributors will be crucial for market penetration and offering integrated solutions. Furthermore, expansion into emerging markets with burgeoning research infrastructure presents significant growth opportunities. The market is expected to witness a steady shift towards higher-value, specialized cleaning agents that offer enhanced performance, improved safety, and greater sustainability.
Laboratory Cleaning Agents Segmentation
-
1. Application
- 1.1. Chemistry Laboratory
- 1.2. Biology Laboratory
- 1.3. Medical Laboratory
- 1.4. Others
-
2. Type
- 2.1. Alkaline Cleaning Solution
- 2.2. Neutral Cleaner
- 2.3. Others
Laboratory Cleaning Agents Segmentation By Geography
-
1. North America
- 1.1. United States
- 1.2. Canada
- 1.3. Mexico
-
2. South America
- 2.1. Brazil
- 2.2. Argentina
- 2.3. Rest of South America
-
3. Europe
- 3.1. United Kingdom
- 3.2. Germany
- 3.3. France
- 3.4. Italy
- 3.5. Spain
- 3.6. Russia
- 3.7. Benelux
- 3.8. Nordics
- 3.9. Rest of Europe
-
4. Middle East & Africa
- 4.1. Turkey
- 4.2. Israel
- 4.3. GCC
- 4.4. North Africa
- 4.5. South Africa
- 4.6. Rest of Middle East & Africa
-
5. Asia Pacific
- 5.1. China
- 5.2. India
- 5.3. Japan
- 5.4. South Korea
- 5.5. ASEAN
- 5.6. Oceania
- 5.7. Rest of Asia Pacific
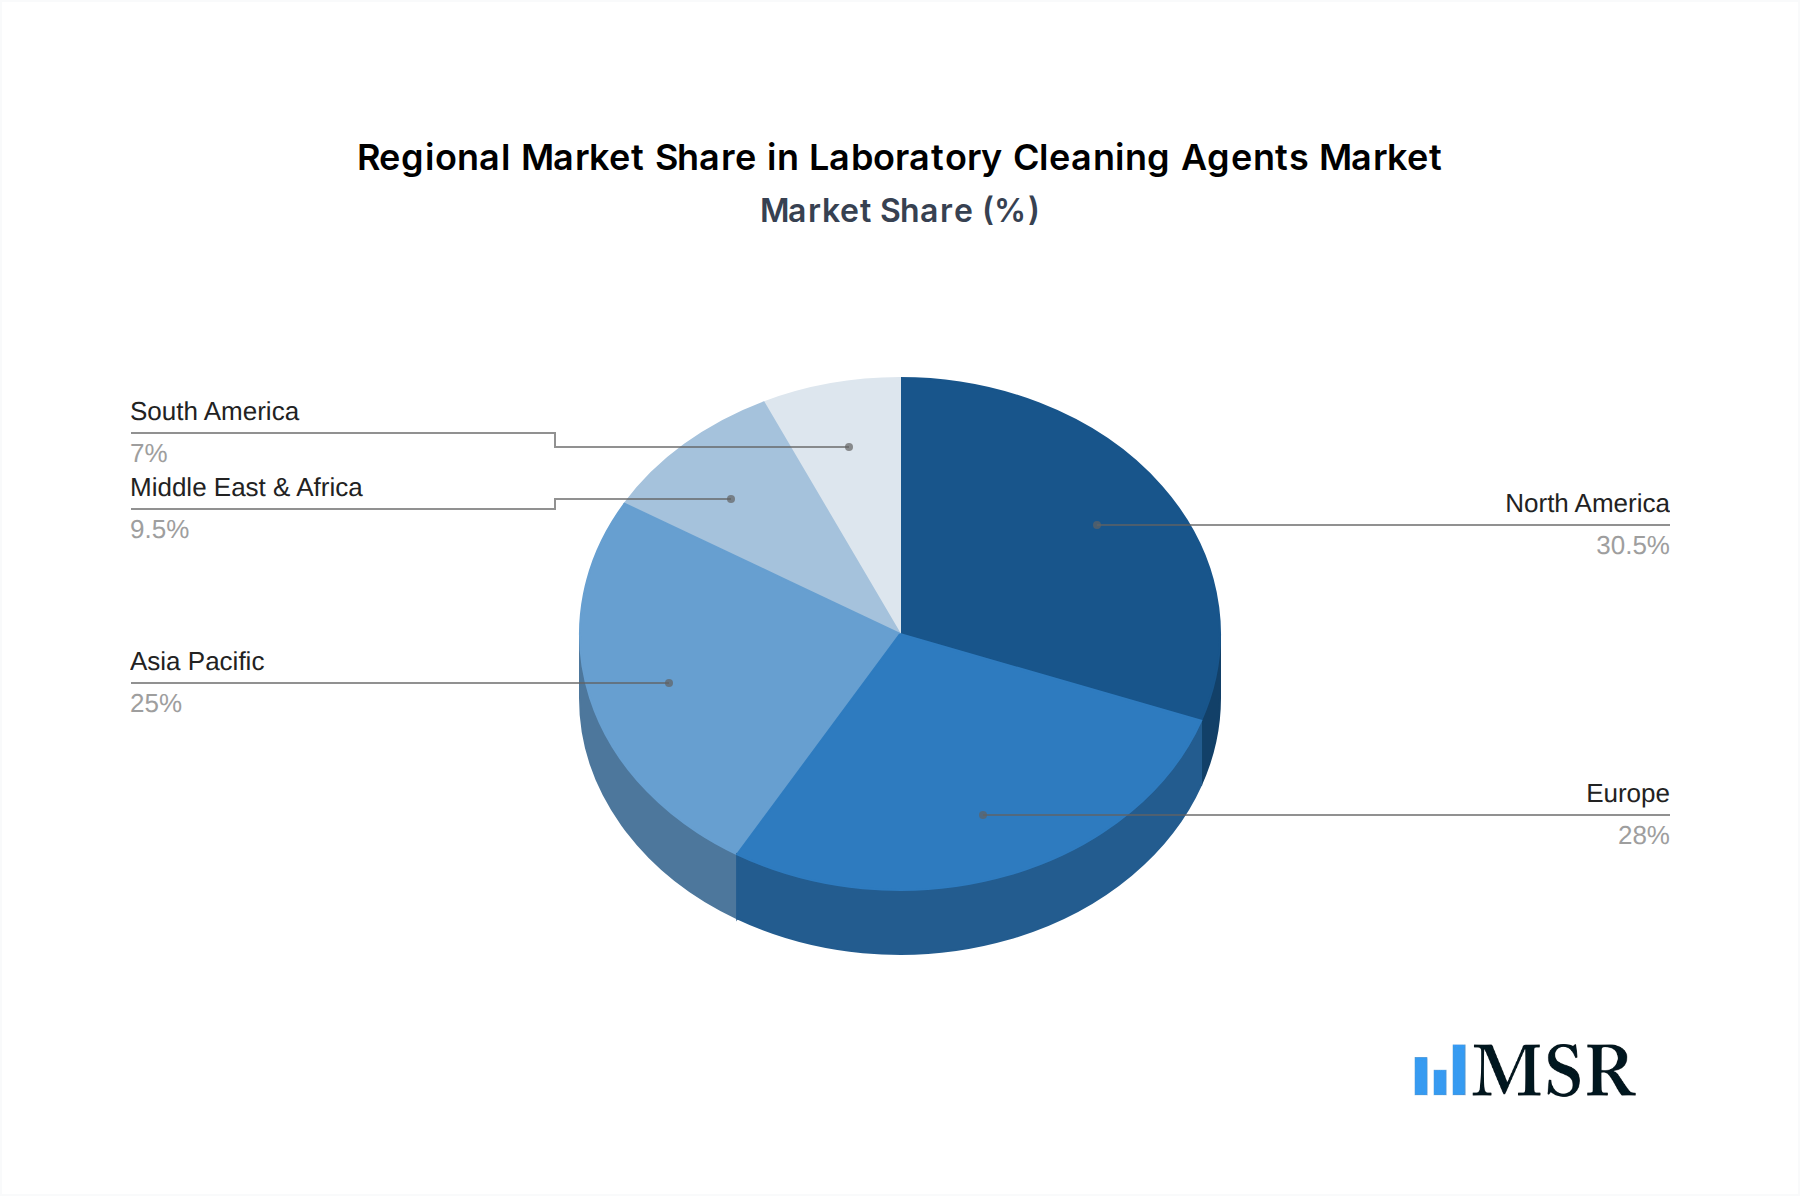
Laboratory Cleaning Agents Regional Market Share
Geographic Coverage of Laboratory Cleaning Agents
Laboratory Cleaning Agents REPORT HIGHLIGHTS
| Aspects | Details |
|---|---|
| Study Period | 2020-2034 |
| Base Year | 2025 |
| Estimated Year | 2026 |
| Forecast Period | 2026-2034 |
| Historical Period | 2020-2025 |
| Growth Rate | CAGR of 7% from 2020-2034 |
| Segmentation |
|
Table of Contents
- 1. Introduction
- 1.1. Research Scope
- 1.2. Market Segmentation
- 1.3. Research Methodology
- 1.4. Definitions and Assumptions
- 2. Executive Summary
- 2.1. Introduction
- 3. Market Dynamics
- 3.1. Introduction
- 3.2. Market Drivers
- 3.3. Market Restrains
- 3.4. Market Trends
- 4. Market Factor Analysis
- 4.1. Porters Five Forces
- 4.2. Supply/Value Chain
- 4.3. PESTEL analysis
- 4.4. Market Entropy
- 4.5. Patent/Trademark Analysis
- 5. Global Laboratory Cleaning Agents Analysis, Insights and Forecast, 2020-2032
- 5.1. Market Analysis, Insights and Forecast - by Application
- 5.1.1. Chemistry Laboratory
- 5.1.2. Biology Laboratory
- 5.1.3. Medical Laboratory
- 5.1.4. Others
- 5.2. Market Analysis, Insights and Forecast - by Type
- 5.2.1. Alkaline Cleaning Solution
- 5.2.2. Neutral Cleaner
- 5.2.3. Others
- 5.3. Market Analysis, Insights and Forecast - by Region
- 5.3.1. North America
- 5.3.2. South America
- 5.3.3. Europe
- 5.3.4. Middle East & Africa
- 5.3.5. Asia Pacific
- 5.1. Market Analysis, Insights and Forecast - by Application
- 6. North America Laboratory Cleaning Agents Analysis, Insights and Forecast, 2020-2032
- 6.1. Market Analysis, Insights and Forecast - by Application
- 6.1.1. Chemistry Laboratory
- 6.1.2. Biology Laboratory
- 6.1.3. Medical Laboratory
- 6.1.4. Others
- 6.2. Market Analysis, Insights and Forecast - by Type
- 6.2.1. Alkaline Cleaning Solution
- 6.2.2. Neutral Cleaner
- 6.2.3. Others
- 6.1. Market Analysis, Insights and Forecast - by Application
- 7. South America Laboratory Cleaning Agents Analysis, Insights and Forecast, 2020-2032
- 7.1. Market Analysis, Insights and Forecast - by Application
- 7.1.1. Chemistry Laboratory
- 7.1.2. Biology Laboratory
- 7.1.3. Medical Laboratory
- 7.1.4. Others
- 7.2. Market Analysis, Insights and Forecast - by Type
- 7.2.1. Alkaline Cleaning Solution
- 7.2.2. Neutral Cleaner
- 7.2.3. Others
- 7.1. Market Analysis, Insights and Forecast - by Application
- 8. Europe Laboratory Cleaning Agents Analysis, Insights and Forecast, 2020-2032
- 8.1. Market Analysis, Insights and Forecast - by Application
- 8.1.1. Chemistry Laboratory
- 8.1.2. Biology Laboratory
- 8.1.3. Medical Laboratory
- 8.1.4. Others
- 8.2. Market Analysis, Insights and Forecast - by Type
- 8.2.1. Alkaline Cleaning Solution
- 8.2.2. Neutral Cleaner
- 8.2.3. Others
- 8.1. Market Analysis, Insights and Forecast - by Application
- 9. Middle East & Africa Laboratory Cleaning Agents Analysis, Insights and Forecast, 2020-2032
- 9.1. Market Analysis, Insights and Forecast - by Application
- 9.1.1. Chemistry Laboratory
- 9.1.2. Biology Laboratory
- 9.1.3. Medical Laboratory
- 9.1.4. Others
- 9.2. Market Analysis, Insights and Forecast - by Type
- 9.2.1. Alkaline Cleaning Solution
- 9.2.2. Neutral Cleaner
- 9.2.3. Others
- 9.1. Market Analysis, Insights and Forecast - by Application
- 10. Asia Pacific Laboratory Cleaning Agents Analysis, Insights and Forecast, 2020-2032
- 10.1. Market Analysis, Insights and Forecast - by Application
- 10.1.1. Chemistry Laboratory
- 10.1.2. Biology Laboratory
- 10.1.3. Medical Laboratory
- 10.1.4. Others
- 10.2. Market Analysis, Insights and Forecast - by Type
- 10.2.1. Alkaline Cleaning Solution
- 10.2.2. Neutral Cleaner
- 10.2.3. Others
- 10.1. Market Analysis, Insights and Forecast - by Application
- 11. Competitive Analysis
- 11.1. Global Market Share Analysis 2025
- 11.2. Company Profiles
- 11.2.1 Merck
- 11.2.1.1. Overview
- 11.2.1.2. Products
- 11.2.1.3. SWOT Analysis
- 11.2.1.4. Recent Developments
- 11.2.1.5. Financials (Based on Availability)
- 11.2.2 3M
- 11.2.2.1. Overview
- 11.2.2.2. Products
- 11.2.2.3. SWOT Analysis
- 11.2.2.4. Recent Developments
- 11.2.2.5. Financials (Based on Availability)
- 11.2.3 Genesys
- 11.2.3.1. Overview
- 11.2.3.2. Products
- 11.2.3.3. SWOT Analysis
- 11.2.3.4. Recent Developments
- 11.2.3.5. Financials (Based on Availability)
- 11.2.4 Getinge
- 11.2.4.1. Overview
- 11.2.4.2. Products
- 11.2.4.3. SWOT Analysis
- 11.2.4.4. Recent Developments
- 11.2.4.5. Financials (Based on Availability)
- 11.2.5 International Products Corporation(IPC)
- 11.2.5.1. Overview
- 11.2.5.2. Products
- 11.2.5.3. SWOT Analysis
- 11.2.5.4. Recent Developments
- 11.2.5.5. Financials (Based on Availability)
- 11.2.6 Decon Laboratories
- 11.2.6.1. Overview
- 11.2.6.2. Products
- 11.2.6.3. SWOT Analysis
- 11.2.6.4. Recent Developments
- 11.2.6.5. Financials (Based on Availability)
- 11.2.7 Ambersil
- 11.2.7.1. Overview
- 11.2.7.2. Products
- 11.2.7.3. SWOT Analysis
- 11.2.7.4. Recent Developments
- 11.2.7.5. Financials (Based on Availability)
- 11.2.8 Alconox Inc
- 11.2.8.1. Overview
- 11.2.8.2. Products
- 11.2.8.3. SWOT Analysis
- 11.2.8.4. Recent Developments
- 11.2.8.5. Financials (Based on Availability)
- 11.2.9 COLE-PARMER
- 11.2.9.1. Overview
- 11.2.9.2. Products
- 11.2.9.3. SWOT Analysis
- 11.2.9.4. Recent Developments
- 11.2.9.5. Financials (Based on Availability)
- 11.2.10 Fishersci
- 11.2.10.1. Overview
- 11.2.10.2. Products
- 11.2.10.3. SWOT Analysis
- 11.2.10.4. Recent Developments
- 11.2.10.5. Financials (Based on Availability)
- 11.2.11 Thermo Scientific
- 11.2.11.1. Overview
- 11.2.11.2. Products
- 11.2.11.3. SWOT Analysis
- 11.2.11.4. Recent Developments
- 11.2.11.5. Financials (Based on Availability)
- 11.2.12 Labconco
- 11.2.12.1. Overview
- 11.2.12.2. Products
- 11.2.12.3. SWOT Analysis
- 11.2.12.4. Recent Developments
- 11.2.12.5. Financials (Based on Availability)
- 11.2.13 MP Biomedicals
- 11.2.13.1. Overview
- 11.2.13.2. Products
- 11.2.13.3. SWOT Analysis
- 11.2.13.4. Recent Developments
- 11.2.13.5. Financials (Based on Availability)
- 11.2.14 MilliporeSigma
- 11.2.14.1. Overview
- 11.2.14.2. Products
- 11.2.14.3. SWOT Analysis
- 11.2.14.4. Recent Developments
- 11.2.14.5. Financials (Based on Availability)
- 11.2.15 Cleaning Solution
- 11.2.15.1. Overview
- 11.2.15.2. Products
- 11.2.15.3. SWOT Analysis
- 11.2.15.4. Recent Developments
- 11.2.15.5. Financials (Based on Availability)
- 11.2.16 Avantor
- 11.2.16.1. Overview
- 11.2.16.2. Products
- 11.2.16.3. SWOT Analysis
- 11.2.16.4. Recent Developments
- 11.2.16.5. Financials (Based on Availability)
- 11.2.17 BrandTech
- 11.2.17.1. Overview
- 11.2.17.2. Products
- 11.2.17.3. SWOT Analysis
- 11.2.17.4. Recent Developments
- 11.2.17.5. Financials (Based on Availability)
- 11.2.18 Branson Ultrasonics
- 11.2.18.1. Overview
- 11.2.18.2. Products
- 11.2.18.3. SWOT Analysis
- 11.2.18.4. Recent Developments
- 11.2.18.5. Financials (Based on Availability)
- 11.2.19 Integra
- 11.2.19.1. Overview
- 11.2.19.2. Products
- 11.2.19.3. SWOT Analysis
- 11.2.19.4. Recent Developments
- 11.2.19.5. Financials (Based on Availability)
- 11.2.20 Cambridge Diagnostic Products
- 11.2.20.1. Overview
- 11.2.20.2. Products
- 11.2.20.3. SWOT Analysis
- 11.2.20.4. Recent Developments
- 11.2.20.5. Financials (Based on Availability)
- 11.2.21 Elma Schmidbauer GmbH
- 11.2.21.1. Overview
- 11.2.21.2. Products
- 11.2.21.3. SWOT Analysis
- 11.2.21.4. Recent Developments
- 11.2.21.5. Financials (Based on Availability)
- 11.2.22 Mopec Eazy Soak
- 11.2.22.1. Overview
- 11.2.22.2. Products
- 11.2.22.3. SWOT Analysis
- 11.2.22.4. Recent Developments
- 11.2.22.5. Financials (Based on Availability)
- 11.2.23 Zhongjing Keyi Technology
- 11.2.23.1. Overview
- 11.2.23.2. Products
- 11.2.23.3. SWOT Analysis
- 11.2.23.4. Recent Developments
- 11.2.23.5. Financials (Based on Availability)
- 11.2.1 Merck
List of Figures
- Figure 1: Global Laboratory Cleaning Agents Revenue Breakdown (million, %) by Region 2025 & 2033
- Figure 2: Global Laboratory Cleaning Agents Volume Breakdown (K, %) by Region 2025 & 2033
- Figure 3: North America Laboratory Cleaning Agents Revenue (million), by Application 2025 & 2033
- Figure 4: North America Laboratory Cleaning Agents Volume (K), by Application 2025 & 2033
- Figure 5: North America Laboratory Cleaning Agents Revenue Share (%), by Application 2025 & 2033
- Figure 6: North America Laboratory Cleaning Agents Volume Share (%), by Application 2025 & 2033
- Figure 7: North America Laboratory Cleaning Agents Revenue (million), by Type 2025 & 2033
- Figure 8: North America Laboratory Cleaning Agents Volume (K), by Type 2025 & 2033
- Figure 9: North America Laboratory Cleaning Agents Revenue Share (%), by Type 2025 & 2033
- Figure 10: North America Laboratory Cleaning Agents Volume Share (%), by Type 2025 & 2033
- Figure 11: North America Laboratory Cleaning Agents Revenue (million), by Country 2025 & 2033
- Figure 12: North America Laboratory Cleaning Agents Volume (K), by Country 2025 & 2033
- Figure 13: North America Laboratory Cleaning Agents Revenue Share (%), by Country 2025 & 2033
- Figure 14: North America Laboratory Cleaning Agents Volume Share (%), by Country 2025 & 2033
- Figure 15: South America Laboratory Cleaning Agents Revenue (million), by Application 2025 & 2033
- Figure 16: South America Laboratory Cleaning Agents Volume (K), by Application 2025 & 2033
- Figure 17: South America Laboratory Cleaning Agents Revenue Share (%), by Application 2025 & 2033
- Figure 18: South America Laboratory Cleaning Agents Volume Share (%), by Application 2025 & 2033
- Figure 19: South America Laboratory Cleaning Agents Revenue (million), by Type 2025 & 2033
- Figure 20: South America Laboratory Cleaning Agents Volume (K), by Type 2025 & 2033
- Figure 21: South America Laboratory Cleaning Agents Revenue Share (%), by Type 2025 & 2033
- Figure 22: South America Laboratory Cleaning Agents Volume Share (%), by Type 2025 & 2033
- Figure 23: South America Laboratory Cleaning Agents Revenue (million), by Country 2025 & 2033
- Figure 24: South America Laboratory Cleaning Agents Volume (K), by Country 2025 & 2033
- Figure 25: South America Laboratory Cleaning Agents Revenue Share (%), by Country 2025 & 2033
- Figure 26: South America Laboratory Cleaning Agents Volume Share (%), by Country 2025 & 2033
- Figure 27: Europe Laboratory Cleaning Agents Revenue (million), by Application 2025 & 2033
- Figure 28: Europe Laboratory Cleaning Agents Volume (K), by Application 2025 & 2033
- Figure 29: Europe Laboratory Cleaning Agents Revenue Share (%), by Application 2025 & 2033
- Figure 30: Europe Laboratory Cleaning Agents Volume Share (%), by Application 2025 & 2033
- Figure 31: Europe Laboratory Cleaning Agents Revenue (million), by Type 2025 & 2033
- Figure 32: Europe Laboratory Cleaning Agents Volume (K), by Type 2025 & 2033
- Figure 33: Europe Laboratory Cleaning Agents Revenue Share (%), by Type 2025 & 2033
- Figure 34: Europe Laboratory Cleaning Agents Volume Share (%), by Type 2025 & 2033
- Figure 35: Europe Laboratory Cleaning Agents Revenue (million), by Country 2025 & 2033
- Figure 36: Europe Laboratory Cleaning Agents Volume (K), by Country 2025 & 2033
- Figure 37: Europe Laboratory Cleaning Agents Revenue Share (%), by Country 2025 & 2033
- Figure 38: Europe Laboratory Cleaning Agents Volume Share (%), by Country 2025 & 2033
- Figure 39: Middle East & Africa Laboratory Cleaning Agents Revenue (million), by Application 2025 & 2033
- Figure 40: Middle East & Africa Laboratory Cleaning Agents Volume (K), by Application 2025 & 2033
- Figure 41: Middle East & Africa Laboratory Cleaning Agents Revenue Share (%), by Application 2025 & 2033
- Figure 42: Middle East & Africa Laboratory Cleaning Agents Volume Share (%), by Application 2025 & 2033
- Figure 43: Middle East & Africa Laboratory Cleaning Agents Revenue (million), by Type 2025 & 2033
- Figure 44: Middle East & Africa Laboratory Cleaning Agents Volume (K), by Type 2025 & 2033
- Figure 45: Middle East & Africa Laboratory Cleaning Agents Revenue Share (%), by Type 2025 & 2033
- Figure 46: Middle East & Africa Laboratory Cleaning Agents Volume Share (%), by Type 2025 & 2033
- Figure 47: Middle East & Africa Laboratory Cleaning Agents Revenue (million), by Country 2025 & 2033
- Figure 48: Middle East & Africa Laboratory Cleaning Agents Volume (K), by Country 2025 & 2033
- Figure 49: Middle East & Africa Laboratory Cleaning Agents Revenue Share (%), by Country 2025 & 2033
- Figure 50: Middle East & Africa Laboratory Cleaning Agents Volume Share (%), by Country 2025 & 2033
- Figure 51: Asia Pacific Laboratory Cleaning Agents Revenue (million), by Application 2025 & 2033
- Figure 52: Asia Pacific Laboratory Cleaning Agents Volume (K), by Application 2025 & 2033
- Figure 53: Asia Pacific Laboratory Cleaning Agents Revenue Share (%), by Application 2025 & 2033
- Figure 54: Asia Pacific Laboratory Cleaning Agents Volume Share (%), by Application 2025 & 2033
- Figure 55: Asia Pacific Laboratory Cleaning Agents Revenue (million), by Type 2025 & 2033
- Figure 56: Asia Pacific Laboratory Cleaning Agents Volume (K), by Type 2025 & 2033
- Figure 57: Asia Pacific Laboratory Cleaning Agents Revenue Share (%), by Type 2025 & 2033
- Figure 58: Asia Pacific Laboratory Cleaning Agents Volume Share (%), by Type 2025 & 2033
- Figure 59: Asia Pacific Laboratory Cleaning Agents Revenue (million), by Country 2025 & 2033
- Figure 60: Asia Pacific Laboratory Cleaning Agents Volume (K), by Country 2025 & 2033
- Figure 61: Asia Pacific Laboratory Cleaning Agents Revenue Share (%), by Country 2025 & 2033
- Figure 62: Asia Pacific Laboratory Cleaning Agents Volume Share (%), by Country 2025 & 2033
List of Tables
- Table 1: Global Laboratory Cleaning Agents Revenue million Forecast, by Application 2020 & 2033
- Table 2: Global Laboratory Cleaning Agents Volume K Forecast, by Application 2020 & 2033
- Table 3: Global Laboratory Cleaning Agents Revenue million Forecast, by Type 2020 & 2033
- Table 4: Global Laboratory Cleaning Agents Volume K Forecast, by Type 2020 & 2033
- Table 5: Global Laboratory Cleaning Agents Revenue million Forecast, by Region 2020 & 2033
- Table 6: Global Laboratory Cleaning Agents Volume K Forecast, by Region 2020 & 2033
- Table 7: Global Laboratory Cleaning Agents Revenue million Forecast, by Application 2020 & 2033
- Table 8: Global Laboratory Cleaning Agents Volume K Forecast, by Application 2020 & 2033
- Table 9: Global Laboratory Cleaning Agents Revenue million Forecast, by Type 2020 & 2033
- Table 10: Global Laboratory Cleaning Agents Volume K Forecast, by Type 2020 & 2033
- Table 11: Global Laboratory Cleaning Agents Revenue million Forecast, by Country 2020 & 2033
- Table 12: Global Laboratory Cleaning Agents Volume K Forecast, by Country 2020 & 2033
- Table 13: United States Laboratory Cleaning Agents Revenue (million) Forecast, by Application 2020 & 2033
- Table 14: United States Laboratory Cleaning Agents Volume (K) Forecast, by Application 2020 & 2033
- Table 15: Canada Laboratory Cleaning Agents Revenue (million) Forecast, by Application 2020 & 2033
- Table 16: Canada Laboratory Cleaning Agents Volume (K) Forecast, by Application 2020 & 2033
- Table 17: Mexico Laboratory Cleaning Agents Revenue (million) Forecast, by Application 2020 & 2033
- Table 18: Mexico Laboratory Cleaning Agents Volume (K) Forecast, by Application 2020 & 2033
- Table 19: Global Laboratory Cleaning Agents Revenue million Forecast, by Application 2020 & 2033
- Table 20: Global Laboratory Cleaning Agents Volume K Forecast, by Application 2020 & 2033
- Table 21: Global Laboratory Cleaning Agents Revenue million Forecast, by Type 2020 & 2033
- Table 22: Global Laboratory Cleaning Agents Volume K Forecast, by Type 2020 & 2033
- Table 23: Global Laboratory Cleaning Agents Revenue million Forecast, by Country 2020 & 2033
- Table 24: Global Laboratory Cleaning Agents Volume K Forecast, by Country 2020 & 2033
- Table 25: Brazil Laboratory Cleaning Agents Revenue (million) Forecast, by Application 2020 & 2033
- Table 26: Brazil Laboratory Cleaning Agents Volume (K) Forecast, by Application 2020 & 2033
- Table 27: Argentina Laboratory Cleaning Agents Revenue (million) Forecast, by Application 2020 & 2033
- Table 28: Argentina Laboratory Cleaning Agents Volume (K) Forecast, by Application 2020 & 2033
- Table 29: Rest of South America Laboratory Cleaning Agents Revenue (million) Forecast, by Application 2020 & 2033
- Table 30: Rest of South America Laboratory Cleaning Agents Volume (K) Forecast, by Application 2020 & 2033
- Table 31: Global Laboratory Cleaning Agents Revenue million Forecast, by Application 2020 & 2033
- Table 32: Global Laboratory Cleaning Agents Volume K Forecast, by Application 2020 & 2033
- Table 33: Global Laboratory Cleaning Agents Revenue million Forecast, by Type 2020 & 2033
- Table 34: Global Laboratory Cleaning Agents Volume K Forecast, by Type 2020 & 2033
- Table 35: Global Laboratory Cleaning Agents Revenue million Forecast, by Country 2020 & 2033
- Table 36: Global Laboratory Cleaning Agents Volume K Forecast, by Country 2020 & 2033
- Table 37: United Kingdom Laboratory Cleaning Agents Revenue (million) Forecast, by Application 2020 & 2033
- Table 38: United Kingdom Laboratory Cleaning Agents Volume (K) Forecast, by Application 2020 & 2033
- Table 39: Germany Laboratory Cleaning Agents Revenue (million) Forecast, by Application 2020 & 2033
- Table 40: Germany Laboratory Cleaning Agents Volume (K) Forecast, by Application 2020 & 2033
- Table 41: France Laboratory Cleaning Agents Revenue (million) Forecast, by Application 2020 & 2033
- Table 42: France Laboratory Cleaning Agents Volume (K) Forecast, by Application 2020 & 2033
- Table 43: Italy Laboratory Cleaning Agents Revenue (million) Forecast, by Application 2020 & 2033
- Table 44: Italy Laboratory Cleaning Agents Volume (K) Forecast, by Application 2020 & 2033
- Table 45: Spain Laboratory Cleaning Agents Revenue (million) Forecast, by Application 2020 & 2033
- Table 46: Spain Laboratory Cleaning Agents Volume (K) Forecast, by Application 2020 & 2033
- Table 47: Russia Laboratory Cleaning Agents Revenue (million) Forecast, by Application 2020 & 2033
- Table 48: Russia Laboratory Cleaning Agents Volume (K) Forecast, by Application 2020 & 2033
- Table 49: Benelux Laboratory Cleaning Agents Revenue (million) Forecast, by Application 2020 & 2033
- Table 50: Benelux Laboratory Cleaning Agents Volume (K) Forecast, by Application 2020 & 2033
- Table 51: Nordics Laboratory Cleaning Agents Revenue (million) Forecast, by Application 2020 & 2033
- Table 52: Nordics Laboratory Cleaning Agents Volume (K) Forecast, by Application 2020 & 2033
- Table 53: Rest of Europe Laboratory Cleaning Agents Revenue (million) Forecast, by Application 2020 & 2033
- Table 54: Rest of Europe Laboratory Cleaning Agents Volume (K) Forecast, by Application 2020 & 2033
- Table 55: Global Laboratory Cleaning Agents Revenue million Forecast, by Application 2020 & 2033
- Table 56: Global Laboratory Cleaning Agents Volume K Forecast, by Application 2020 & 2033
- Table 57: Global Laboratory Cleaning Agents Revenue million Forecast, by Type 2020 & 2033
- Table 58: Global Laboratory Cleaning Agents Volume K Forecast, by Type 2020 & 2033
- Table 59: Global Laboratory Cleaning Agents Revenue million Forecast, by Country 2020 & 2033
- Table 60: Global Laboratory Cleaning Agents Volume K Forecast, by Country 2020 & 2033
- Table 61: Turkey Laboratory Cleaning Agents Revenue (million) Forecast, by Application 2020 & 2033
- Table 62: Turkey Laboratory Cleaning Agents Volume (K) Forecast, by Application 2020 & 2033
- Table 63: Israel Laboratory Cleaning Agents Revenue (million) Forecast, by Application 2020 & 2033
- Table 64: Israel Laboratory Cleaning Agents Volume (K) Forecast, by Application 2020 & 2033
- Table 65: GCC Laboratory Cleaning Agents Revenue (million) Forecast, by Application 2020 & 2033
- Table 66: GCC Laboratory Cleaning Agents Volume (K) Forecast, by Application 2020 & 2033
- Table 67: North Africa Laboratory Cleaning Agents Revenue (million) Forecast, by Application 2020 & 2033
- Table 68: North Africa Laboratory Cleaning Agents Volume (K) Forecast, by Application 2020 & 2033
- Table 69: South Africa Laboratory Cleaning Agents Revenue (million) Forecast, by Application 2020 & 2033
- Table 70: South Africa Laboratory Cleaning Agents Volume (K) Forecast, by Application 2020 & 2033
- Table 71: Rest of Middle East & Africa Laboratory Cleaning Agents Revenue (million) Forecast, by Application 2020 & 2033
- Table 72: Rest of Middle East & Africa Laboratory Cleaning Agents Volume (K) Forecast, by Application 2020 & 2033
- Table 73: Global Laboratory Cleaning Agents Revenue million Forecast, by Application 2020 & 2033
- Table 74: Global Laboratory Cleaning Agents Volume K Forecast, by Application 2020 & 2033
- Table 75: Global Laboratory Cleaning Agents Revenue million Forecast, by Type 2020 & 2033
- Table 76: Global Laboratory Cleaning Agents Volume K Forecast, by Type 2020 & 2033
- Table 77: Global Laboratory Cleaning Agents Revenue million Forecast, by Country 2020 & 2033
- Table 78: Global Laboratory Cleaning Agents Volume K Forecast, by Country 2020 & 2033
- Table 79: China Laboratory Cleaning Agents Revenue (million) Forecast, by Application 2020 & 2033
- Table 80: China Laboratory Cleaning Agents Volume (K) Forecast, by Application 2020 & 2033
- Table 81: India Laboratory Cleaning Agents Revenue (million) Forecast, by Application 2020 & 2033
- Table 82: India Laboratory Cleaning Agents Volume (K) Forecast, by Application 2020 & 2033
- Table 83: Japan Laboratory Cleaning Agents Revenue (million) Forecast, by Application 2020 & 2033
- Table 84: Japan Laboratory Cleaning Agents Volume (K) Forecast, by Application 2020 & 2033
- Table 85: South Korea Laboratory Cleaning Agents Revenue (million) Forecast, by Application 2020 & 2033
- Table 86: South Korea Laboratory Cleaning Agents Volume (K) Forecast, by Application 2020 & 2033
- Table 87: ASEAN Laboratory Cleaning Agents Revenue (million) Forecast, by Application 2020 & 2033
- Table 88: ASEAN Laboratory Cleaning Agents Volume (K) Forecast, by Application 2020 & 2033
- Table 89: Oceania Laboratory Cleaning Agents Revenue (million) Forecast, by Application 2020 & 2033
- Table 90: Oceania Laboratory Cleaning Agents Volume (K) Forecast, by Application 2020 & 2033
- Table 91: Rest of Asia Pacific Laboratory Cleaning Agents Revenue (million) Forecast, by Application 2020 & 2033
- Table 92: Rest of Asia Pacific Laboratory Cleaning Agents Volume (K) Forecast, by Application 2020 & 2033
Frequently Asked Questions
1. What is the projected Compound Annual Growth Rate (CAGR) of the Laboratory Cleaning Agents?
The projected CAGR is approximately 7%.
2. Which companies are prominent players in the Laboratory Cleaning Agents?
Key companies in the market include Merck, 3M, Genesys, Getinge, International Products Corporation(IPC), Decon Laboratories, Ambersil, Alconox Inc, COLE-PARMER, Fishersci, Thermo Scientific, Labconco, MP Biomedicals, MilliporeSigma, Cleaning Solution, Avantor, BrandTech, Branson Ultrasonics, Integra, Cambridge Diagnostic Products, Elma Schmidbauer GmbH, Mopec Eazy Soak, Zhongjing Keyi Technology.
3. What are the main segments of the Laboratory Cleaning Agents?
The market segments include Application, Type.
4. Can you provide details about the market size?
The market size is estimated to be USD 1064 million as of 2022.
5. What are some drivers contributing to market growth?
N/A
6. What are the notable trends driving market growth?
N/A
7. Are there any restraints impacting market growth?
N/A
8. Can you provide examples of recent developments in the market?
N/A
9. What pricing options are available for accessing the report?
Pricing options include single-user, multi-user, and enterprise licenses priced at USD 3950.00, USD 5925.00, and USD 7900.00 respectively.
10. Is the market size provided in terms of value or volume?
The market size is provided in terms of value, measured in million and volume, measured in K.
11. Are there any specific market keywords associated with the report?
Yes, the market keyword associated with the report is "Laboratory Cleaning Agents," which aids in identifying and referencing the specific market segment covered.
12. How do I determine which pricing option suits my needs best?
The pricing options vary based on user requirements and access needs. Individual users may opt for single-user licenses, while businesses requiring broader access may choose multi-user or enterprise licenses for cost-effective access to the report.
13. Are there any additional resources or data provided in the Laboratory Cleaning Agents report?
While the report offers comprehensive insights, it's advisable to review the specific contents or supplementary materials provided to ascertain if additional resources or data are available.
14. How can I stay updated on further developments or reports in the Laboratory Cleaning Agents?
To stay informed about further developments, trends, and reports in the Laboratory Cleaning Agents, consider subscribing to industry newsletters, following relevant companies and organizations, or regularly checking reputable industry news sources and publications.
Methodology
Step 1 - Identification of Relevant Samples Size from Population Database


Step 2 - Approaches for Defining Global Market Size (Value, Volume* & Price*)

Note*: In applicable scenarios
Step 3 - Data Sources
Primary Research
- Web Analytics
- Survey Reports
- Research Institute
- Latest Research Reports
- Opinion Leaders
Secondary Research
- Annual Reports
- White Paper
- Latest Press Release
- Industry Association
- Paid Database
- Investor Presentations

Step 4 - Data Triangulation
Involves using different sources of information in order to increase the validity of a study
These sources are likely to be stakeholders in a program - participants, other researchers, program staff, other community members, and so on.
Then we put all data in single framework & apply various statistical tools to find out the dynamic on the market.
During the analysis stage, feedback from the stakeholder groups would be compared to determine areas of agreement as well as areas of divergence