

Key Insights
The global lanolin market is forecast to reach $445.439 million by 2025, with a projected compound annual growth rate (CAGR) of 3.22% from 2025 to 2033. This growth is propelled by increasing consumer preference for natural and sustainable ingredients in the cosmetics and personal care industries. Lanolin's superior emollient, hydrating, and protective skin benefits make it a key ingredient in formulations such as lotions, creams, and ointments. The rising demand for natural skincare products and growing awareness of lanolin's benefits for sensitive skin are significant market drivers. Expanded use in pharmaceutical and textile applications further supports this positive trajectory. Key market participants, including Croda International PLC, The Lubrizol Corporation, and Merck KGaA, are actively innovating and broadening their product portfolios, leading to a competitive landscape focused on product differentiation and value-added services.
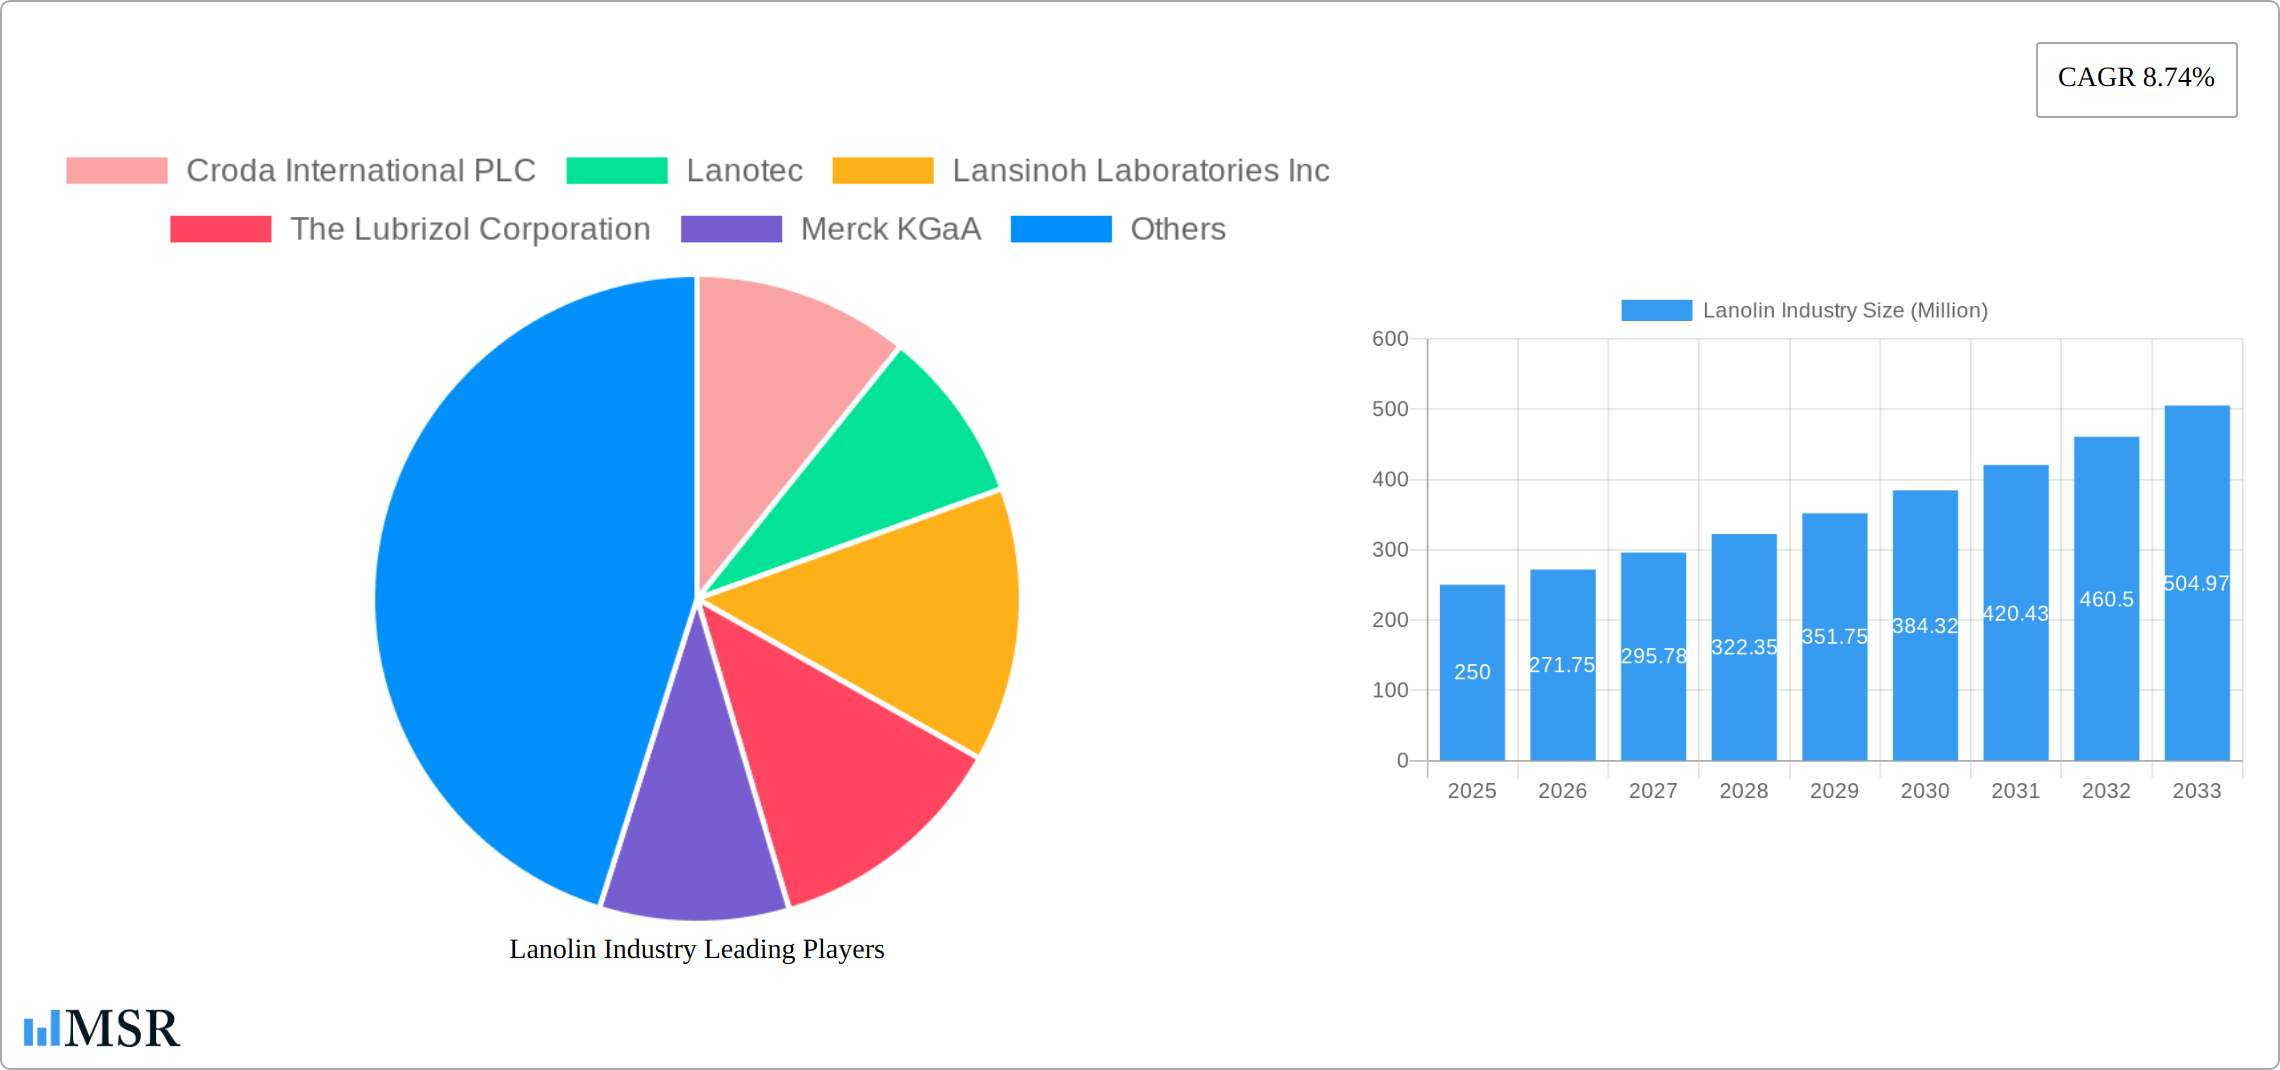
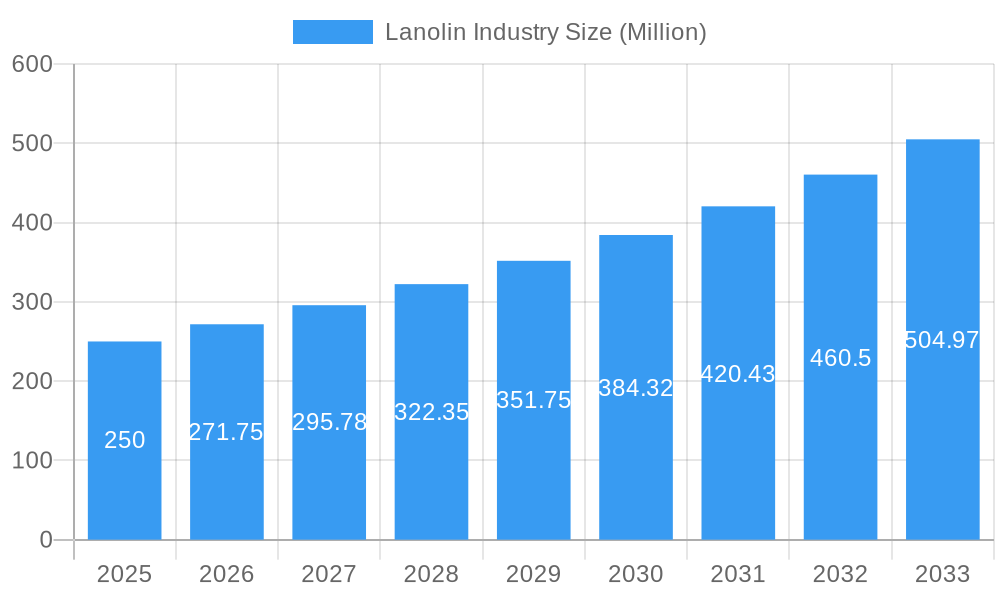
Lanolin Industry Market Size (In Million)
Despite positive growth, the lanolin market encounters challenges including raw material price volatility and supply chain fluctuations for high-quality lanolin, impacting production costs and profitability. Evolving regulatory landscapes for cosmetic and pharmaceutical ingredients may also influence market dynamics. Furthermore, the burgeoning segment of synthetic alternatives poses a competitive threat. Nevertheless, the overall outlook for the lanolin market remains robust, primarily driven by escalating demand from the personal care and cosmetics sectors. The market is segmented across cosmetic, pharmaceutical, and textile applications, with cosmetics currently dominating. Geographic expansion and increasing consumer expenditure in emerging economies are expected to further fuel market growth throughout the forecast period.
Lanolin Industry Company Market Share
Lanolin Industry Market Report: 2019-2033
This comprehensive report provides an in-depth analysis of the global lanolin industry, offering invaluable insights for stakeholders, investors, and industry professionals. Covering the period 2019-2033, with a base year of 2025 and a forecast period of 2025-2033, this report illuminates market dynamics, growth drivers, challenges, and emerging opportunities within the $XX Million lanolin market.
Lanolin Industry Market Concentration & Dynamics
The global lanolin market exhibits a moderately concentrated landscape, with several key players commanding significant market share. Key players such as Croda International PLC, Lanotec, Lansinoh Laboratories Inc, The Lubrizol Corporation, and Merck KGaA, among others, contribute significantly to the overall market volume. Precise market share data for each company requires confidential information but is projected to be a spread amongst these major players in the range of 25% each.
The industry’s innovation ecosystem is moderately active, with ongoing research and development focused on enhancing lanolin's properties for diverse applications. Regulatory frameworks vary across regions, influencing product development and market access. The existence of substitute products, such as synthetic emollients, presents competitive pressure. End-user trends, particularly the rising demand for natural and sustainable products, drive market growth. Mergers and acquisitions (M&A) activity in the lanolin industry has been moderate in recent years, with approximately XX M&A deals recorded between 2019 and 2024.
Lanolin Industry Industry Insights & Trends
The global lanolin market is poised for robust expansion, projected to achieve a Compound Annual Growth Rate (CAGR) of **[XX]%** during the forecast period of 2025-2033. With an estimated market size of **$XX Million** in 2025, the industry is anticipated to reach **$XX Million** by 2033. This significant growth trajectory is primarily propelled by the escalating demand from the cosmetics and personal care sector, driven by a prevailing consumer preference for natural and ethically sourced ingredients. Concurrently, ongoing technological innovations in lanolin extraction, processing, and purification are further bolstering market expansion. Evolving consumer consciousness, marked by an increased emphasis on sustainability and transparent sourcing practices, presents both strategic challenges and lucrative opportunities for key industry stakeholders.
Key Markets & Segments Leading Lanolin Industry
The **[Dominant Region - e.g., Europe/North America/Asia-Pacific]** region currently holds a commanding position in the global lanolin market, representing approximately **XX%** of the total market share in 2025. Within this leading region, **[Dominant Country - e.g., Germany/United States/China]** stands out as a particularly influential market.
Factors Driving Regional Dominance:
- Sustained economic prosperity and strong consumer purchasing power.
- Well-developed manufacturing and distribution infrastructure.
- High per capita consumption rates of diverse lanolin-derived products.
- Supportive and favorable regulatory frameworks for industry operations.
The cosmetics and personal care segment continues to be the largest consumer of lanolin, with pharmaceuticals and various industrial applications following suit. The preeminence of this region and segment is attributed to well-established and efficient supply chains, a strong consumer pull for natural ingredients, and a continuous focus on research and development initiatives within these key sectors.
Lanolin Industry Product Developments
Recent years have been characterized by significant advancements and innovations in lanolin product development. Enhanced processing methodologies have yielded lanolin products of exceptional purity and refined properties, making them highly suitable for an expanded array of applications. These breakthroughs have broadened the utilization of lanolin beyond its traditional role in cosmetics, extending its reach into pharmaceuticals, textiles, and specialized industrial lubricants. Furthermore, the development and adoption of sustainable and environmentally friendly lanolin processing techniques are gaining considerable traction, aligning with the growing global demand for eco-conscious products and manufacturing practices.
Challenges in the Lanolin Industry Market
The lanolin industry faces several challenges, including stringent regulatory requirements for cosmetic and pharmaceutical applications which impact product development and approval processes. Supply chain disruptions, particularly concerning raw material sourcing, can affect production efficiency and profitability. Competition from synthetic alternatives poses a significant threat, requiring continuous innovation and differentiation to maintain market share. Fluctuations in raw material prices further contribute to cost pressures within the industry and its profitability. The total impact of these challenges is estimated to decrease the overall profitability by xx%
Forces Driving Lanolin Industry Growth
The lanolin industry’s growth is primarily driven by increasing consumer preference for natural and sustainable products, particularly in cosmetics and personal care. Technological advancements in lanolin processing enhance its functionality and expand its application range. Favorable regulatory environments in certain regions promote industry growth. Finally, the rising demand for lanolin in emerging markets offers substantial growth potential.
Long-Term Growth Catalysts in the Lanolin Industry
Long-term growth in the lanolin industry will be driven by strategic partnerships and collaborations across the value chain, fostering innovation and market expansion. Investments in research and development are pivotal to developing novel lanolin-based products with superior properties and expanded applications. Exploration of new market segments, such as industrial and biomedical applications, presents significant growth opportunities.
Emerging Opportunities in Lanolin Industry
Promising emerging opportunities lie in the creation of innovative lanolin-based formulations meticulously designed for niche applications, including high-performance industrial lubricants and cutting-edge advanced skincare solutions. The intensifying global emphasis on sustainability and the widespread adoption of green manufacturing processes present a significant avenue for companies to differentiate their product offerings and attract a growing segment of environmentally aware consumers. Moreover, strategic expansion into new and untapped geographical markets, particularly within burgeoning economies, offers substantial potential for future growth and market penetration.
Leading Players in the Lanolin Industry Sector
- Croda International PLC
- Lanotec
- Lansinoh Laboratories Inc
- The Lubrizol Corporation
- Merck KGaA
- Nippon Fine Chemical
- NK Chemicals
- Rolex Lanolin Products Limited
- Suru Chemicals
- Wellman Advanced Materials
- Yixin Chemical Co Ltd
- Zhejiang Garden Biochemical High-Tech Co Ltd
*List is not exhaustive and subject to market dynamics.
Key Milestones in Lanolin Industry Industry
- April 2023: Lanotec launched a new product line of environmentally friendly lanolin-based lubricants: MPX (multi-purpose), MGX (marine), and EGX (electrical). This launch significantly expanded Lanotec's market reach and product portfolio, highlighting the increasing demand for sustainable alternatives in various industrial sectors.
Strategic Outlook for Lanolin Industry Market
The lanolin industry is poised for continued growth, driven by innovation, sustainability, and expansion into new applications. Strategic partnerships, investments in R&D, and a focus on eco-friendly production methods will be key to capturing future market share. The industry's long-term prospects remain positive, owing to the versatility of lanolin and the increasing demand for natural and sustainable ingredients across various sectors.
Lanolin Industry Segmentation
-
1. Application
- 1.1. Cosmetics and Personal Care
- 1.2. Pharmaceuticals
- 1.3. Anti-corrosive Applications
- 1.4. Lubricants
- 1.5. Other Applications (Paints, Paper)
Lanolin Industry Segmentation By Geography
-
1. Asia Pacific
- 1.1. China
- 1.2. India
- 1.3. Japan
- 1.4. South Korea
- 1.5. Rest of Asia Pacific
-
2. North America
- 2.1. United States
- 2.2. Canada
- 2.3. Mexico
-
3. Europe
- 3.1. Germany
- 3.2. United Kingdom
- 3.3. France
- 3.4. Italy
- 3.5. Rest of Europe
-
4. South America
- 4.1. Brazil
- 4.2. Argentina
- 4.3. Rest of South America
-
5. Middle East and Africa
- 5.1. Saudi Arabia
- 5.2. South Africa
- 5.3. Rest of Middle East and Africa

Lanolin Industry Regional Market Share
Geographic Coverage of Lanolin Industry
Lanolin Industry REPORT HIGHLIGHTS
| Aspects | Details |
|---|---|
| Study Period | 2020-2034 |
| Base Year | 2025 |
| Estimated Year | 2026 |
| Forecast Period | 2026-2034 |
| Historical Period | 2020-2025 |
| Growth Rate | CAGR of 3.22% from 2020-2034 |
| Segmentation |
|
Table of Contents
- 1. Introduction
- 1.1. Research Scope
- 1.2. Market Segmentation
- 1.3. Research Objective
- 1.4. Definitions and Assumptions
- 2. Executive Summary
- 2.1. Market Snapshot
- 3. Market Dynamics
- 3.1. Market Drivers
- 3.2. Market Restrains
- 3.3. Market Trends
- 3.4. Market Opportunities
- 4. Market Factor Analysis
- 4.1. Porters Five Forces
- 4.1.1. Bargaining Power of Suppliers
- 4.1.2. Bargaining Power of Buyers
- 4.1.3. Threat of New Entrants
- 4.1.4. Threat of Substitutes
- 4.1.5. Competitive Rivalry
- 4.2. PESTEL analysis
- 4.3. BCG Analysis
- 4.3.1. Stars (High Growth, High Market Share)
- 4.3.2. Cash Cows (Low Growth, High Market Share)
- 4.3.3. Question Mark (High Growth, Low Market Share)
- 4.3.4. Dogs (Low Growth, Low Market Share)
- 4.4. Ansoff Matrix Analysis
- 4.5. Supply Chain Analysis
- 4.6. Regulatory Landscape
- 4.7. Current Market Potential and Opportunity Assessment (TAM–SAM–SOM Framework)
- 4.8. MSR Analyst Note
- 4.1. Porters Five Forces
- 5. Market Analysis, Insights and Forecast 2021-2033
- 5.1. Market Analysis, Insights and Forecast - by Application
- 5.1.1. Cosmetics and Personal Care
- 5.1.2. Pharmaceuticals
- 5.1.3. Anti-corrosive Applications
- 5.1.4. Lubricants
- 5.1.5. Other Applications (Paints, Paper)
- 5.2. Market Analysis, Insights and Forecast - by Region
- 5.2.1. Asia Pacific
- 5.2.2. North America
- 5.2.3. Europe
- 5.2.4. South America
- 5.2.5. Middle East and Africa
- 5.1. Market Analysis, Insights and Forecast - by Application
- 6. Global Lanolin Industry Analysis, Insights and Forecast, 2021-2033
- 6.1. Market Analysis, Insights and Forecast - by Application
- 6.1.1. Cosmetics and Personal Care
- 6.1.2. Pharmaceuticals
- 6.1.3. Anti-corrosive Applications
- 6.1.4. Lubricants
- 6.1.5. Other Applications (Paints, Paper)
- 6.1. Market Analysis, Insights and Forecast - by Application
- 7. Asia Pacific Lanolin Industry Analysis, Insights and Forecast, 2020-2032
- 7.1. Market Analysis, Insights and Forecast - by Application
- 7.1.1. Cosmetics and Personal Care
- 7.1.2. Pharmaceuticals
- 7.1.3. Anti-corrosive Applications
- 7.1.4. Lubricants
- 7.1.5. Other Applications (Paints, Paper)
- 7.1. Market Analysis, Insights and Forecast - by Application
- 8. North America Lanolin Industry Analysis, Insights and Forecast, 2020-2032
- 8.1. Market Analysis, Insights and Forecast - by Application
- 8.1.1. Cosmetics and Personal Care
- 8.1.2. Pharmaceuticals
- 8.1.3. Anti-corrosive Applications
- 8.1.4. Lubricants
- 8.1.5. Other Applications (Paints, Paper)
- 8.1. Market Analysis, Insights and Forecast - by Application
- 9. Europe Lanolin Industry Analysis, Insights and Forecast, 2020-2032
- 9.1. Market Analysis, Insights and Forecast - by Application
- 9.1.1. Cosmetics and Personal Care
- 9.1.2. Pharmaceuticals
- 9.1.3. Anti-corrosive Applications
- 9.1.4. Lubricants
- 9.1.5. Other Applications (Paints, Paper)
- 9.1. Market Analysis, Insights and Forecast - by Application
- 10. South America Lanolin Industry Analysis, Insights and Forecast, 2020-2032
- 10.1. Market Analysis, Insights and Forecast - by Application
- 10.1.1. Cosmetics and Personal Care
- 10.1.2. Pharmaceuticals
- 10.1.3. Anti-corrosive Applications
- 10.1.4. Lubricants
- 10.1.5. Other Applications (Paints, Paper)
- 10.1. Market Analysis, Insights and Forecast - by Application
- 11. Middle East and Africa Lanolin Industry Analysis, Insights and Forecast, 2020-2032
- 11.1. Market Analysis, Insights and Forecast - by Application
- 11.1.1. Cosmetics and Personal Care
- 11.1.2. Pharmaceuticals
- 11.1.3. Anti-corrosive Applications
- 11.1.4. Lubricants
- 11.1.5. Other Applications (Paints, Paper)
- 11.1. Market Analysis, Insights and Forecast - by Application
- 12. Competitive Analysis
- 12.1. Company Profiles
- 12.1.1 Croda International PLC
- 12.1.1.1. Company Overview
- 12.1.1.2. Products
- 12.1.1.3. Company Financials
- 12.1.1.4. SWOT Analysis
- 12.1.2 Lanotec
- 12.1.2.1. Company Overview
- 12.1.2.2. Products
- 12.1.2.3. Company Financials
- 12.1.2.4. SWOT Analysis
- 12.1.3 Lansinoh Laboratories Inc
- 12.1.3.1. Company Overview
- 12.1.3.2. Products
- 12.1.3.3. Company Financials
- 12.1.3.4. SWOT Analysis
- 12.1.4 The Lubrizol Corporation
- 12.1.4.1. Company Overview
- 12.1.4.2. Products
- 12.1.4.3. Company Financials
- 12.1.4.4. SWOT Analysis
- 12.1.5 Merck KGaA
- 12.1.5.1. Company Overview
- 12.1.5.2. Products
- 12.1.5.3. Company Financials
- 12.1.5.4. SWOT Analysis
- 12.1.6 Nippon Fine Chemical
- 12.1.6.1. Company Overview
- 12.1.6.2. Products
- 12.1.6.3. Company Financials
- 12.1.6.4. SWOT Analysis
- 12.1.7 NK Chemicals
- 12.1.7.1. Company Overview
- 12.1.7.2. Products
- 12.1.7.3. Company Financials
- 12.1.7.4. SWOT Analysis
- 12.1.8 Rolex Lanolin Products Limited
- 12.1.8.1. Company Overview
- 12.1.8.2. Products
- 12.1.8.3. Company Financials
- 12.1.8.4. SWOT Analysis
- 12.1.9 Suru Chemicals
- 12.1.9.1. Company Overview
- 12.1.9.2. Products
- 12.1.9.3. Company Financials
- 12.1.9.4. SWOT Analysis
- 12.1.10 Wellman Advanced Materials
- 12.1.10.1. Company Overview
- 12.1.10.2. Products
- 12.1.10.3. Company Financials
- 12.1.10.4. SWOT Analysis
- 12.1.11 Yixin Chemical Co Ltd
- 12.1.11.1. Company Overview
- 12.1.11.2. Products
- 12.1.11.3. Company Financials
- 12.1.11.4. SWOT Analysis
- 12.1.12 Zhejiang Garden Biochemical High-Tech Co Ltd*List Not Exhaustive
- 12.1.12.1. Company Overview
- 12.1.12.2. Products
- 12.1.12.3. Company Financials
- 12.1.12.4. SWOT Analysis
- 12.1.1 Croda International PLC
- 12.2. Market Entropy
- 12.2.1 Company's Key Areas Served
- 12.2.2 Recent Developments
- 12.3. Company Market Share Analysis 2025
- 12.3.1 Top 5 Companies Market Share Analysis
- 12.3.2 Top 3 Companies Market Share Analysis
- 12.4. List of Potential Customers
- 13. Research Methodology
List of Figures
- Figure 1: Global Lanolin Industry Revenue Breakdown (million, %) by Region 2025 & 2033
- Figure 2: Asia Pacific Lanolin Industry Revenue (million), by Application 2025 & 2033
- Figure 3: Asia Pacific Lanolin Industry Revenue Share (%), by Application 2025 & 2033
- Figure 4: Asia Pacific Lanolin Industry Revenue (million), by Country 2025 & 2033
- Figure 5: Asia Pacific Lanolin Industry Revenue Share (%), by Country 2025 & 2033
- Figure 6: North America Lanolin Industry Revenue (million), by Application 2025 & 2033
- Figure 7: North America Lanolin Industry Revenue Share (%), by Application 2025 & 2033
- Figure 8: North America Lanolin Industry Revenue (million), by Country 2025 & 2033
- Figure 9: North America Lanolin Industry Revenue Share (%), by Country 2025 & 2033
- Figure 10: Europe Lanolin Industry Revenue (million), by Application 2025 & 2033
- Figure 11: Europe Lanolin Industry Revenue Share (%), by Application 2025 & 2033
- Figure 12: Europe Lanolin Industry Revenue (million), by Country 2025 & 2033
- Figure 13: Europe Lanolin Industry Revenue Share (%), by Country 2025 & 2033
- Figure 14: South America Lanolin Industry Revenue (million), by Application 2025 & 2033
- Figure 15: South America Lanolin Industry Revenue Share (%), by Application 2025 & 2033
- Figure 16: South America Lanolin Industry Revenue (million), by Country 2025 & 2033
- Figure 17: South America Lanolin Industry Revenue Share (%), by Country 2025 & 2033
- Figure 18: Middle East and Africa Lanolin Industry Revenue (million), by Application 2025 & 2033
- Figure 19: Middle East and Africa Lanolin Industry Revenue Share (%), by Application 2025 & 2033
- Figure 20: Middle East and Africa Lanolin Industry Revenue (million), by Country 2025 & 2033
- Figure 21: Middle East and Africa Lanolin Industry Revenue Share (%), by Country 2025 & 2033
List of Tables
- Table 1: Global Lanolin Industry Revenue million Forecast, by Application 2020 & 2033
- Table 2: Global Lanolin Industry Revenue million Forecast, by Region 2020 & 2033
- Table 3: Global Lanolin Industry Revenue million Forecast, by Application 2020 & 2033
- Table 4: Global Lanolin Industry Revenue million Forecast, by Country 2020 & 2033
- Table 5: China Lanolin Industry Revenue (million) Forecast, by Application 2020 & 2033
- Table 6: India Lanolin Industry Revenue (million) Forecast, by Application 2020 & 2033
- Table 7: Japan Lanolin Industry Revenue (million) Forecast, by Application 2020 & 2033
- Table 8: South Korea Lanolin Industry Revenue (million) Forecast, by Application 2020 & 2033
- Table 9: Rest of Asia Pacific Lanolin Industry Revenue (million) Forecast, by Application 2020 & 2033
- Table 10: Global Lanolin Industry Revenue million Forecast, by Application 2020 & 2033
- Table 11: Global Lanolin Industry Revenue million Forecast, by Country 2020 & 2033
- Table 12: United States Lanolin Industry Revenue (million) Forecast, by Application 2020 & 2033
- Table 13: Canada Lanolin Industry Revenue (million) Forecast, by Application 2020 & 2033
- Table 14: Mexico Lanolin Industry Revenue (million) Forecast, by Application 2020 & 2033
- Table 15: Global Lanolin Industry Revenue million Forecast, by Application 2020 & 2033
- Table 16: Global Lanolin Industry Revenue million Forecast, by Country 2020 & 2033
- Table 17: Germany Lanolin Industry Revenue (million) Forecast, by Application 2020 & 2033
- Table 18: United Kingdom Lanolin Industry Revenue (million) Forecast, by Application 2020 & 2033
- Table 19: France Lanolin Industry Revenue (million) Forecast, by Application 2020 & 2033
- Table 20: Italy Lanolin Industry Revenue (million) Forecast, by Application 2020 & 2033
- Table 21: Rest of Europe Lanolin Industry Revenue (million) Forecast, by Application 2020 & 2033
- Table 22: Global Lanolin Industry Revenue million Forecast, by Application 2020 & 2033
- Table 23: Global Lanolin Industry Revenue million Forecast, by Country 2020 & 2033
- Table 24: Brazil Lanolin Industry Revenue (million) Forecast, by Application 2020 & 2033
- Table 25: Argentina Lanolin Industry Revenue (million) Forecast, by Application 2020 & 2033
- Table 26: Rest of South America Lanolin Industry Revenue (million) Forecast, by Application 2020 & 2033
- Table 27: Global Lanolin Industry Revenue million Forecast, by Application 2020 & 2033
- Table 28: Global Lanolin Industry Revenue million Forecast, by Country 2020 & 2033
- Table 29: Saudi Arabia Lanolin Industry Revenue (million) Forecast, by Application 2020 & 2033
- Table 30: South Africa Lanolin Industry Revenue (million) Forecast, by Application 2020 & 2033
- Table 31: Rest of Middle East and Africa Lanolin Industry Revenue (million) Forecast, by Application 2020 & 2033
Frequently Asked Questions
1. What is the projected Compound Annual Growth Rate (CAGR) of the Lanolin Industry?
The projected CAGR is approximately 3.22%.
2. Which companies are prominent players in the Lanolin Industry?
Key companies in the market include Croda International PLC, Lanotec, Lansinoh Laboratories Inc, The Lubrizol Corporation, Merck KGaA, Nippon Fine Chemical, NK Chemicals, Rolex Lanolin Products Limited, Suru Chemicals, Wellman Advanced Materials, Yixin Chemical Co Ltd, Zhejiang Garden Biochemical High-Tech Co Ltd*List Not Exhaustive.
3. What are the main segments of the Lanolin Industry?
The market segments include Application.
4. Can you provide details about the market size?
The market size is estimated to be USD 445.439 million as of 2022.
5. What are some drivers contributing to market growth?
Increasing Applications in Skin Care Products; Growing Demand for Pharmaceuticals; Other Drivers.
6. What are the notable trends driving market growth?
Growing Demand from the Cosmetics and Personal Care Industry.
7. Are there any restraints impacting market growth?
Increasing Applications in Skin Care Products; Growing Demand for Pharmaceuticals; Other Drivers.
8. Can you provide examples of recent developments in the market?
April 2023: Lanotec launched a new product line of lanolin-based lubricants, including MPX for everyday multi-purpose use, MGX for marine applications, and EGX for electrical use. All these are environmentally friendly for a variety of commercial and residential applications.
9. What pricing options are available for accessing the report?
Pricing options include single-user, multi-user, and enterprise licenses priced at USD 4750, USD 5250, and USD 8750 respectively.
10. Is the market size provided in terms of value or volume?
The market size is provided in terms of value, measured in million.
11. Are there any specific market keywords associated with the report?
Yes, the market keyword associated with the report is "Lanolin Industry," which aids in identifying and referencing the specific market segment covered.
12. How do I determine which pricing option suits my needs best?
The pricing options vary based on user requirements and access needs. Individual users may opt for single-user licenses, while businesses requiring broader access may choose multi-user or enterprise licenses for cost-effective access to the report.
13. Are there any additional resources or data provided in the Lanolin Industry report?
While the report offers comprehensive insights, it's advisable to review the specific contents or supplementary materials provided to ascertain if additional resources or data are available.
14. How can I stay updated on further developments or reports in the Lanolin Industry?
To stay informed about further developments, trends, and reports in the Lanolin Industry, consider subscribing to industry newsletters, following relevant companies and organizations, or regularly checking reputable industry news sources and publications.
Methodology
Step 1 - Identification of Relevant Samples Size from Population Database


Step 2 - Approaches for Defining Global Market Size (Value, Volume* & Price*)

Note*: In applicable scenarios
Step 3 - Data Sources
Primary Research
- Web Analytics
- Survey Reports
- Research Institute
- Latest Research Reports
- Opinion Leaders
Secondary Research
- Annual Reports
- White Paper
- Latest Press Release
- Industry Association
- Paid Database
- Investor Presentations

Step 4 - Data Triangulation
Involves using different sources of information in order to increase the validity of a study
These sources are likely to be stakeholders in a program - participants, other researchers, program staff, other community members, and so on.
Then we put all data in single framework & apply various statistical tools to find out the dynamic on the market.
During the analysis stage, feedback from the stakeholder groups would be compared to determine areas of agreement as well as areas of divergence