

Key Insights
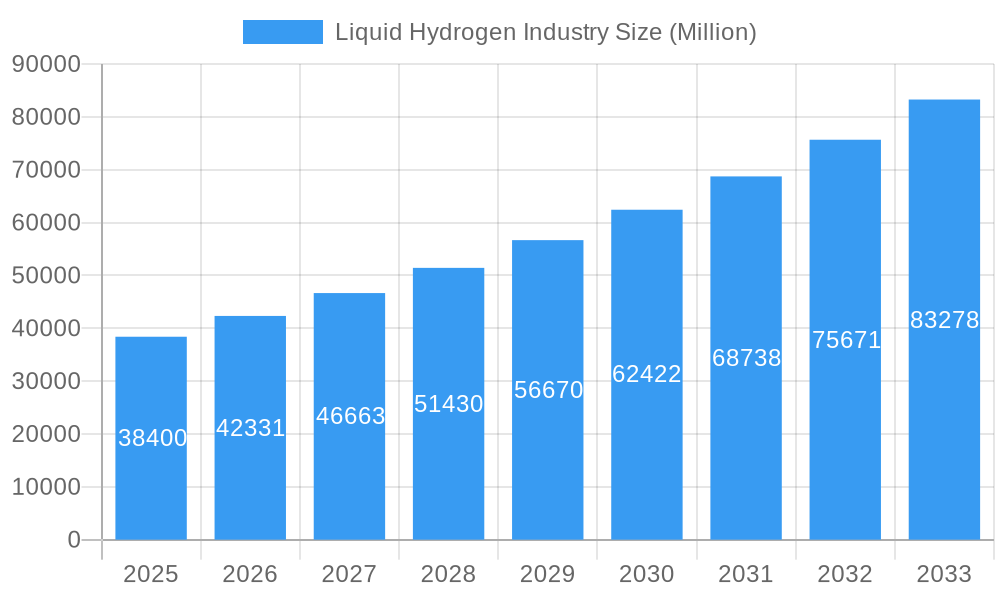
The global liquid hydrogen market, valued at $38.4 billion in 2025, is poised for significant growth, exhibiting a Compound Annual Growth Rate (CAGR) of 10.27% from 2025 to 2033. This expansion is driven by the increasing demand for clean energy solutions, particularly in transportation and industrial applications. The burgeoning automotive sector, aiming to reduce carbon emissions, is a major catalyst, with fuel cell electric vehicles (FCEVs) relying heavily on liquid hydrogen. Furthermore, the aerospace industry, including space exploration, is adopting liquid hydrogen as a potent and efficient propellant. The marine sector is also showing growing interest, exploring the potential of hydrogen-powered vessels to minimize environmental impact. Growth is further fueled by supportive government policies and investments in hydrogen infrastructure, including production, storage, and distribution networks. Key players like Linde PLC, Air Products and Chemicals Inc., and Air Liquide are strategically investing in expanding their production capacities and distribution networks to capitalize on this market opportunity. While challenges remain regarding hydrogen production costs and the need for enhanced storage and transportation infrastructure, the long-term outlook for liquid hydrogen remains remarkably positive.
Liquid Hydrogen Industry Market Size (In Billion)
The market segmentation reveals strong growth across various distribution methods, including cryogenic tanks and high-pressure tube trailers, reflecting the ongoing efforts to optimize hydrogen transport and handling. Geographical distribution reveals North America, Europe, and Asia-Pacific as key markets, fueled by robust technological advancements, substantial investments, and established industrial bases. However, the emerging markets in South America and the Middle East and Africa are expected to show substantial growth in the coming years due to increasing awareness of clean energy solutions and government initiatives to promote hydrogen adoption. While the "Other End-User Industries" segment requires further investigation, its inclusion suggests broader applications are emerging, contributing to the overall market dynamism. The competitive landscape indicates a mix of established industrial gas giants and emerging technology companies, driving innovation and fostering competition. This robust competitive environment is driving efficiency gains and price reductions, accelerating market adoption.
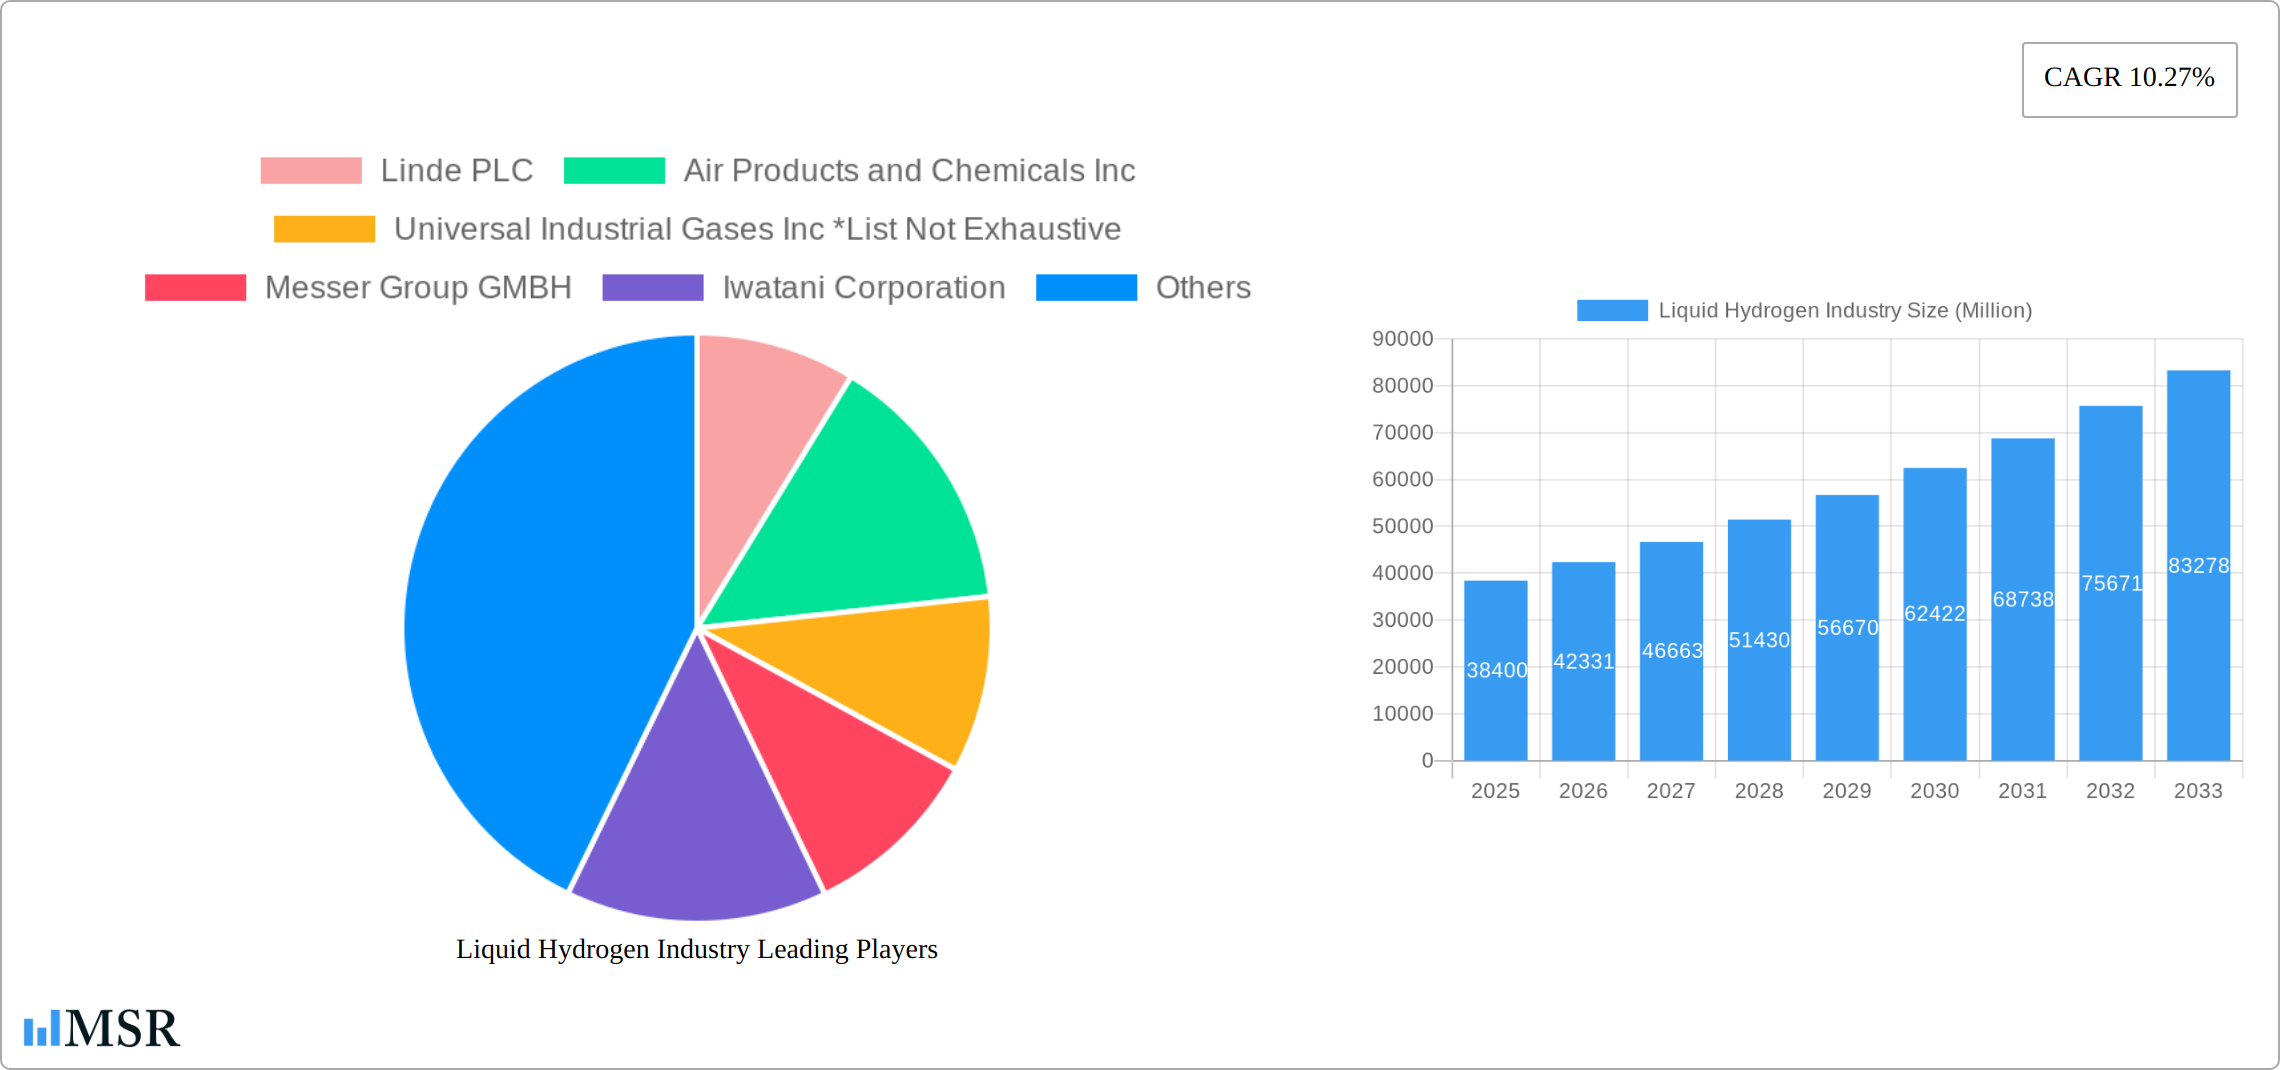
Liquid Hydrogen Industry Company Market Share
Liquid Hydrogen Industry: A Comprehensive Market Report (2019-2033)
This in-depth report provides a comprehensive analysis of the Liquid Hydrogen Industry, offering invaluable insights for stakeholders across the value chain. With a study period spanning 2019-2033, a base year of 2025, and a forecast period of 2025-2033, this report leverages historical data (2019-2024) to project future market trends and growth opportunities. The report meticulously examines market concentration, technological advancements, key players, and emerging trends, empowering businesses to make informed strategic decisions. The global liquid hydrogen market is projected to reach xx Million by 2033, exhibiting a CAGR of xx% during the forecast period.
Liquid Hydrogen Industry Market Concentration & Dynamics
The Liquid Hydrogen Industry exhibits a moderately concentrated market landscape, where a few dominant players hold substantial market share. Key global contenders, including Linde PLC, Air Products and Chemicals Inc., Air Liquide, and Messer Group GMBH, are projected to collectively control an estimated XX% of the market by 2025. Simultaneously, the market is experiencing a discernible rise in participation from agile, specialized companies, particularly within burgeoning segments like green hydrogen production and pioneering storage technologies.
Market Dynamics:
- Innovation Ecosystems: Substantial investments in research and development (R&D) are catalyzing breakthroughs in enhanced liquefaction technologies, optimized storage and transportation methodologies (including advanced Cryogenic Tanks and High-Pressure Tube Trailers), and the pioneering of sustainable green hydrogen production pathways.
- Regulatory Frameworks: Governmental policies and incentives designed to champion clean energy adoption and mitigate carbon emissions are fostering an increasingly conducive environment for liquid hydrogen utilization. However, the heterogeneity of regulatory landscapes across different jurisdictions can present obstacles to seamless market expansion.
- Substitute Products: While liquid hydrogen contends with alternative clean energy sources such as battery storage and natural gas, its inherent advantages in specific high-demand applications (e.g., heavy-duty transportation, aerospace, and maritime propulsion) firmly anchor its long-term market relevance and competitive edge.
- End-User Trends: The expanding demand from critical sectors like automotive, aerospace (encompassing space exploration), and marine fuels is a significant impetus for market growth. Furthermore, the emergence of novel applications within industrial processes and the power generation sector portends robust future expansion.
- M&A Activities: The liquid hydrogen industry has witnessed a steady stream of mergers and acquisitions (M&As) in recent years, with approximately XX M&A deals recorded between 2019 and 2024. These strategic transactions underscore ongoing consolidation efforts and the concerted drive towards vertical integration across the entire value chain.
Liquid Hydrogen Industry Insights & Trends
The global liquid hydrogen market is experiencing robust growth, driven by increasing demand for clean energy solutions and supportive government policies. The market size reached xx Million in 2024 and is projected to reach xx Million by 2033. Several factors contribute to this growth:
- Rising Environmental Concerns: Growing awareness of climate change and the need to reduce greenhouse gas emissions are driving the adoption of cleaner energy sources, including liquid hydrogen.
- Technological Advancements: Continuous improvements in hydrogen liquefaction, storage, and transportation technologies are reducing costs and improving efficiency, making liquid hydrogen a more viable option.
- Government Support: Various governments are implementing policies and incentives to promote the development and deployment of hydrogen technologies, including liquid hydrogen, through subsidies, tax breaks, and research funding.
- Expanding Applications: Liquid hydrogen is finding broader applications in various sectors, including transportation, industrial processes, and power generation, fueling market growth.
Key Markets & Segments Leading Liquid Hydrogen Industry
The automotive and aerospace sectors are the dominant end-user industries for liquid hydrogen, with the automotive sector being projected to be the fastest-growing segment over the forecast period. The aerospace sector, including space exploration, is poised to become a significant growth driver in the coming years due to its need for high-energy-density fuels.
Key Market Drivers:
- Automotive: Stringent emission regulations, increasing demand for zero-emission vehicles, and technological advancements in fuel cell vehicles are boosting demand.
- Aerospace: The need for sustainable and high-performance fuels in aviation and space exploration is driving investment in liquid hydrogen infrastructure.
- Marine: Growing interest in decarbonizing shipping fuels is propelling the adoption of liquid hydrogen in the maritime industry.
- Other End-User Industries: Industrial applications, such as ammonia production, refinery processes, and power generation, are showing promising growth potential.
Distribution Segment Dominance: Cryogenic tanks currently dominate the distribution segment due to their established technology and suitability for various applications. However, high-pressure tube trailers are emerging as a competitive alternative, particularly for long-distance transportation, offering enhanced efficiency and cost-effectiveness.
Liquid Hydrogen Industry Product Developments
Recent advancements in liquid hydrogen production, storage, and transportation technologies are shaping the market landscape. Innovations in cryogenic tank design, high-pressure tube trailers, and improved liquefaction processes are leading to increased efficiency, reduced costs, and enhanced safety. These technological advancements are creating new competitive advantages for companies and unlocking new market opportunities. The development of efficient and cost-effective green hydrogen production methods using renewable energy sources is a major focus of current research and development efforts.
Challenges in the Liquid Hydrogen Industry Market
The liquid hydrogen industry is confronted with several significant hurdles that impede its widespread adoption and scalability. These include the substantial upfront costs associated with production facilities and the development of necessary infrastructure. Furthermore, the nascent stage of a comprehensive refueling network for transportation applications, inherent safety considerations in hydrogen handling and storage, and the imperative for efficient and large-scale green hydrogen production represent key challenges. Addressing these factors effectively will be crucial for sustained market growth and will necessitate strategic investments, robust policy support, and technological advancements.
Forces Driving Liquid Hydrogen Industry Growth
A confluence of potent factors is acting as a significant accelerant for the expansion of the liquid hydrogen industry. Central among these are supportive government incentives, proactive policies favoring renewable energy integration, and a burgeoning global demand for sustainable and clean energy solutions. Concurrently, continuous advancements in hydrogen production technologies, such as innovative electrolysis methods, alongside improvements in the efficiency and safety of storage and transportation systems, and the successful development and commercialization of new applications across a diverse range of sectors, are collectively propelling market growth.
Long-Term Growth Catalysts in the Liquid Hydrogen Industry
Long-term growth will hinge on continued technological breakthroughs, strategic partnerships between energy companies, technology providers, and end-users, and expansions into new markets, particularly in developing economies with burgeoning energy needs. The successful implementation of large-scale green hydrogen production facilities will be a significant milestone in driving future market expansion.
Emerging Opportunities in Liquid Hydrogen Industry
The landscape of emerging opportunities within the liquid hydrogen industry is primarily concentrated around the scalable production of green hydrogen, harnessing abundant renewable energy sources. Significant potential also lies in the development of next-generation, highly efficient storage solutions, the strategic expansion of hydrogen refueling infrastructure to support widespread adoption, and the exploration of novel applications in critical areas such as grid-scale power generation, advanced chemical synthesis, and the decarbonization of hard-to-abate industrial sectors. These opportunities represent fertile ground for innovation, investment, and substantial future market expansion.
Leading Players in the Liquid Hydrogen Industry Sector
- Linde PLC
- Air Products and Chemicals Inc.
- Universal Industrial Gases Inc.
- Messer Group GMBH
- Iwatani Corporation
- Air Liquide
- Nippon Sanso Holdings Corporation
- Praxair Technology Inc.
- ITM Power
Key Milestones in Liquid Hydrogen Industry Industry
- May 2022: Air Liquide invested USD 250 Million and established its largest liquid hydrogen production and logistics infrastructure complex in North Las Vegas, Nevada.
- Sept 2022: Linde announced the construction of a 35-megawatt PEM electrolyzer to produce green hydrogen in Niagara Falls, New York.
- Mar 2023: Iwatani Corporation and ENEOS Corporation launched a "Liquefied Hydrogen Supply Chain Commercialization Demonstration Project" aimed at reducing hydrogen supply costs.
Strategic Outlook for Liquid Hydrogen Industry Market
The strategic outlook for the liquid hydrogen market is overwhelmingly positive, characterized by substantial growth potential driven by the escalating global imperative for clean energy solutions and decarbonization. Strategic investments in green hydrogen production infrastructure, the advancement of cutting-edge storage and transportation technologies, and the continued implementation of supportive government policies will be pivotal in unlocking the full economic and environmental benefits of this burgeoning market. The ongoing focus will remain on achieving significant reductions in production costs, enhancing overall operational efficiency, and broadening the diverse array of applications for liquid hydrogen across various industries, thereby contributing to the establishment of a sustainable and resilient global energy future.
Liquid Hydrogen Industry Segmentation
-
1. Distribution
- 1.1. Cryogenic Tank
- 1.2. High-Pressure Tube Trailers
-
2. End-user Industry
- 2.1. Automotive
- 2.2. Aerospace (including Outer Space)
- 2.3. Marine
- 2.4. Other End-User Industries
Liquid Hydrogen Industry Segmentation By Geography
-
1. Asia Pacific
- 1.1. China
- 1.2. India
- 1.3. Japan
- 1.4. South Korea
- 1.5. Rest of Asia Pacific
-
2. North America
- 2.1. United States
- 2.2. Canada
- 2.3. Mexico
-
3. Europe
- 3.1. Germany
- 3.2. United Kingdom
- 3.3. Italy
- 3.4. France
- 3.5. Rest of Europe
-
4. Rest of the World
- 4.1. South America
- 4.2. Middle East and Africa
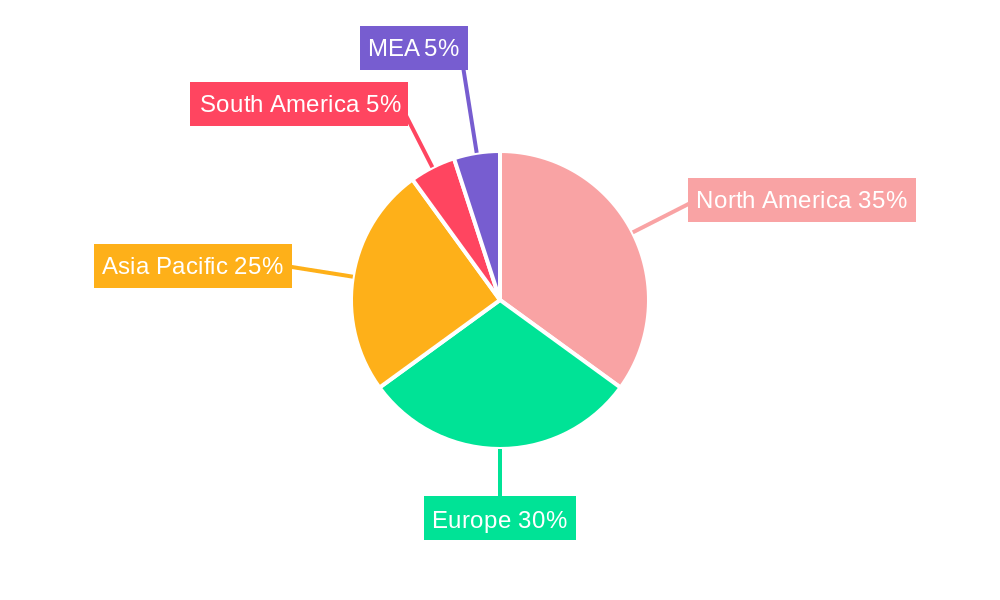
Liquid Hydrogen Industry Regional Market Share
Geographic Coverage of Liquid Hydrogen Industry
Liquid Hydrogen Industry REPORT HIGHLIGHTS
| Aspects | Details |
|---|---|
| Study Period | 2020-2034 |
| Base Year | 2025 |
| Estimated Year | 2026 |
| Forecast Period | 2026-2034 |
| Historical Period | 2020-2025 |
| Growth Rate | CAGR of 10.27% from 2020-2034 |
| Segmentation |
|
Table of Contents
- 1. Introduction
- 1.1. Research Scope
- 1.2. Market Segmentation
- 1.3. Research Objective
- 1.4. Definitions and Assumptions
- 2. Executive Summary
- 2.1. Market Snapshot
- 3. Market Dynamics
- 3.1. Market Drivers
- 3.2. Market Restrains
- 3.3. Market Trends
- 3.4. Market Opportunities
- 4. Market Factor Analysis
- 4.1. Porters Five Forces
- 4.1.1. Bargaining Power of Suppliers
- 4.1.2. Bargaining Power of Buyers
- 4.1.3. Threat of New Entrants
- 4.1.4. Threat of Substitutes
- 4.1.5. Competitive Rivalry
- 4.2. PESTEL analysis
- 4.3. BCG Analysis
- 4.3.1. Stars (High Growth, High Market Share)
- 4.3.2. Cash Cows (Low Growth, High Market Share)
- 4.3.3. Question Mark (High Growth, Low Market Share)
- 4.3.4. Dogs (Low Growth, Low Market Share)
- 4.4. Ansoff Matrix Analysis
- 4.5. Supply Chain Analysis
- 4.6. Regulatory Landscape
- 4.7. Current Market Potential and Opportunity Assessment (TAM–SAM–SOM Framework)
- 4.8. MSR Analyst Note
- 4.1. Porters Five Forces
- 5. Market Analysis, Insights and Forecast 2021-2033
- 5.1. Market Analysis, Insights and Forecast - by Distribution
- 5.1.1. Cryogenic Tank
- 5.1.2. High-Pressure Tube Trailers
- 5.2. Market Analysis, Insights and Forecast - by End-user Industry
- 5.2.1. Automotive
- 5.2.2. Aerospace (including Outer Space)
- 5.2.3. Marine
- 5.2.4. Other End-User Industries
- 5.3. Market Analysis, Insights and Forecast - by Region
- 5.3.1. Asia Pacific
- 5.3.2. North America
- 5.3.3. Europe
- 5.3.4. Rest of the World
- 5.1. Market Analysis, Insights and Forecast - by Distribution
- 6. Global Liquid Hydrogen Industry Analysis, Insights and Forecast, 2021-2033
- 6.1. Market Analysis, Insights and Forecast - by Distribution
- 6.1.1. Cryogenic Tank
- 6.1.2. High-Pressure Tube Trailers
- 6.2. Market Analysis, Insights and Forecast - by End-user Industry
- 6.2.1. Automotive
- 6.2.2. Aerospace (including Outer Space)
- 6.2.3. Marine
- 6.2.4. Other End-User Industries
- 6.1. Market Analysis, Insights and Forecast - by Distribution
- 7. Asia Pacific Liquid Hydrogen Industry Analysis, Insights and Forecast, 2020-2032
- 7.1. Market Analysis, Insights and Forecast - by Distribution
- 7.1.1. Cryogenic Tank
- 7.1.2. High-Pressure Tube Trailers
- 7.2. Market Analysis, Insights and Forecast - by End-user Industry
- 7.2.1. Automotive
- 7.2.2. Aerospace (including Outer Space)
- 7.2.3. Marine
- 7.2.4. Other End-User Industries
- 7.1. Market Analysis, Insights and Forecast - by Distribution
- 8. North America Liquid Hydrogen Industry Analysis, Insights and Forecast, 2020-2032
- 8.1. Market Analysis, Insights and Forecast - by Distribution
- 8.1.1. Cryogenic Tank
- 8.1.2. High-Pressure Tube Trailers
- 8.2. Market Analysis, Insights and Forecast - by End-user Industry
- 8.2.1. Automotive
- 8.2.2. Aerospace (including Outer Space)
- 8.2.3. Marine
- 8.2.4. Other End-User Industries
- 8.1. Market Analysis, Insights and Forecast - by Distribution
- 9. Europe Liquid Hydrogen Industry Analysis, Insights and Forecast, 2020-2032
- 9.1. Market Analysis, Insights and Forecast - by Distribution
- 9.1.1. Cryogenic Tank
- 9.1.2. High-Pressure Tube Trailers
- 9.2. Market Analysis, Insights and Forecast - by End-user Industry
- 9.2.1. Automotive
- 9.2.2. Aerospace (including Outer Space)
- 9.2.3. Marine
- 9.2.4. Other End-User Industries
- 9.1. Market Analysis, Insights and Forecast - by Distribution
- 10. Rest of the World Liquid Hydrogen Industry Analysis, Insights and Forecast, 2020-2032
- 10.1. Market Analysis, Insights and Forecast - by Distribution
- 10.1.1. Cryogenic Tank
- 10.1.2. High-Pressure Tube Trailers
- 10.2. Market Analysis, Insights and Forecast - by End-user Industry
- 10.2.1. Automotive
- 10.2.2. Aerospace (including Outer Space)
- 10.2.3. Marine
- 10.2.4. Other End-User Industries
- 10.1. Market Analysis, Insights and Forecast - by Distribution
- 11. Competitive Analysis
- 11.1. Company Profiles
- 11.1.1 Linde PLC
- 11.1.1.1. Company Overview
- 11.1.1.2. Products
- 11.1.1.3. Company Financials
- 11.1.1.4. SWOT Analysis
- 11.1.2 Air Products and Chemicals Inc
- 11.1.2.1. Company Overview
- 11.1.2.2. Products
- 11.1.2.3. Company Financials
- 11.1.2.4. SWOT Analysis
- 11.1.3 Universal Industrial Gases Inc *List Not Exhaustive
- 11.1.3.1. Company Overview
- 11.1.3.2. Products
- 11.1.3.3. Company Financials
- 11.1.3.4. SWOT Analysis
- 11.1.4 Messer Group GMBH
- 11.1.4.1. Company Overview
- 11.1.4.2. Products
- 11.1.4.3. Company Financials
- 11.1.4.4. SWOT Analysis
- 11.1.5 Iwatani Corporation
- 11.1.5.1. Company Overview
- 11.1.5.2. Products
- 11.1.5.3. Company Financials
- 11.1.5.4. SWOT Analysis
- 11.1.6 Air Liquide
- 11.1.6.1. Company Overview
- 11.1.6.2. Products
- 11.1.6.3. Company Financials
- 11.1.6.4. SWOT Analysis
- 11.1.7 Nippon Sanso Holdings Corporation
- 11.1.7.1. Company Overview
- 11.1.7.2. Products
- 11.1.7.3. Company Financials
- 11.1.7.4. SWOT Analysis
- 11.1.8 Nippon Sanso Holdings Corporation
- 11.1.8.1. Company Overview
- 11.1.8.2. Products
- 11.1.8.3. Company Financials
- 11.1.8.4. SWOT Analysis
- 11.1.9 Praxair Technology Inc.
- 11.1.9.1. Company Overview
- 11.1.9.2. Products
- 11.1.9.3. Company Financials
- 11.1.9.4. SWOT Analysis
- 11.1.10 ITM Power
- 11.1.10.1. Company Overview
- 11.1.10.2. Products
- 11.1.10.3. Company Financials
- 11.1.10.4. SWOT Analysis
- 11.1.1 Linde PLC
- 11.2. Market Entropy
- 11.2.1 Company's Key Areas Served
- 11.2.2 Recent Developments
- 11.3. Company Market Share Analysis 2025
- 11.3.1 Top 5 Companies Market Share Analysis
- 11.3.2 Top 3 Companies Market Share Analysis
- 11.4. List of Potential Customers
- 12. Research Methodology
List of Figures
- Figure 1: Global Liquid Hydrogen Industry Revenue Breakdown (Million, %) by Region 2025 & 2033
- Figure 2: Global Liquid Hydrogen Industry Volume Breakdown (kilotons, %) by Region 2025 & 2033
- Figure 3: Asia Pacific Liquid Hydrogen Industry Revenue (Million), by Distribution 2025 & 2033
- Figure 4: Asia Pacific Liquid Hydrogen Industry Volume (kilotons), by Distribution 2025 & 2033
- Figure 5: Asia Pacific Liquid Hydrogen Industry Revenue Share (%), by Distribution 2025 & 2033
- Figure 6: Asia Pacific Liquid Hydrogen Industry Volume Share (%), by Distribution 2025 & 2033
- Figure 7: Asia Pacific Liquid Hydrogen Industry Revenue (Million), by End-user Industry 2025 & 2033
- Figure 8: Asia Pacific Liquid Hydrogen Industry Volume (kilotons), by End-user Industry 2025 & 2033
- Figure 9: Asia Pacific Liquid Hydrogen Industry Revenue Share (%), by End-user Industry 2025 & 2033
- Figure 10: Asia Pacific Liquid Hydrogen Industry Volume Share (%), by End-user Industry 2025 & 2033
- Figure 11: Asia Pacific Liquid Hydrogen Industry Revenue (Million), by Country 2025 & 2033
- Figure 12: Asia Pacific Liquid Hydrogen Industry Volume (kilotons), by Country 2025 & 2033
- Figure 13: Asia Pacific Liquid Hydrogen Industry Revenue Share (%), by Country 2025 & 2033
- Figure 14: Asia Pacific Liquid Hydrogen Industry Volume Share (%), by Country 2025 & 2033
- Figure 15: North America Liquid Hydrogen Industry Revenue (Million), by Distribution 2025 & 2033
- Figure 16: North America Liquid Hydrogen Industry Volume (kilotons), by Distribution 2025 & 2033
- Figure 17: North America Liquid Hydrogen Industry Revenue Share (%), by Distribution 2025 & 2033
- Figure 18: North America Liquid Hydrogen Industry Volume Share (%), by Distribution 2025 & 2033
- Figure 19: North America Liquid Hydrogen Industry Revenue (Million), by End-user Industry 2025 & 2033
- Figure 20: North America Liquid Hydrogen Industry Volume (kilotons), by End-user Industry 2025 & 2033
- Figure 21: North America Liquid Hydrogen Industry Revenue Share (%), by End-user Industry 2025 & 2033
- Figure 22: North America Liquid Hydrogen Industry Volume Share (%), by End-user Industry 2025 & 2033
- Figure 23: North America Liquid Hydrogen Industry Revenue (Million), by Country 2025 & 2033
- Figure 24: North America Liquid Hydrogen Industry Volume (kilotons), by Country 2025 & 2033
- Figure 25: North America Liquid Hydrogen Industry Revenue Share (%), by Country 2025 & 2033
- Figure 26: North America Liquid Hydrogen Industry Volume Share (%), by Country 2025 & 2033
- Figure 27: Europe Liquid Hydrogen Industry Revenue (Million), by Distribution 2025 & 2033
- Figure 28: Europe Liquid Hydrogen Industry Volume (kilotons), by Distribution 2025 & 2033
- Figure 29: Europe Liquid Hydrogen Industry Revenue Share (%), by Distribution 2025 & 2033
- Figure 30: Europe Liquid Hydrogen Industry Volume Share (%), by Distribution 2025 & 2033
- Figure 31: Europe Liquid Hydrogen Industry Revenue (Million), by End-user Industry 2025 & 2033
- Figure 32: Europe Liquid Hydrogen Industry Volume (kilotons), by End-user Industry 2025 & 2033
- Figure 33: Europe Liquid Hydrogen Industry Revenue Share (%), by End-user Industry 2025 & 2033
- Figure 34: Europe Liquid Hydrogen Industry Volume Share (%), by End-user Industry 2025 & 2033
- Figure 35: Europe Liquid Hydrogen Industry Revenue (Million), by Country 2025 & 2033
- Figure 36: Europe Liquid Hydrogen Industry Volume (kilotons), by Country 2025 & 2033
- Figure 37: Europe Liquid Hydrogen Industry Revenue Share (%), by Country 2025 & 2033
- Figure 38: Europe Liquid Hydrogen Industry Volume Share (%), by Country 2025 & 2033
- Figure 39: Rest of the World Liquid Hydrogen Industry Revenue (Million), by Distribution 2025 & 2033
- Figure 40: Rest of the World Liquid Hydrogen Industry Volume (kilotons), by Distribution 2025 & 2033
- Figure 41: Rest of the World Liquid Hydrogen Industry Revenue Share (%), by Distribution 2025 & 2033
- Figure 42: Rest of the World Liquid Hydrogen Industry Volume Share (%), by Distribution 2025 & 2033
- Figure 43: Rest of the World Liquid Hydrogen Industry Revenue (Million), by End-user Industry 2025 & 2033
- Figure 44: Rest of the World Liquid Hydrogen Industry Volume (kilotons), by End-user Industry 2025 & 2033
- Figure 45: Rest of the World Liquid Hydrogen Industry Revenue Share (%), by End-user Industry 2025 & 2033
- Figure 46: Rest of the World Liquid Hydrogen Industry Volume Share (%), by End-user Industry 2025 & 2033
- Figure 47: Rest of the World Liquid Hydrogen Industry Revenue (Million), by Country 2025 & 2033
- Figure 48: Rest of the World Liquid Hydrogen Industry Volume (kilotons), by Country 2025 & 2033
- Figure 49: Rest of the World Liquid Hydrogen Industry Revenue Share (%), by Country 2025 & 2033
- Figure 50: Rest of the World Liquid Hydrogen Industry Volume Share (%), by Country 2025 & 2033
List of Tables
- Table 1: Global Liquid Hydrogen Industry Revenue Million Forecast, by Distribution 2020 & 2033
- Table 2: Global Liquid Hydrogen Industry Volume kilotons Forecast, by Distribution 2020 & 2033
- Table 3: Global Liquid Hydrogen Industry Revenue Million Forecast, by End-user Industry 2020 & 2033
- Table 4: Global Liquid Hydrogen Industry Volume kilotons Forecast, by End-user Industry 2020 & 2033
- Table 5: Global Liquid Hydrogen Industry Revenue Million Forecast, by Region 2020 & 2033
- Table 6: Global Liquid Hydrogen Industry Volume kilotons Forecast, by Region 2020 & 2033
- Table 7: Global Liquid Hydrogen Industry Revenue Million Forecast, by Distribution 2020 & 2033
- Table 8: Global Liquid Hydrogen Industry Volume kilotons Forecast, by Distribution 2020 & 2033
- Table 9: Global Liquid Hydrogen Industry Revenue Million Forecast, by End-user Industry 2020 & 2033
- Table 10: Global Liquid Hydrogen Industry Volume kilotons Forecast, by End-user Industry 2020 & 2033
- Table 11: Global Liquid Hydrogen Industry Revenue Million Forecast, by Country 2020 & 2033
- Table 12: Global Liquid Hydrogen Industry Volume kilotons Forecast, by Country 2020 & 2033
- Table 13: China Liquid Hydrogen Industry Revenue (Million) Forecast, by Application 2020 & 2033
- Table 14: China Liquid Hydrogen Industry Volume (kilotons) Forecast, by Application 2020 & 2033
- Table 15: India Liquid Hydrogen Industry Revenue (Million) Forecast, by Application 2020 & 2033
- Table 16: India Liquid Hydrogen Industry Volume (kilotons) Forecast, by Application 2020 & 2033
- Table 17: Japan Liquid Hydrogen Industry Revenue (Million) Forecast, by Application 2020 & 2033
- Table 18: Japan Liquid Hydrogen Industry Volume (kilotons) Forecast, by Application 2020 & 2033
- Table 19: South Korea Liquid Hydrogen Industry Revenue (Million) Forecast, by Application 2020 & 2033
- Table 20: South Korea Liquid Hydrogen Industry Volume (kilotons) Forecast, by Application 2020 & 2033
- Table 21: Rest of Asia Pacific Liquid Hydrogen Industry Revenue (Million) Forecast, by Application 2020 & 2033
- Table 22: Rest of Asia Pacific Liquid Hydrogen Industry Volume (kilotons) Forecast, by Application 2020 & 2033
- Table 23: Global Liquid Hydrogen Industry Revenue Million Forecast, by Distribution 2020 & 2033
- Table 24: Global Liquid Hydrogen Industry Volume kilotons Forecast, by Distribution 2020 & 2033
- Table 25: Global Liquid Hydrogen Industry Revenue Million Forecast, by End-user Industry 2020 & 2033
- Table 26: Global Liquid Hydrogen Industry Volume kilotons Forecast, by End-user Industry 2020 & 2033
- Table 27: Global Liquid Hydrogen Industry Revenue Million Forecast, by Country 2020 & 2033
- Table 28: Global Liquid Hydrogen Industry Volume kilotons Forecast, by Country 2020 & 2033
- Table 29: United States Liquid Hydrogen Industry Revenue (Million) Forecast, by Application 2020 & 2033
- Table 30: United States Liquid Hydrogen Industry Volume (kilotons) Forecast, by Application 2020 & 2033
- Table 31: Canada Liquid Hydrogen Industry Revenue (Million) Forecast, by Application 2020 & 2033
- Table 32: Canada Liquid Hydrogen Industry Volume (kilotons) Forecast, by Application 2020 & 2033
- Table 33: Mexico Liquid Hydrogen Industry Revenue (Million) Forecast, by Application 2020 & 2033
- Table 34: Mexico Liquid Hydrogen Industry Volume (kilotons) Forecast, by Application 2020 & 2033
- Table 35: Global Liquid Hydrogen Industry Revenue Million Forecast, by Distribution 2020 & 2033
- Table 36: Global Liquid Hydrogen Industry Volume kilotons Forecast, by Distribution 2020 & 2033
- Table 37: Global Liquid Hydrogen Industry Revenue Million Forecast, by End-user Industry 2020 & 2033
- Table 38: Global Liquid Hydrogen Industry Volume kilotons Forecast, by End-user Industry 2020 & 2033
- Table 39: Global Liquid Hydrogen Industry Revenue Million Forecast, by Country 2020 & 2033
- Table 40: Global Liquid Hydrogen Industry Volume kilotons Forecast, by Country 2020 & 2033
- Table 41: Germany Liquid Hydrogen Industry Revenue (Million) Forecast, by Application 2020 & 2033
- Table 42: Germany Liquid Hydrogen Industry Volume (kilotons) Forecast, by Application 2020 & 2033
- Table 43: United Kingdom Liquid Hydrogen Industry Revenue (Million) Forecast, by Application 2020 & 2033
- Table 44: United Kingdom Liquid Hydrogen Industry Volume (kilotons) Forecast, by Application 2020 & 2033
- Table 45: Italy Liquid Hydrogen Industry Revenue (Million) Forecast, by Application 2020 & 2033
- Table 46: Italy Liquid Hydrogen Industry Volume (kilotons) Forecast, by Application 2020 & 2033
- Table 47: France Liquid Hydrogen Industry Revenue (Million) Forecast, by Application 2020 & 2033
- Table 48: France Liquid Hydrogen Industry Volume (kilotons) Forecast, by Application 2020 & 2033
- Table 49: Rest of Europe Liquid Hydrogen Industry Revenue (Million) Forecast, by Application 2020 & 2033
- Table 50: Rest of Europe Liquid Hydrogen Industry Volume (kilotons) Forecast, by Application 2020 & 2033
- Table 51: Global Liquid Hydrogen Industry Revenue Million Forecast, by Distribution 2020 & 2033
- Table 52: Global Liquid Hydrogen Industry Volume kilotons Forecast, by Distribution 2020 & 2033
- Table 53: Global Liquid Hydrogen Industry Revenue Million Forecast, by End-user Industry 2020 & 2033
- Table 54: Global Liquid Hydrogen Industry Volume kilotons Forecast, by End-user Industry 2020 & 2033
- Table 55: Global Liquid Hydrogen Industry Revenue Million Forecast, by Country 2020 & 2033
- Table 56: Global Liquid Hydrogen Industry Volume kilotons Forecast, by Country 2020 & 2033
- Table 57: South America Liquid Hydrogen Industry Revenue (Million) Forecast, by Application 2020 & 2033
- Table 58: South America Liquid Hydrogen Industry Volume (kilotons) Forecast, by Application 2020 & 2033
- Table 59: Middle East and Africa Liquid Hydrogen Industry Revenue (Million) Forecast, by Application 2020 & 2033
- Table 60: Middle East and Africa Liquid Hydrogen Industry Volume (kilotons) Forecast, by Application 2020 & 2033
Frequently Asked Questions
1. What is the projected Compound Annual Growth Rate (CAGR) of the Liquid Hydrogen Industry?
The projected CAGR is approximately 10.27%.
2. Which companies are prominent players in the Liquid Hydrogen Industry?
Key companies in the market include Linde PLC, Air Products and Chemicals Inc, Universal Industrial Gases Inc *List Not Exhaustive, Messer Group GMBH, Iwatani Corporation, Air Liquide, Nippon Sanso Holdings Corporation, Nippon Sanso Holdings Corporation , Praxair Technology Inc. , ITM Power.
3. What are the main segments of the Liquid Hydrogen Industry?
The market segments include Distribution, End-user Industry.
4. Can you provide details about the market size?
The market size is estimated to be USD 38400 Million as of 2022.
5. What are some drivers contributing to market growth?
Growing Demand for Liquid Hydrogen for Space Exploration; Increasing Adoption of Hydrogen Fuel Cell in Commercial Vehicle.
6. What are the notable trends driving market growth?
Aerospace Industry to Dominate the Market.
7. Are there any restraints impacting market growth?
High Cost Associated with Handling and Storage; Other Restraints.
8. Can you provide examples of recent developments in the market?
Mar 2023: Iwatani Corporation and ENEOS Corporation were working to deliver a "Liquefied Hydrogen Supply Chain Commercialization Demonstration Project. The project aims to develop marine transportation technologies of liquefied clean hydrogen, which will help to achieve a hydrogen supply cost of 30 JPY/Nm3 by 2030.
9. What pricing options are available for accessing the report?
Pricing options include single-user, multi-user, and enterprise licenses priced at USD 4750, USD 5250, and USD 8750 respectively.
10. Is the market size provided in terms of value or volume?
The market size is provided in terms of value, measured in Million and volume, measured in kilotons.
11. Are there any specific market keywords associated with the report?
Yes, the market keyword associated with the report is "Liquid Hydrogen Industry," which aids in identifying and referencing the specific market segment covered.
12. How do I determine which pricing option suits my needs best?
The pricing options vary based on user requirements and access needs. Individual users may opt for single-user licenses, while businesses requiring broader access may choose multi-user or enterprise licenses for cost-effective access to the report.
13. Are there any additional resources or data provided in the Liquid Hydrogen Industry report?
While the report offers comprehensive insights, it's advisable to review the specific contents or supplementary materials provided to ascertain if additional resources or data are available.
14. How can I stay updated on further developments or reports in the Liquid Hydrogen Industry?
To stay informed about further developments, trends, and reports in the Liquid Hydrogen Industry, consider subscribing to industry newsletters, following relevant companies and organizations, or regularly checking reputable industry news sources and publications.
Methodology
Step 1 - Identification of Relevant Samples Size from Population Database


Step 2 - Approaches for Defining Global Market Size (Value, Volume* & Price*)

Note*: In applicable scenarios
Step 3 - Data Sources
Primary Research
- Web Analytics
- Survey Reports
- Research Institute
- Latest Research Reports
- Opinion Leaders
Secondary Research
- Annual Reports
- White Paper
- Latest Press Release
- Industry Association
- Paid Database
- Investor Presentations

Step 4 - Data Triangulation
Involves using different sources of information in order to increase the validity of a study
These sources are likely to be stakeholders in a program - participants, other researchers, program staff, other community members, and so on.
Then we put all data in single framework & apply various statistical tools to find out the dynamic on the market.
During the analysis stage, feedback from the stakeholder groups would be compared to determine areas of agreement as well as areas of divergence