

Key Insights
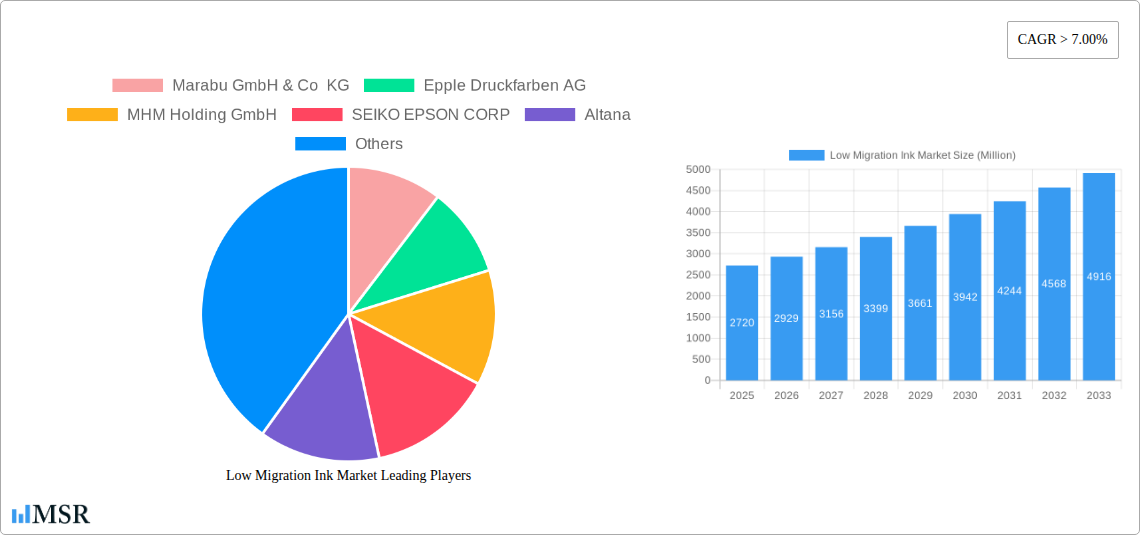
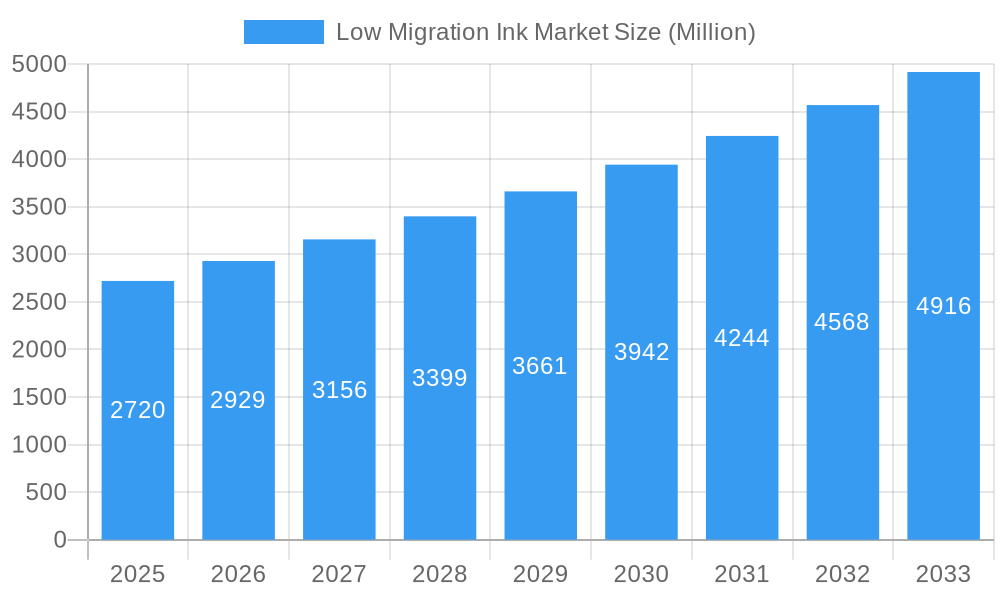
The low migration ink market, valued at $2720 million in 2025, is projected to experience robust growth, exceeding a 7% CAGR from 2025 to 2033. This expansion is driven by the increasing demand for safe and high-quality packaging across various industries, particularly food and beverage, pharmaceuticals, and personal care. Consumers are increasingly concerned about potential migration of ink components into packaged products, leading to a strong preference for low-migration inks that ensure product safety and integrity. The market's segmentation reflects this trend, with significant growth anticipated in segments utilizing digital and flexographic printing processes, catering to the high-volume demands of flexible packaging. Technological advancements in ink formulations, enabling superior performance and reduced migration levels, further contribute to market expansion. While the market faces some restraints related to higher production costs compared to conventional inks, the growing regulatory scrutiny and consumer awareness surrounding food safety are powerful catalysts for market growth. This creates a compelling incentive for manufacturers to invest in low-migration ink technologies, resulting in a competitive yet expanding market landscape.
Low Migration Ink Market Market Size (In Billion)
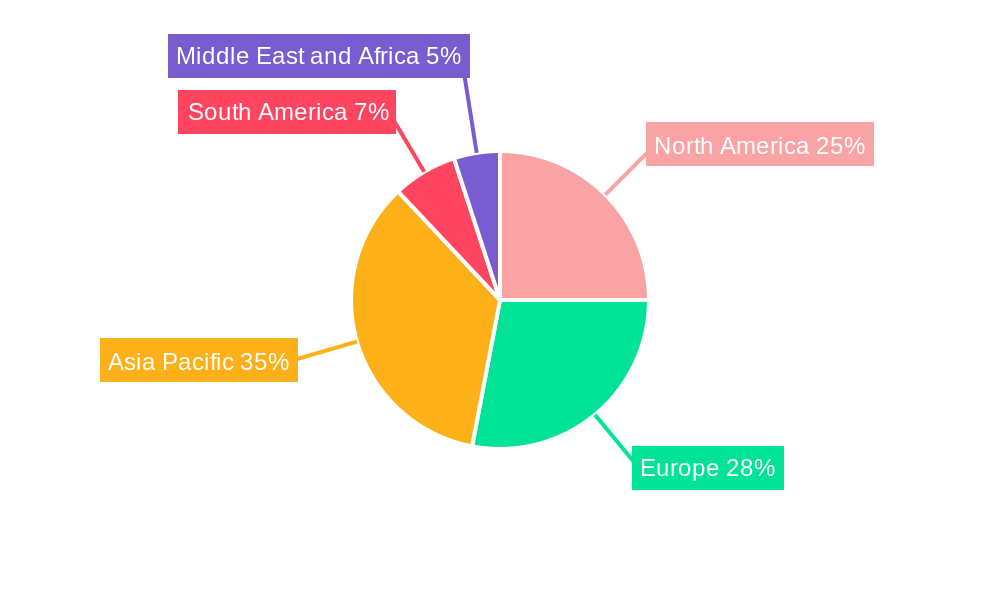
The geographical distribution of this market reveals strong growth potential across various regions. Asia Pacific, driven by large-scale manufacturing and growing consumer populations in countries like China and India, is expected to represent a significant market share. North America and Europe, with their established regulatory frameworks and stringent food safety standards, will also witness notable growth. The presence of established ink manufacturers and advanced printing technologies in these regions further fuels market expansion. However, emerging markets in South America, the Middle East, and Africa present significant opportunities for future growth as consumer demand and regulatory frameworks evolve. The competitive landscape is marked by a mix of global giants and regional players, fostering innovation and offering a wide range of product options to meet the diverse needs of different industries. Future market development will likely be shaped by advancements in sustainable ink formulations, utilizing bio-based materials and minimizing environmental impact, adding a crucial dimension to the market's ongoing expansion.
Low Migration Ink Market Company Market Share
Unlock Growth in the Thriving Low Migration Ink Market: A Comprehensive Report (2019-2033)
This comprehensive report provides an in-depth analysis of the Low Migration Ink Market, offering invaluable insights for industry stakeholders, investors, and strategic decision-makers. Covering the period 2019-2033, with a base year of 2025, this study forecasts market trends and identifies key opportunities for growth. The report meticulously examines market dynamics, technological advancements, and competitive landscapes, providing actionable intelligence to navigate the complexities of this dynamic sector. The global Low Migration Ink market is projected to reach xx Million by 2033, exhibiting a CAGR of xx% during the forecast period (2025-2033).
Low Migration Ink Market Concentration & Dynamics
The Low Migration Ink market exhibits a moderately concentrated structure, with several key players holding significant market share. Market share data from 2024 indicates that the top five companies collectively control approximately xx% of the global market. However, the presence of numerous smaller, specialized players fosters innovation and competition. The market's dynamic nature is shaped by several interconnected factors:
- Innovation Ecosystems: Significant investments in R&D are driving the development of next-generation low-migration inks with enhanced performance and sustainability features. AI-assisted formulation and sustainable production processes are transforming the industry.
- Regulatory Frameworks: Stringent regulations concerning food contact materials and packaging are a major driver, pushing manufacturers to develop and adopt low-migration inks that comply with safety standards globally. These regulations vary across regions, creating both challenges and opportunities.
- Substitute Products: While alternatives exist, the superior performance characteristics and safety profiles of low-migration inks limit their widespread adoption as substitutes. The demand for high-quality printing with minimal migration remains a significant advantage.
- End-User Trends: The increasing demand for safe and sustainable packaging across various sectors, particularly Food and Beverage and Personal Care, significantly fuels market growth. Consumer awareness of potential health risks associated with ink migration is also a pivotal factor.
- M&A Activities: The past five years have witnessed xx M&A deals in the Low Migration Ink market, highlighting a trend of consolidation and strategic expansion among leading players. These acquisitions often aim to bolster product portfolios, expand geographical reach, and enhance technological capabilities.
Low Migration Ink Market Industry Insights & Trends
The Low Migration Ink market is experiencing robust growth, driven by several key factors. The global market size was valued at xx Million in 2024 and is projected to reach xx Million by 2033. This significant expansion is fueled by:
- Increased Demand for Sustainable Packaging: Growing environmental consciousness among consumers and brands is creating a significant demand for eco-friendly packaging solutions. Low-migration inks, with their reduced environmental impact, are perfectly aligned with this trend.
- Stringent Regulatory Compliance: Governments worldwide are imposing stricter regulations regarding food contact materials and packaging, mandating the use of low-migration inks to ensure consumer safety.
- Technological Advancements: Continuous innovation in ink formulation, including the development of ultra-low-migration inks and AI-assisted formulation, is enhancing product performance and expanding application possibilities.
- Growth in End-Use Sectors: The expansion of sectors like pharmaceuticals, food & beverage, and personal care, which heavily rely on high-quality printing, is further fueling market growth.
Key Markets & Segments Leading Low Migration Ink Market
The dominant segment within the Low Migration Ink market is currently the Flexography printing process, driven by its cost-effectiveness and suitability for high-volume printing. The Food and Beverage end-user industry represents the largest market share, followed by the Personal Care sector. Geographically, Europe and North America currently dominate the market due to stringent regulations and a high awareness of sustainable packaging solutions.
- Drivers for Flexography Segment: High-volume production capabilities, cost-effectiveness, and versatility across various substrates.
- Drivers for Food and Beverage Segment: Stringent regulations, high consumer awareness, and the need for safe and aesthetically pleasing packaging.
- Drivers for Personal Care Segment: Demand for high-quality, visually appealing packaging that meets stringent safety and regulatory requirements.
- Geographic Drivers (Europe & North America): Stringent regulations, high consumer awareness, well-established packaging industries, and a strong focus on sustainability.
Low Migration Ink Market Product Developments
Recent years have witnessed remarkable advancements in low-migration ink technology. The launch of ultra-low migration inks with improved performance characteristics and broader application possibilities has significantly impacted the market. These innovations focus on enhancing color vibrancy, print quality, and substrate compatibility while minimizing migration risks. The development of AI-assisted ink formulation technologies is streamlining the development process, leading to faster time-to-market and more customized ink solutions.
Challenges in the Low Migration Ink Market Market
The Low Migration Ink market faces several challenges: fluctuations in raw material prices, stringent regulatory compliance requirements (resulting in increased costs and complexity), and intense competition among established and emerging players. These factors can influence profitability and market entry barriers. The supply chain complexities arising from global events can cause disruptions impacting production and delivery times.
Forces Driving Low Migration Ink Market Growth
Several factors propel the market's growth trajectory:
- Increased consumer demand for sustainable packaging: This trend pushes manufacturers to adopt eco-friendly inks.
- Stringent regulations governing food contact materials: Stricter rules drive the adoption of low-migration solutions.
- Technological advancements in ink formulations: The creation of superior, safer inks with better performance drives market expansion.
Challenges in the Low Migration Ink Market Market
Long-term growth hinges on continued innovation in ink technology, focusing on enhanced performance, sustainability, and cost-effectiveness. Strategic partnerships and market expansions into emerging economies will be crucial for sustained growth.
Emerging Opportunities in Low Migration Ink Market
Emerging opportunities lie in expanding into new geographical markets, particularly in developing economies with growing consumer demand and regulatory changes. Developing specialized low-migration inks for niche applications and exploring new sustainable production processes present lucrative avenues for growth.
Leading Players in the Low Migration Ink Market Sector
- Marabu GmbH & Co KG
- Epple Druckfarben AG
- MHM Holding GmbH
- SEIKO EPSON CORP
- Altana
- Sun Chemical
- TOYO INK CO LTD
- FUJIFILM Corporation
- HAPA AG
- HP Development Company L P
- Encres Dubuit
- Wikoff Color Corporation
- Siegwerk Druckfarben AG & Co KGaA
- INX International Ink Co
- hubergroup Deutschland GmbH
- Kao Collins Corporation
- SPGPrints B V
- Flint Group
- Agfa-Gevaert Group
- RUCO Druckfarben
Key Milestones in Low Migration Ink Market Industry
- 2020: Several leading companies launched new ultra-low-migration ink lines, emphasizing enhanced safety and sustainability.
- 2021: Significant investments were made in AI-assisted ink formulation technologies, accelerating innovation and product development.
- 2022: A notable increase in strategic acquisitions and partnerships aimed at expanding product portfolios and market reach.
- 2023: Growing investment in sustainable ink production processes, reflecting the industry's commitment to environmental responsibility.
Strategic Outlook for Low Migration Ink Market Market
The future of the Low Migration Ink market appears promising, driven by sustained demand for safe and sustainable packaging across various sectors. Strategic opportunities lie in focusing on innovation, strategic partnerships, and expansion into new and emerging markets. Companies that proactively address regulatory compliance, invest in sustainable production, and leverage technological advancements will be best positioned for long-term success.
Low Migration Ink Market Segmentation
-
1. Printing Process
- 1.1. Gravure
- 1.2. Digital
- 1.3. Offset
- 1.4. Flexography
-
2. End-user Industry
- 2.1. Personal Care
- 2.2. Pharmaceuticals
- 2.3. Food and Beverage
- 2.4. Others
Low Migration Ink Market Segmentation By Geography
-
1. Asia Pacific
- 1.1. China
- 1.2. India
- 1.3. Japan
- 1.4. South Korea
- 1.5. Rest of Asia Pacific
-
2. North America
- 2.1. United States
- 2.2. Canada
- 2.3. Mexico
-
3. Europe
- 3.1. Germany
- 3.2. United Kingdom
- 3.3. France
- 3.4. Italy
- 3.5. Rest of Europe
-
4. South America
- 4.1. Brazil
- 4.2. Argentina
- 4.3. Rest of South America
-
5. Middle East and Africa
- 5.1. Saudi Arabia
- 5.2. South Africa
- 5.3. Rest of Middle East and Africa
Low Migration Ink Market Regional Market Share
Geographic Coverage of Low Migration Ink Market
Low Migration Ink Market REPORT HIGHLIGHTS
| Aspects | Details |
|---|---|
| Study Period | 2020-2034 |
| Base Year | 2025 |
| Estimated Year | 2026 |
| Forecast Period | 2026-2034 |
| Historical Period | 2020-2025 |
| Growth Rate | CAGR of 6.3% from 2020-2034 |
| Segmentation |
|
Table of Contents
- 1. Introduction
- 1.1. Research Scope
- 1.2. Market Segmentation
- 1.3. Research Objective
- 1.4. Definitions and Assumptions
- 2. Executive Summary
- 2.1. Market Snapshot
- 3. Market Dynamics
- 3.1. Market Drivers
- 3.2. Market Restrains
- 3.3. Market Trends
- 3.4. Market Opportunities
- 4. Market Factor Analysis
- 4.1. Porters Five Forces
- 4.1.1. Bargaining Power of Suppliers
- 4.1.2. Bargaining Power of Buyers
- 4.1.3. Threat of New Entrants
- 4.1.4. Threat of Substitutes
- 4.1.5. Competitive Rivalry
- 4.2. PESTEL analysis
- 4.3. BCG Analysis
- 4.3.1. Stars (High Growth, High Market Share)
- 4.3.2. Cash Cows (Low Growth, High Market Share)
- 4.3.3. Question Mark (High Growth, Low Market Share)
- 4.3.4. Dogs (Low Growth, Low Market Share)
- 4.4. Ansoff Matrix Analysis
- 4.5. Supply Chain Analysis
- 4.6. Regulatory Landscape
- 4.7. Current Market Potential and Opportunity Assessment (TAM–SAM–SOM Framework)
- 4.8. MSR Analyst Note
- 4.1. Porters Five Forces
- 5. Market Analysis, Insights and Forecast 2021-2033
- 5.1. Market Analysis, Insights and Forecast - by Printing Process
- 5.1.1. Gravure
- 5.1.2. Digital
- 5.1.3. Offset
- 5.1.4. Flexography
- 5.2. Market Analysis, Insights and Forecast - by End-user Industry
- 5.2.1. Personal Care
- 5.2.2. Pharmaceuticals
- 5.2.3. Food and Beverage
- 5.2.4. Others
- 5.3. Market Analysis, Insights and Forecast - by Region
- 5.3.1. Asia Pacific
- 5.3.2. North America
- 5.3.3. Europe
- 5.3.4. South America
- 5.3.5. Middle East and Africa
- 5.1. Market Analysis, Insights and Forecast - by Printing Process
- 6. Global Low Migration Ink Market Analysis, Insights and Forecast, 2021-2033
- 6.1. Market Analysis, Insights and Forecast - by Printing Process
- 6.1.1. Gravure
- 6.1.2. Digital
- 6.1.3. Offset
- 6.1.4. Flexography
- 6.2. Market Analysis, Insights and Forecast - by End-user Industry
- 6.2.1. Personal Care
- 6.2.2. Pharmaceuticals
- 6.2.3. Food and Beverage
- 6.2.4. Others
- 6.1. Market Analysis, Insights and Forecast - by Printing Process
- 7. Asia Pacific Low Migration Ink Market Analysis, Insights and Forecast, 2020-2032
- 7.1. Market Analysis, Insights and Forecast - by Printing Process
- 7.1.1. Gravure
- 7.1.2. Digital
- 7.1.3. Offset
- 7.1.4. Flexography
- 7.2. Market Analysis, Insights and Forecast - by End-user Industry
- 7.2.1. Personal Care
- 7.2.2. Pharmaceuticals
- 7.2.3. Food and Beverage
- 7.2.4. Others
- 7.1. Market Analysis, Insights and Forecast - by Printing Process
- 8. North America Low Migration Ink Market Analysis, Insights and Forecast, 2020-2032
- 8.1. Market Analysis, Insights and Forecast - by Printing Process
- 8.1.1. Gravure
- 8.1.2. Digital
- 8.1.3. Offset
- 8.1.4. Flexography
- 8.2. Market Analysis, Insights and Forecast - by End-user Industry
- 8.2.1. Personal Care
- 8.2.2. Pharmaceuticals
- 8.2.3. Food and Beverage
- 8.2.4. Others
- 8.1. Market Analysis, Insights and Forecast - by Printing Process
- 9. Europe Low Migration Ink Market Analysis, Insights and Forecast, 2020-2032
- 9.1. Market Analysis, Insights and Forecast - by Printing Process
- 9.1.1. Gravure
- 9.1.2. Digital
- 9.1.3. Offset
- 9.1.4. Flexography
- 9.2. Market Analysis, Insights and Forecast - by End-user Industry
- 9.2.1. Personal Care
- 9.2.2. Pharmaceuticals
- 9.2.3. Food and Beverage
- 9.2.4. Others
- 9.1. Market Analysis, Insights and Forecast - by Printing Process
- 10. South America Low Migration Ink Market Analysis, Insights and Forecast, 2020-2032
- 10.1. Market Analysis, Insights and Forecast - by Printing Process
- 10.1.1. Gravure
- 10.1.2. Digital
- 10.1.3. Offset
- 10.1.4. Flexography
- 10.2. Market Analysis, Insights and Forecast - by End-user Industry
- 10.2.1. Personal Care
- 10.2.2. Pharmaceuticals
- 10.2.3. Food and Beverage
- 10.2.4. Others
- 10.1. Market Analysis, Insights and Forecast - by Printing Process
- 11. Middle East and Africa Low Migration Ink Market Analysis, Insights and Forecast, 2020-2032
- 11.1. Market Analysis, Insights and Forecast - by Printing Process
- 11.1.1. Gravure
- 11.1.2. Digital
- 11.1.3. Offset
- 11.1.4. Flexography
- 11.2. Market Analysis, Insights and Forecast - by End-user Industry
- 11.2.1. Personal Care
- 11.2.2. Pharmaceuticals
- 11.2.3. Food and Beverage
- 11.2.4. Others
- 11.1. Market Analysis, Insights and Forecast - by Printing Process
- 12. Competitive Analysis
- 12.1. Company Profiles
- 12.1.1 Marabu GmbH & Co KG
- 12.1.1.1. Company Overview
- 12.1.1.2. Products
- 12.1.1.3. Company Financials
- 12.1.1.4. SWOT Analysis
- 12.1.2 Epple Druckfarben AG
- 12.1.2.1. Company Overview
- 12.1.2.2. Products
- 12.1.2.3. Company Financials
- 12.1.2.4. SWOT Analysis
- 12.1.3 MHM Holding GmbH
- 12.1.3.1. Company Overview
- 12.1.3.2. Products
- 12.1.3.3. Company Financials
- 12.1.3.4. SWOT Analysis
- 12.1.4 SEIKO EPSON CORP
- 12.1.4.1. Company Overview
- 12.1.4.2. Products
- 12.1.4.3. Company Financials
- 12.1.4.4. SWOT Analysis
- 12.1.5 Altana
- 12.1.5.1. Company Overview
- 12.1.5.2. Products
- 12.1.5.3. Company Financials
- 12.1.5.4. SWOT Analysis
- 12.1.6 Sun Chemical
- 12.1.6.1. Company Overview
- 12.1.6.2. Products
- 12.1.6.3. Company Financials
- 12.1.6.4. SWOT Analysis
- 12.1.7 TOYO INK CO LTD
- 12.1.7.1. Company Overview
- 12.1.7.2. Products
- 12.1.7.3. Company Financials
- 12.1.7.4. SWOT Analysis
- 12.1.8 FUJIFILM Corporation
- 12.1.8.1. Company Overview
- 12.1.8.2. Products
- 12.1.8.3. Company Financials
- 12.1.8.4. SWOT Analysis
- 12.1.9 HAPA AG
- 12.1.9.1. Company Overview
- 12.1.9.2. Products
- 12.1.9.3. Company Financials
- 12.1.9.4. SWOT Analysis
- 12.1.10 HP Development Company L P
- 12.1.10.1. Company Overview
- 12.1.10.2. Products
- 12.1.10.3. Company Financials
- 12.1.10.4. SWOT Analysis
- 12.1.11 Encres Dubuit
- 12.1.11.1. Company Overview
- 12.1.11.2. Products
- 12.1.11.3. Company Financials
- 12.1.11.4. SWOT Analysis
- 12.1.12 Wikoff Color Corporation*List Not Exhaustive
- 12.1.12.1. Company Overview
- 12.1.12.2. Products
- 12.1.12.3. Company Financials
- 12.1.12.4. SWOT Analysis
- 12.1.13 Siegwerk Druckfarben AG & Co KGaA
- 12.1.13.1. Company Overview
- 12.1.13.2. Products
- 12.1.13.3. Company Financials
- 12.1.13.4. SWOT Analysis
- 12.1.14 INX International Ink Co
- 12.1.14.1. Company Overview
- 12.1.14.2. Products
- 12.1.14.3. Company Financials
- 12.1.14.4. SWOT Analysis
- 12.1.15 hubergroup Deutschland GmbH
- 12.1.15.1. Company Overview
- 12.1.15.2. Products
- 12.1.15.3. Company Financials
- 12.1.15.4. SWOT Analysis
- 12.1.16 Kao Collins Corporation
- 12.1.16.1. Company Overview
- 12.1.16.2. Products
- 12.1.16.3. Company Financials
- 12.1.16.4. SWOT Analysis
- 12.1.17 SPGPrints B V
- 12.1.17.1. Company Overview
- 12.1.17.2. Products
- 12.1.17.3. Company Financials
- 12.1.17.4. SWOT Analysis
- 12.1.18 Flint Group
- 12.1.18.1. Company Overview
- 12.1.18.2. Products
- 12.1.18.3. Company Financials
- 12.1.18.4. SWOT Analysis
- 12.1.19 Agfa-Gevaert Group
- 12.1.19.1. Company Overview
- 12.1.19.2. Products
- 12.1.19.3. Company Financials
- 12.1.19.4. SWOT Analysis
- 12.1.20 RUCO Druckfarben
- 12.1.20.1. Company Overview
- 12.1.20.2. Products
- 12.1.20.3. Company Financials
- 12.1.20.4. SWOT Analysis
- 12.1.1 Marabu GmbH & Co KG
- 12.2. Market Entropy
- 12.2.1 Company's Key Areas Served
- 12.2.2 Recent Developments
- 12.3. Company Market Share Analysis 2025
- 12.3.1 Top 5 Companies Market Share Analysis
- 12.3.2 Top 3 Companies Market Share Analysis
- 12.4. List of Potential Customers
- 13. Research Methodology
List of Figures
- Figure 1: Global Low Migration Ink Market Revenue Breakdown (million, %) by Region 2025 & 2033
- Figure 2: Global Low Migration Ink Market Volume Breakdown (liter , %) by Region 2025 & 2033
- Figure 3: Asia Pacific Low Migration Ink Market Revenue (million), by Printing Process 2025 & 2033
- Figure 4: Asia Pacific Low Migration Ink Market Volume (liter ), by Printing Process 2025 & 2033
- Figure 5: Asia Pacific Low Migration Ink Market Revenue Share (%), by Printing Process 2025 & 2033
- Figure 6: Asia Pacific Low Migration Ink Market Volume Share (%), by Printing Process 2025 & 2033
- Figure 7: Asia Pacific Low Migration Ink Market Revenue (million), by End-user Industry 2025 & 2033
- Figure 8: Asia Pacific Low Migration Ink Market Volume (liter ), by End-user Industry 2025 & 2033
- Figure 9: Asia Pacific Low Migration Ink Market Revenue Share (%), by End-user Industry 2025 & 2033
- Figure 10: Asia Pacific Low Migration Ink Market Volume Share (%), by End-user Industry 2025 & 2033
- Figure 11: Asia Pacific Low Migration Ink Market Revenue (million), by Country 2025 & 2033
- Figure 12: Asia Pacific Low Migration Ink Market Volume (liter ), by Country 2025 & 2033
- Figure 13: Asia Pacific Low Migration Ink Market Revenue Share (%), by Country 2025 & 2033
- Figure 14: Asia Pacific Low Migration Ink Market Volume Share (%), by Country 2025 & 2033
- Figure 15: North America Low Migration Ink Market Revenue (million), by Printing Process 2025 & 2033
- Figure 16: North America Low Migration Ink Market Volume (liter ), by Printing Process 2025 & 2033
- Figure 17: North America Low Migration Ink Market Revenue Share (%), by Printing Process 2025 & 2033
- Figure 18: North America Low Migration Ink Market Volume Share (%), by Printing Process 2025 & 2033
- Figure 19: North America Low Migration Ink Market Revenue (million), by End-user Industry 2025 & 2033
- Figure 20: North America Low Migration Ink Market Volume (liter ), by End-user Industry 2025 & 2033
- Figure 21: North America Low Migration Ink Market Revenue Share (%), by End-user Industry 2025 & 2033
- Figure 22: North America Low Migration Ink Market Volume Share (%), by End-user Industry 2025 & 2033
- Figure 23: North America Low Migration Ink Market Revenue (million), by Country 2025 & 2033
- Figure 24: North America Low Migration Ink Market Volume (liter ), by Country 2025 & 2033
- Figure 25: North America Low Migration Ink Market Revenue Share (%), by Country 2025 & 2033
- Figure 26: North America Low Migration Ink Market Volume Share (%), by Country 2025 & 2033
- Figure 27: Europe Low Migration Ink Market Revenue (million), by Printing Process 2025 & 2033
- Figure 28: Europe Low Migration Ink Market Volume (liter ), by Printing Process 2025 & 2033
- Figure 29: Europe Low Migration Ink Market Revenue Share (%), by Printing Process 2025 & 2033
- Figure 30: Europe Low Migration Ink Market Volume Share (%), by Printing Process 2025 & 2033
- Figure 31: Europe Low Migration Ink Market Revenue (million), by End-user Industry 2025 & 2033
- Figure 32: Europe Low Migration Ink Market Volume (liter ), by End-user Industry 2025 & 2033
- Figure 33: Europe Low Migration Ink Market Revenue Share (%), by End-user Industry 2025 & 2033
- Figure 34: Europe Low Migration Ink Market Volume Share (%), by End-user Industry 2025 & 2033
- Figure 35: Europe Low Migration Ink Market Revenue (million), by Country 2025 & 2033
- Figure 36: Europe Low Migration Ink Market Volume (liter ), by Country 2025 & 2033
- Figure 37: Europe Low Migration Ink Market Revenue Share (%), by Country 2025 & 2033
- Figure 38: Europe Low Migration Ink Market Volume Share (%), by Country 2025 & 2033
- Figure 39: South America Low Migration Ink Market Revenue (million), by Printing Process 2025 & 2033
- Figure 40: South America Low Migration Ink Market Volume (liter ), by Printing Process 2025 & 2033
- Figure 41: South America Low Migration Ink Market Revenue Share (%), by Printing Process 2025 & 2033
- Figure 42: South America Low Migration Ink Market Volume Share (%), by Printing Process 2025 & 2033
- Figure 43: South America Low Migration Ink Market Revenue (million), by End-user Industry 2025 & 2033
- Figure 44: South America Low Migration Ink Market Volume (liter ), by End-user Industry 2025 & 2033
- Figure 45: South America Low Migration Ink Market Revenue Share (%), by End-user Industry 2025 & 2033
- Figure 46: South America Low Migration Ink Market Volume Share (%), by End-user Industry 2025 & 2033
- Figure 47: South America Low Migration Ink Market Revenue (million), by Country 2025 & 2033
- Figure 48: South America Low Migration Ink Market Volume (liter ), by Country 2025 & 2033
- Figure 49: South America Low Migration Ink Market Revenue Share (%), by Country 2025 & 2033
- Figure 50: South America Low Migration Ink Market Volume Share (%), by Country 2025 & 2033
- Figure 51: Middle East and Africa Low Migration Ink Market Revenue (million), by Printing Process 2025 & 2033
- Figure 52: Middle East and Africa Low Migration Ink Market Volume (liter ), by Printing Process 2025 & 2033
- Figure 53: Middle East and Africa Low Migration Ink Market Revenue Share (%), by Printing Process 2025 & 2033
- Figure 54: Middle East and Africa Low Migration Ink Market Volume Share (%), by Printing Process 2025 & 2033
- Figure 55: Middle East and Africa Low Migration Ink Market Revenue (million), by End-user Industry 2025 & 2033
- Figure 56: Middle East and Africa Low Migration Ink Market Volume (liter ), by End-user Industry 2025 & 2033
- Figure 57: Middle East and Africa Low Migration Ink Market Revenue Share (%), by End-user Industry 2025 & 2033
- Figure 58: Middle East and Africa Low Migration Ink Market Volume Share (%), by End-user Industry 2025 & 2033
- Figure 59: Middle East and Africa Low Migration Ink Market Revenue (million), by Country 2025 & 2033
- Figure 60: Middle East and Africa Low Migration Ink Market Volume (liter ), by Country 2025 & 2033
- Figure 61: Middle East and Africa Low Migration Ink Market Revenue Share (%), by Country 2025 & 2033
- Figure 62: Middle East and Africa Low Migration Ink Market Volume Share (%), by Country 2025 & 2033
List of Tables
- Table 1: Global Low Migration Ink Market Revenue million Forecast, by Printing Process 2020 & 2033
- Table 2: Global Low Migration Ink Market Volume liter Forecast, by Printing Process 2020 & 2033
- Table 3: Global Low Migration Ink Market Revenue million Forecast, by End-user Industry 2020 & 2033
- Table 4: Global Low Migration Ink Market Volume liter Forecast, by End-user Industry 2020 & 2033
- Table 5: Global Low Migration Ink Market Revenue million Forecast, by Region 2020 & 2033
- Table 6: Global Low Migration Ink Market Volume liter Forecast, by Region 2020 & 2033
- Table 7: Global Low Migration Ink Market Revenue million Forecast, by Printing Process 2020 & 2033
- Table 8: Global Low Migration Ink Market Volume liter Forecast, by Printing Process 2020 & 2033
- Table 9: Global Low Migration Ink Market Revenue million Forecast, by End-user Industry 2020 & 2033
- Table 10: Global Low Migration Ink Market Volume liter Forecast, by End-user Industry 2020 & 2033
- Table 11: Global Low Migration Ink Market Revenue million Forecast, by Country 2020 & 2033
- Table 12: Global Low Migration Ink Market Volume liter Forecast, by Country 2020 & 2033
- Table 13: China Low Migration Ink Market Revenue (million) Forecast, by Application 2020 & 2033
- Table 14: China Low Migration Ink Market Volume (liter ) Forecast, by Application 2020 & 2033
- Table 15: India Low Migration Ink Market Revenue (million) Forecast, by Application 2020 & 2033
- Table 16: India Low Migration Ink Market Volume (liter ) Forecast, by Application 2020 & 2033
- Table 17: Japan Low Migration Ink Market Revenue (million) Forecast, by Application 2020 & 2033
- Table 18: Japan Low Migration Ink Market Volume (liter ) Forecast, by Application 2020 & 2033
- Table 19: South Korea Low Migration Ink Market Revenue (million) Forecast, by Application 2020 & 2033
- Table 20: South Korea Low Migration Ink Market Volume (liter ) Forecast, by Application 2020 & 2033
- Table 21: Rest of Asia Pacific Low Migration Ink Market Revenue (million) Forecast, by Application 2020 & 2033
- Table 22: Rest of Asia Pacific Low Migration Ink Market Volume (liter ) Forecast, by Application 2020 & 2033
- Table 23: Global Low Migration Ink Market Revenue million Forecast, by Printing Process 2020 & 2033
- Table 24: Global Low Migration Ink Market Volume liter Forecast, by Printing Process 2020 & 2033
- Table 25: Global Low Migration Ink Market Revenue million Forecast, by End-user Industry 2020 & 2033
- Table 26: Global Low Migration Ink Market Volume liter Forecast, by End-user Industry 2020 & 2033
- Table 27: Global Low Migration Ink Market Revenue million Forecast, by Country 2020 & 2033
- Table 28: Global Low Migration Ink Market Volume liter Forecast, by Country 2020 & 2033
- Table 29: United States Low Migration Ink Market Revenue (million) Forecast, by Application 2020 & 2033
- Table 30: United States Low Migration Ink Market Volume (liter ) Forecast, by Application 2020 & 2033
- Table 31: Canada Low Migration Ink Market Revenue (million) Forecast, by Application 2020 & 2033
- Table 32: Canada Low Migration Ink Market Volume (liter ) Forecast, by Application 2020 & 2033
- Table 33: Mexico Low Migration Ink Market Revenue (million) Forecast, by Application 2020 & 2033
- Table 34: Mexico Low Migration Ink Market Volume (liter ) Forecast, by Application 2020 & 2033
- Table 35: Global Low Migration Ink Market Revenue million Forecast, by Printing Process 2020 & 2033
- Table 36: Global Low Migration Ink Market Volume liter Forecast, by Printing Process 2020 & 2033
- Table 37: Global Low Migration Ink Market Revenue million Forecast, by End-user Industry 2020 & 2033
- Table 38: Global Low Migration Ink Market Volume liter Forecast, by End-user Industry 2020 & 2033
- Table 39: Global Low Migration Ink Market Revenue million Forecast, by Country 2020 & 2033
- Table 40: Global Low Migration Ink Market Volume liter Forecast, by Country 2020 & 2033
- Table 41: Germany Low Migration Ink Market Revenue (million) Forecast, by Application 2020 & 2033
- Table 42: Germany Low Migration Ink Market Volume (liter ) Forecast, by Application 2020 & 2033
- Table 43: United Kingdom Low Migration Ink Market Revenue (million) Forecast, by Application 2020 & 2033
- Table 44: United Kingdom Low Migration Ink Market Volume (liter ) Forecast, by Application 2020 & 2033
- Table 45: France Low Migration Ink Market Revenue (million) Forecast, by Application 2020 & 2033
- Table 46: France Low Migration Ink Market Volume (liter ) Forecast, by Application 2020 & 2033
- Table 47: Italy Low Migration Ink Market Revenue (million) Forecast, by Application 2020 & 2033
- Table 48: Italy Low Migration Ink Market Volume (liter ) Forecast, by Application 2020 & 2033
- Table 49: Rest of Europe Low Migration Ink Market Revenue (million) Forecast, by Application 2020 & 2033
- Table 50: Rest of Europe Low Migration Ink Market Volume (liter ) Forecast, by Application 2020 & 2033
- Table 51: Global Low Migration Ink Market Revenue million Forecast, by Printing Process 2020 & 2033
- Table 52: Global Low Migration Ink Market Volume liter Forecast, by Printing Process 2020 & 2033
- Table 53: Global Low Migration Ink Market Revenue million Forecast, by End-user Industry 2020 & 2033
- Table 54: Global Low Migration Ink Market Volume liter Forecast, by End-user Industry 2020 & 2033
- Table 55: Global Low Migration Ink Market Revenue million Forecast, by Country 2020 & 2033
- Table 56: Global Low Migration Ink Market Volume liter Forecast, by Country 2020 & 2033
- Table 57: Brazil Low Migration Ink Market Revenue (million) Forecast, by Application 2020 & 2033
- Table 58: Brazil Low Migration Ink Market Volume (liter ) Forecast, by Application 2020 & 2033
- Table 59: Argentina Low Migration Ink Market Revenue (million) Forecast, by Application 2020 & 2033
- Table 60: Argentina Low Migration Ink Market Volume (liter ) Forecast, by Application 2020 & 2033
- Table 61: Rest of South America Low Migration Ink Market Revenue (million) Forecast, by Application 2020 & 2033
- Table 62: Rest of South America Low Migration Ink Market Volume (liter ) Forecast, by Application 2020 & 2033
- Table 63: Global Low Migration Ink Market Revenue million Forecast, by Printing Process 2020 & 2033
- Table 64: Global Low Migration Ink Market Volume liter Forecast, by Printing Process 2020 & 2033
- Table 65: Global Low Migration Ink Market Revenue million Forecast, by End-user Industry 2020 & 2033
- Table 66: Global Low Migration Ink Market Volume liter Forecast, by End-user Industry 2020 & 2033
- Table 67: Global Low Migration Ink Market Revenue million Forecast, by Country 2020 & 2033
- Table 68: Global Low Migration Ink Market Volume liter Forecast, by Country 2020 & 2033
- Table 69: Saudi Arabia Low Migration Ink Market Revenue (million) Forecast, by Application 2020 & 2033
- Table 70: Saudi Arabia Low Migration Ink Market Volume (liter ) Forecast, by Application 2020 & 2033
- Table 71: South Africa Low Migration Ink Market Revenue (million) Forecast, by Application 2020 & 2033
- Table 72: South Africa Low Migration Ink Market Volume (liter ) Forecast, by Application 2020 & 2033
- Table 73: Rest of Middle East and Africa Low Migration Ink Market Revenue (million) Forecast, by Application 2020 & 2033
- Table 74: Rest of Middle East and Africa Low Migration Ink Market Volume (liter ) Forecast, by Application 2020 & 2033
Frequently Asked Questions
1. What is the projected Compound Annual Growth Rate (CAGR) of the Low Migration Ink Market?
The projected CAGR is approximately 6.3%.
2. Which companies are prominent players in the Low Migration Ink Market?
Key companies in the market include Marabu GmbH & Co KG, Epple Druckfarben AG, MHM Holding GmbH, SEIKO EPSON CORP, Altana, Sun Chemical, TOYO INK CO LTD, FUJIFILM Corporation, HAPA AG, HP Development Company L P, Encres Dubuit, Wikoff Color Corporation*List Not Exhaustive, Siegwerk Druckfarben AG & Co KGaA, INX International Ink Co, hubergroup Deutschland GmbH, Kao Collins Corporation, SPGPrints B V, Flint Group, Agfa-Gevaert Group, RUCO Druckfarben.
3. What are the main segments of the Low Migration Ink Market?
The market segments include Printing Process, End-user Industry.
4. Can you provide details about the market size?
The market size is estimated to be USD 488.6 million as of 2022.
5. What are some drivers contributing to market growth?
; Significant Growth in Food and Beverage Industry; Rise in Demand for Personal Care Products.
6. What are the notable trends driving market growth?
Significant Growth in Food and Beverage Industry.
7. Are there any restraints impacting market growth?
; High Cost Compared to Conventional Inks; Unfavorable Conditions Arising Due to COVID-19 Outbreak.
8. Can you provide examples of recent developments in the market?
The Low Migration Ink Market has witnessed several significant developments in recent years: Launch of new ultra-low-migration inks by leading players Strategic acquisitions and partnerships to expand product portfolios Development of AI-assisted ink formulation technologies Growing investment in sustainable ink production processes
9. What pricing options are available for accessing the report?
Pricing options include single-user, multi-user, and enterprise licenses priced at USD 4750, USD 5250, and USD 8750 respectively.
10. Is the market size provided in terms of value or volume?
The market size is provided in terms of value, measured in million and volume, measured in liter .
11. Are there any specific market keywords associated with the report?
Yes, the market keyword associated with the report is "Low Migration Ink Market," which aids in identifying and referencing the specific market segment covered.
12. How do I determine which pricing option suits my needs best?
The pricing options vary based on user requirements and access needs. Individual users may opt for single-user licenses, while businesses requiring broader access may choose multi-user or enterprise licenses for cost-effective access to the report.
13. Are there any additional resources or data provided in the Low Migration Ink Market report?
While the report offers comprehensive insights, it's advisable to review the specific contents or supplementary materials provided to ascertain if additional resources or data are available.
14. How can I stay updated on further developments or reports in the Low Migration Ink Market?
To stay informed about further developments, trends, and reports in the Low Migration Ink Market, consider subscribing to industry newsletters, following relevant companies and organizations, or regularly checking reputable industry news sources and publications.
Methodology
Step 1 - Identification of Relevant Samples Size from Population Database


Step 2 - Approaches for Defining Global Market Size (Value, Volume* & Price*)

Note*: In applicable scenarios
Step 3 - Data Sources
Primary Research
- Web Analytics
- Survey Reports
- Research Institute
- Latest Research Reports
- Opinion Leaders
Secondary Research
- Annual Reports
- White Paper
- Latest Press Release
- Industry Association
- Paid Database
- Investor Presentations

Step 4 - Data Triangulation
Involves using different sources of information in order to increase the validity of a study
These sources are likely to be stakeholders in a program - participants, other researchers, program staff, other community members, and so on.
Then we put all data in single framework & apply various statistical tools to find out the dynamic on the market.
During the analysis stage, feedback from the stakeholder groups would be compared to determine areas of agreement as well as areas of divergence